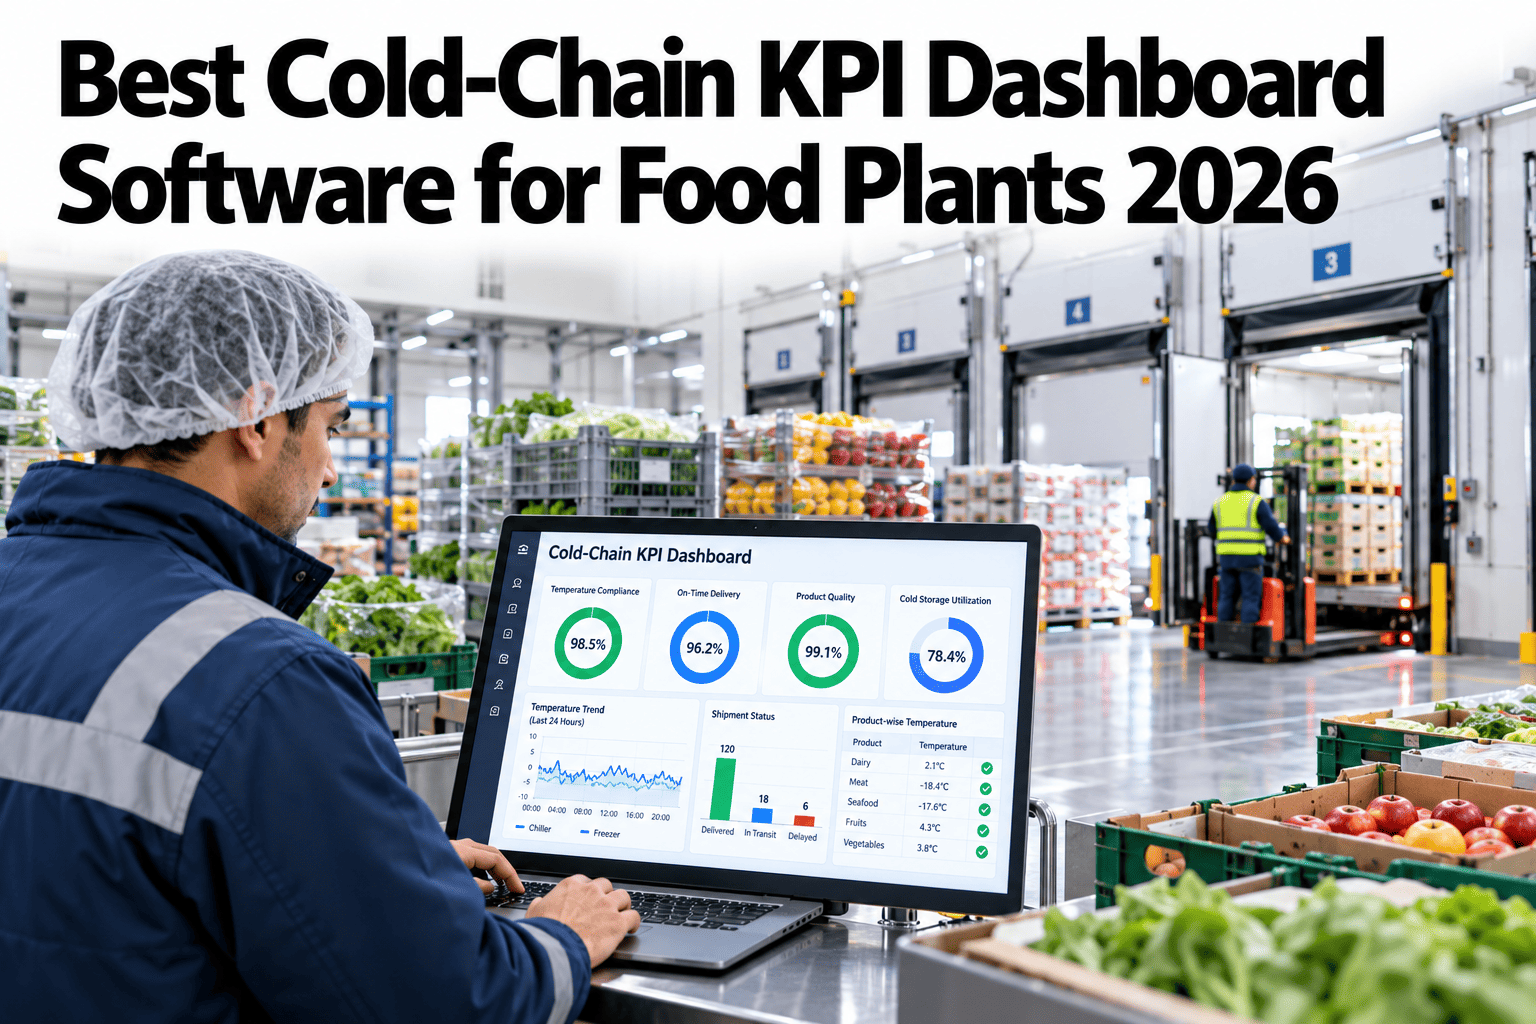
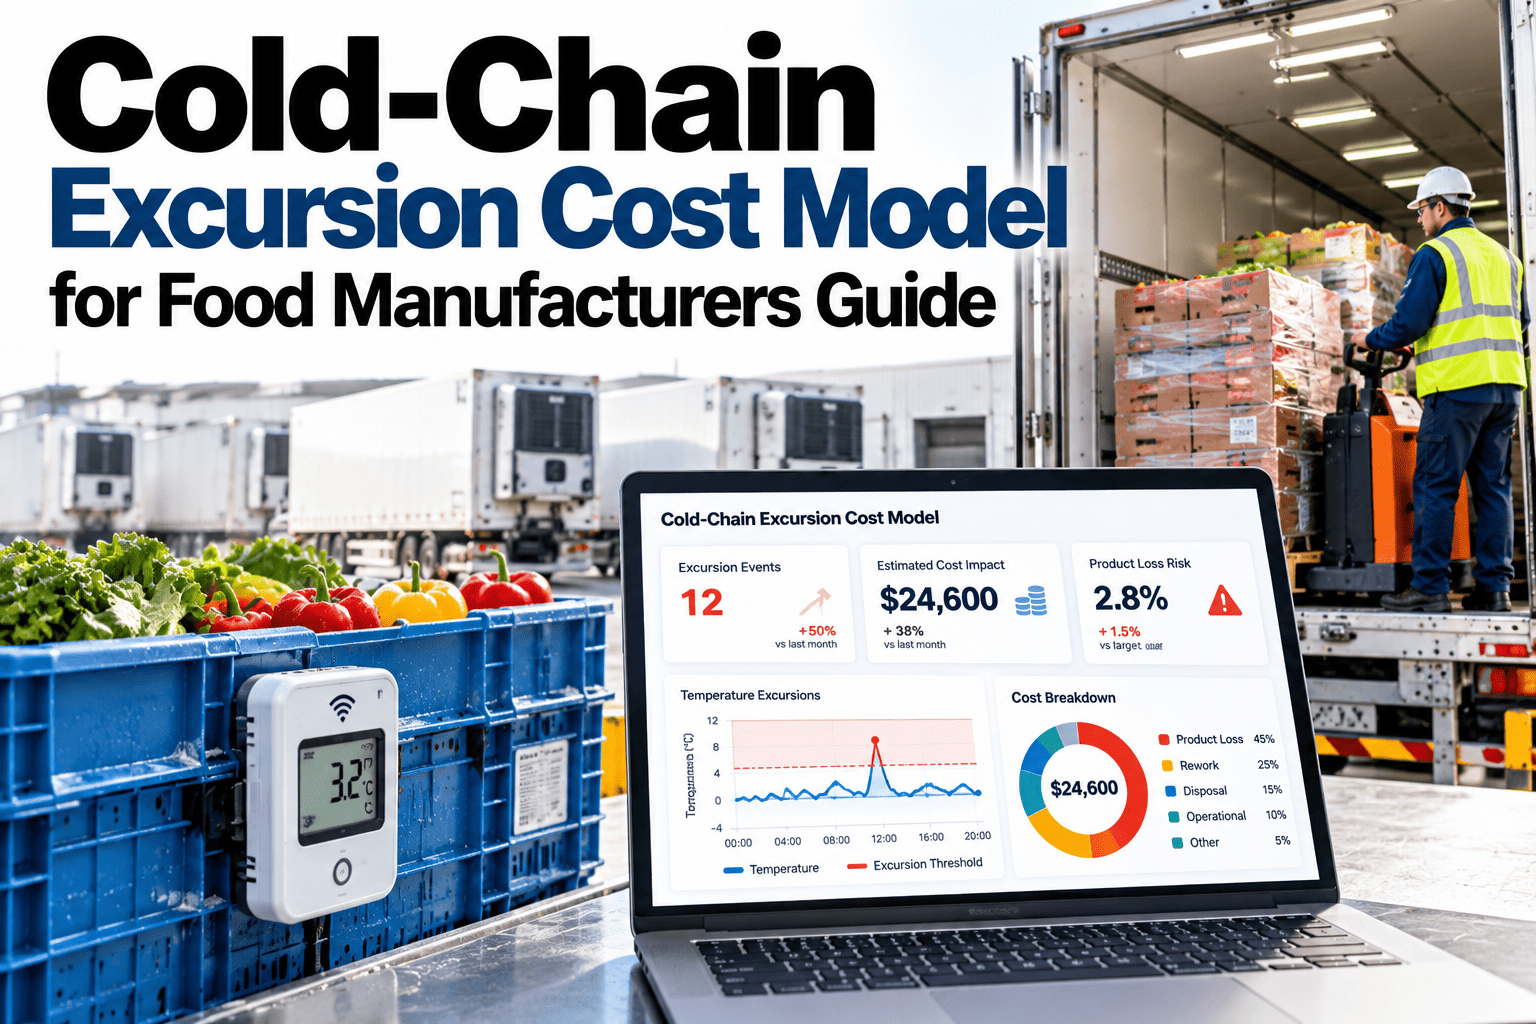
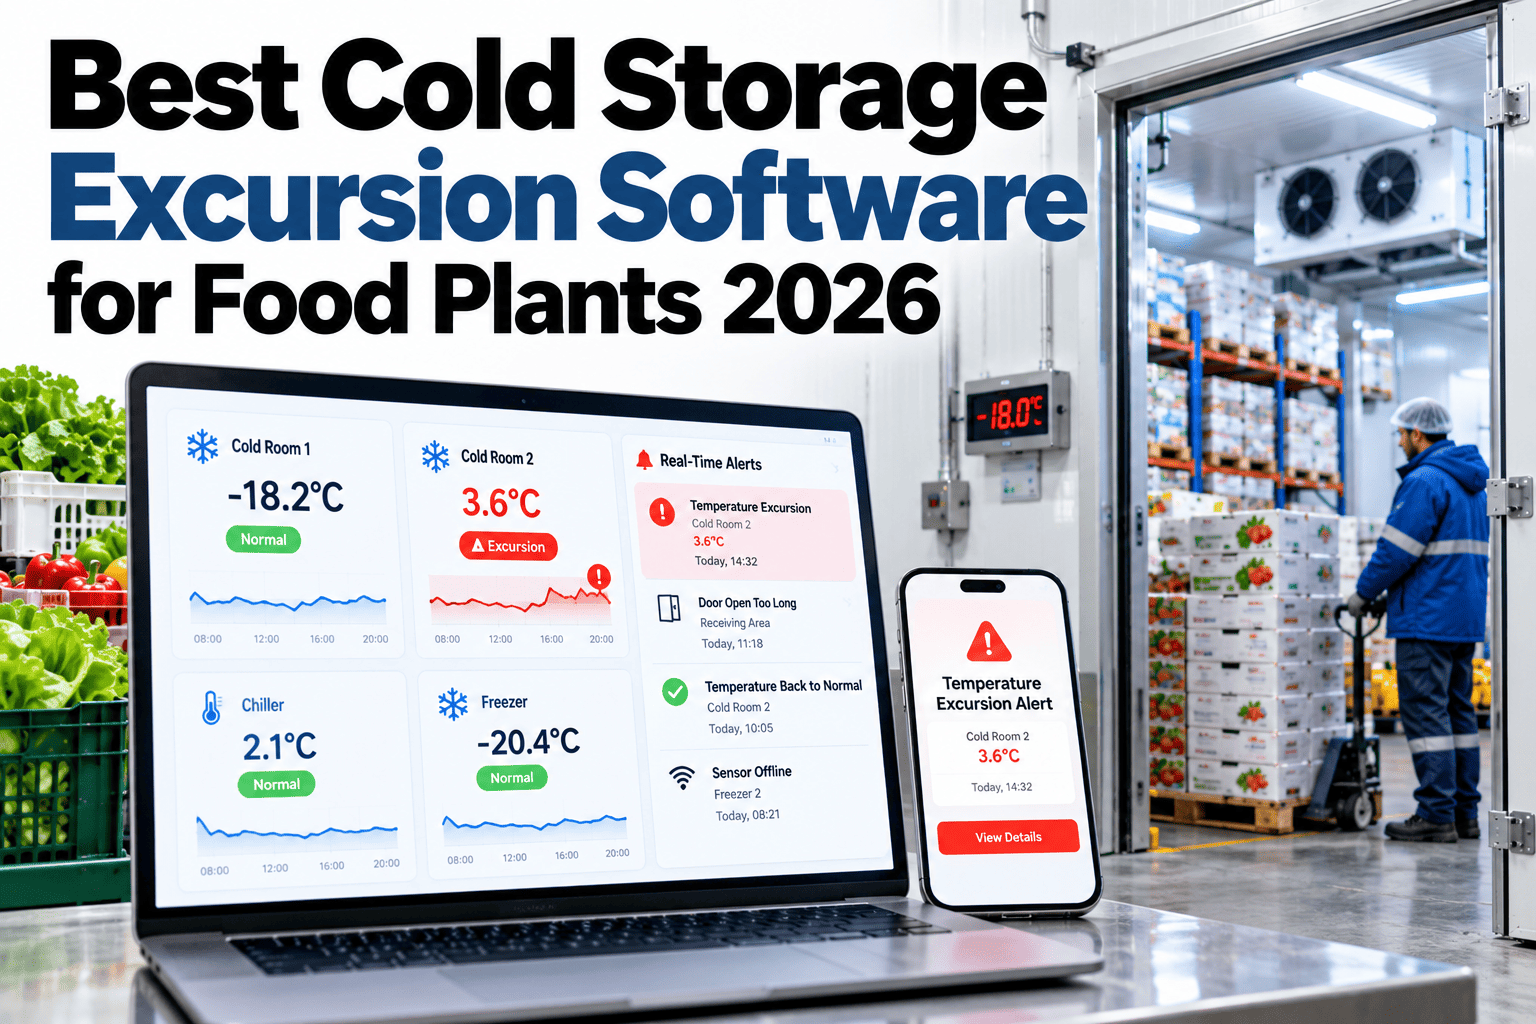
Cold-chain teams are often rich in alarms and poor in measures, so they know when a sensor beeped but not whether the system is getting better. A good KPI dashboard turns raw temperature data into a handful of numbers that show how often things go wrong, how fast they are fixed and how much product is at risk. This guide covers six KPIs that work together, and how to present them in real time. To see a dashboard built around your own data, you can preview a cold-chain scorecard with our team.
Cold-chain performance for food manufacturers
Track Six Cold-Chain KPIs in Real Time and Know Exactly Where You Stand
iFactory AI turns temperature and event data into a live scorecard of excursion rate, recovery time, dwell time and product at risk.
Six KPIs, one scorecard
Excursion rateMean recoveryDwell timeProduct at riskResponse timeData coverage
Alarms are not KPIsCounting Beeps Does Not Show Whether You Are Improving
Alarm counts depend on thresholds and sensor settings. KPIs measure outcomes that matter.
How often?
Excursions per unit of time
How long?
Time to recover and time outside range
How much?
Value of product exposed
How fast?
Time to notice and respond
These four questions lead to the six KPIs below.
The six KPIsWhat to Measure and Why
1
Excursion rate
How often a room or trailer leaves its range, normalised by monitored time.
2
Mean recovery time
How long it takes to return to range after an excursion.
3
Dwell time
How long product spends outside controlled conditions, for example on a dock.
4
Product at risk
The value of product exposed during excursions.
5
Alarm response time
Time from alarm to a person acknowledging and acting.
6
Data coverage
Share of expected readings received from sensors.
The formulasDefine Each KPI in Writing
Excursion rate = excursions / monitored room-hours x 1,000
Mean recovery time = total recovery minutes / number of excursions
6
Excursions in the period
12,000
Monitored room-hours
0.5
Excursions per 1,000 room-hours
30 min
Mean recovery with 180 recovery minutes
The numbers above are illustrative. Use your own data and write down every definition so teams read the figures the same way.
See Your Cold Chain as Six Clear Numbers
Share a month of temperature and event data and see how iFactory AI would calculate and display your cold-chain KPIs.
KPI referenceHow Each Measure Is Calculated, Reviewed and Owned
| KPI | How it is calculated | Review | Owner |
|---|
| Excursion rate | Excursions per monitored room-hours | Weekly | Cold chain lead |
| Mean recovery time | Average minutes from excursion to recovery | Weekly | Maintenance lead |
| Dwell time | Average time outside controlled conditions | Daily | Warehouse lead |
| Product at risk | Quantity exposed times unit value | Monthly | Quality manager |
| Alarm response time | Minutes from alarm to acknowledgement | Weekly | Shift supervisors |
| Data coverage | Readings received over readings expected | Daily | Controls or IT lead |
Why excursions happenAn Illustrative Split of Excursion Causes
Knowing causes helps prioritise fixes. This example is illustrative.
35 percent: Door and loading practice
Long openings and busy periods.
25 percent: Refrigeration faults
Equipment issues and poor defrost.
25 percent: Power or control issues
Short outages and setpoint errors.
15 percent: Sensor or data issues
False readings and gaps.
Report KPIs by cause, room and shift. Averages across the whole site can hide where the biggest gains are.
Views by roleShow Each Person the Numbers They Can Act On
Operator view
Live status, current alarms and next steps.
Quality and site view
Excursion rate, recovery time, product at risk.
Enterprise view
Comparison across sites and trends over time.
The numbers should be the same on every view, with more detail where it is needed. To design your views, ask our team for a dashboard layout guide.
What improvement looks likeBefore and After a Dashboard Programme
Track the same measures before and after introducing the scorecard. This view is illustrative.
Good versus weak dashboardsWhat Separates a Useful Scorecard From a Wall of Charts
Weak dashboard
Dozens of charts with no targets
Alarm counts instead of outcomes
Data hours or days old
No owner for any number
Strong dashboard
Six clear KPIs with targets
Outcomes tied to risk and cost
Live or near-live data
Every KPI has an owner and review date
RolloutThree Phases From First View to Weekly Habit
Phase 1
Pick the six KPIs, write the definitions and check data quality.
Phase 2
Build the first scorecard and run it beside current reports.
Phase 3
Set targets, assign owners and review weekly.
Six KPIs chosen and defined in writing
Monitored hours and excursions counted consistently
Recovery time measured from clear start and end points
Dwell time captured at docks and transfers
Product at risk valued with finance input
Alarm response time tracked automatically
Data coverage monitored daily
Targets and owners set for every KPI
Expert reviewWhat a Supply Chain Quality Director Would Check First
Expert review
A scorecard works when every number has a clear definition and an owner. Beautiful charts without ownership produce interest but not improvement.
VerdictStrong when KPIs are few, defined and reviewed on a fixed rhythm.
Watch forAverages that hide a single bad room or shift.
Do nextCalculate the six KPIs by hand for one month and then automate them.
Frequently asked questionsWhat Food Manufacturers Ask About Cold-Chain KPIs
Why use KPIs instead of alarm counts?
Alarm counts reflect threshold settings and sensor behaviour, not outcomes. KPIs such as excursion rate and mean recovery time show whether the cold chain is actually improving and where to act.
See a KPI example.
How do we value product at risk?
Multiply the quantity exposed by a unit value agreed with finance, using cost rather than selling price unless you decide otherwise. Show the assumption on the dashboard.
Ask about valuation methods.
What is dwell time?
Dwell time is how long product spends outside controlled conditions, for example on a dock during loading. Measuring it highlights handover and loading practices that drive excursions.
Discuss dwell time measurement.
How often should the scorecard be reviewed?
Review operational measures daily or weekly and strategic measures monthly. Assign each KPI an owner and a review date so action follows the numbers.
Ask about review routines.
What if our sensors have gaps?
Track data coverage as its own KPI, since gaps weaken every other number. Fix sensor and network problems first, then rely on the rest of the scorecard.
Plan data quality checks.
Measure, own, improve
Turn Cold-Chain Data Into a Scorecard People Act On
Book a session with iFactory AI to define your KPIs, check your data and build a live cold-chain dashboard for every level of your team.