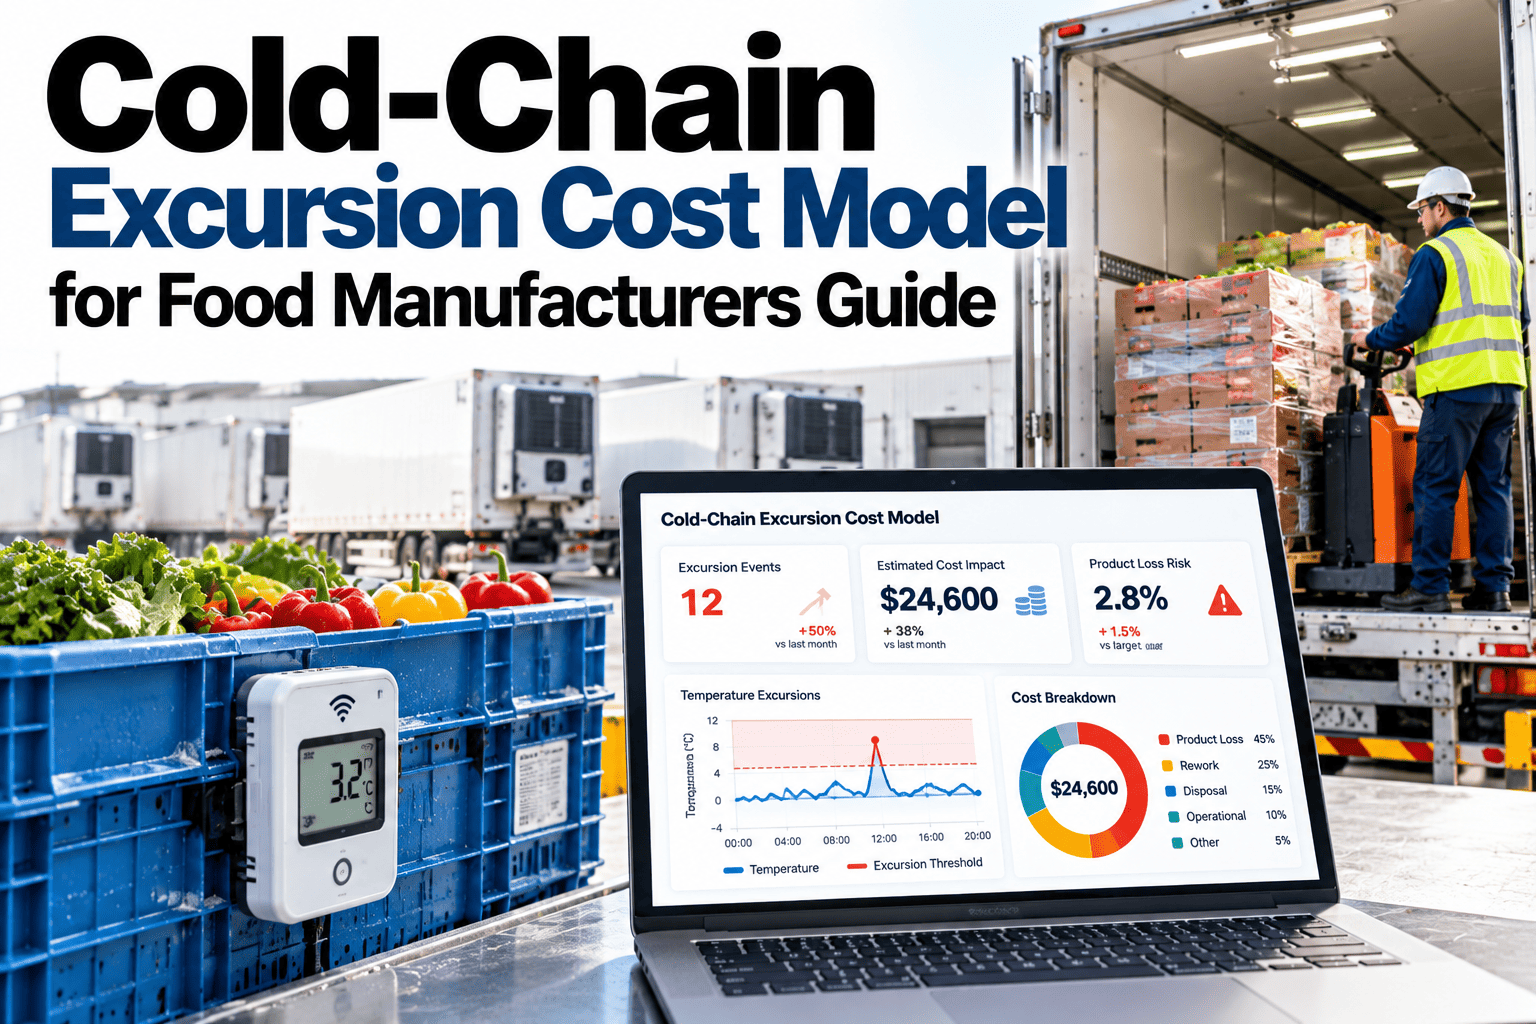
A four-hour excursion on a full trailer rarely stays a four-hour problem. By the time the product value, the freight already spent, the disposal fee, the replacement order and the customer credit are all added up, one event on one load can run into the five or six figures. Most plants track the obvious piece, the product cost, and miss the rest, which means the real size of the risk never reaches the people who approve budget for prevention. Finance and operations leaders can build a full excursion cost model with iFactory AI using their own numbers instead of estimating from the product line alone.
The Product on the Trailer Is Rarely the Biggest Number
iFactory AI pulls every cost component of an excursion into one model, so the number that reaches leadership is the real one.
Five Cost Components Most Plants Undercount
Product value
The obvious piece, often the only one tracked.
Freight already spent
Fuel, driver time and trailer rental, sunk regardless of outcome.
Disposal and handling
Fees for discard, plus labor to sort and document the loss.
Replacement order
A rushed reorder, often at expedited cost and short notice.
Customer credit or claim
Short shipment penalties, credits, or a damaged relationship.
Building the Model, Line by Line
| Line Item | How to Estimate It | Commonly Missed Because |
|---|---|---|
| Product cost | Units lost at standard cost, not retail price | Usually tracked, rarely missed |
| Freight | Full trip cost regardless of delivery outcome | Booked to transportation, not the incident |
| Disposal | Fee per unit plus labor hours to process | Buried in a general waste account |
| Replacement | Expedited production or freight premium | Treated as normal order cost |
| Customer impact | Credit issued plus estimated relationship risk | Handled by sales, not reported back |
See the Full Cost of Your Last Excursion
Bring the details of a recent event to a 30-minute session and total every line, not just the product.
Product Value vs Full Cost
Duration and Severity Change the Total Fast
A Composite Scenario: The Load That Looked Like a Small Loss
Picture a trailer that runs warm for four hours on a long route. The initial report lists only the spoiled product, which looks manageable on its own.
Once freight, disposal, an expedited replacement run and a customer credit are added, the real total is several times the product line alone. A full cost model would have made that visible to leadership from the first report, not after the quarter closes.
Where iFactory AI Fits
Captures every line
Ties freight, disposal, replacement and credit data to each excursion event.
Scales with duration
Links cost estimates to how long and how severe the excursion was.
Builds the business case
Turns prevention spend into a comparison against real historical losses.
Reports to leadership
Presents the full number, not just the product line, for budget decisions.
Expert Review
A supply chain finance perspective, reviewed for accuracy before publication: the single biggest reason cold-chain prevention projects struggle to get funded is that the cost of inaction is reported wrong. When only the spoiled product line reaches the budget conversation, the number looks small enough to accept as a cost of doing business. Once freight, disposal, expedited replacement and customer impact are added honestly, the same event usually justifies the investment several times over.
Frequently Asked Questions
What costs belong in a cold-chain excursion cost model?
At minimum, product value at standard cost, freight already spent regardless of outcome, disposal fees and labor, the cost of an expedited replacement order, and any customer credit or claim tied to the event. Plants that stop at product value alone typically understate the real cost by a wide margin. You can see a full cost breakdown built from a real excursion example in a short session.
Why does freight cost still apply if the product is discarded?
Freight is largely a sunk cost once the trailer has traveled the route. Fuel, driver time and trailer usage were spent whether the load arrived in good condition or not, so that cost belongs in the excursion total even though it looks unrelated to the product loss itself. Ask for a review of how freight costs should be allocated in your reporting.
How do we estimate customer relationship impact in dollar terms?
Start with the concrete pieces: any credit or claim paid, the cost of expedited replacement to meet the customer's need date, and any contractual penalty for a short shipment. Relationship risk beyond that is harder to price precisely, but even the concrete pieces alone usually make the true cost far higher than product value. Explore how to capture the customer-facing costs you can measure directly.
Does excursion duration change the cost in a predictable way?
Generally, yes. A short excursion caught quickly often stays recoverable, while duration and severity both push the likelihood of a full discard higher. The exact curve depends on the product and its packaging, but tracking duration against outcome over time builds a plant-specific picture that is more useful than a generic rule. Try a review of how duration has tracked with cost in your own past events.
How do we use this model to justify a monitoring investment?
Total the full cost of recent excursions, including the commonly missed lines, and compare that against the cost of better detection and alerting. Because a single severe event can run into five or six figures once every cost component is included, even one avoided excursion often covers a meaningful share of the investment. Join a session that builds this comparison from your own incident history.
See the Real Number Before the Next Excursion
iFactory AI totals every cost of a cold-chain event so prevention gets judged against the true risk. Book a walkthrough with your own data.