Food plants track plenty of numbers, but most reliability reports still arrive as a monthly spreadsheet pulled together from three or four separate systems. By the time MTBF, wrench time and PM compliance land in one view, the shift that caused the drop is long over and the context is gone. A scorecard that updates as work orders close and PMs complete gives maintenance leaders a live read instead of a monthly postmortem. Choosing the right software for 2026 means checking how many KPIs it actually tracks together and how current the numbers stay. Reliability teams comparing options can see all 14 KPIs updating live on one iFactory AI scorecard before building a shortlist.
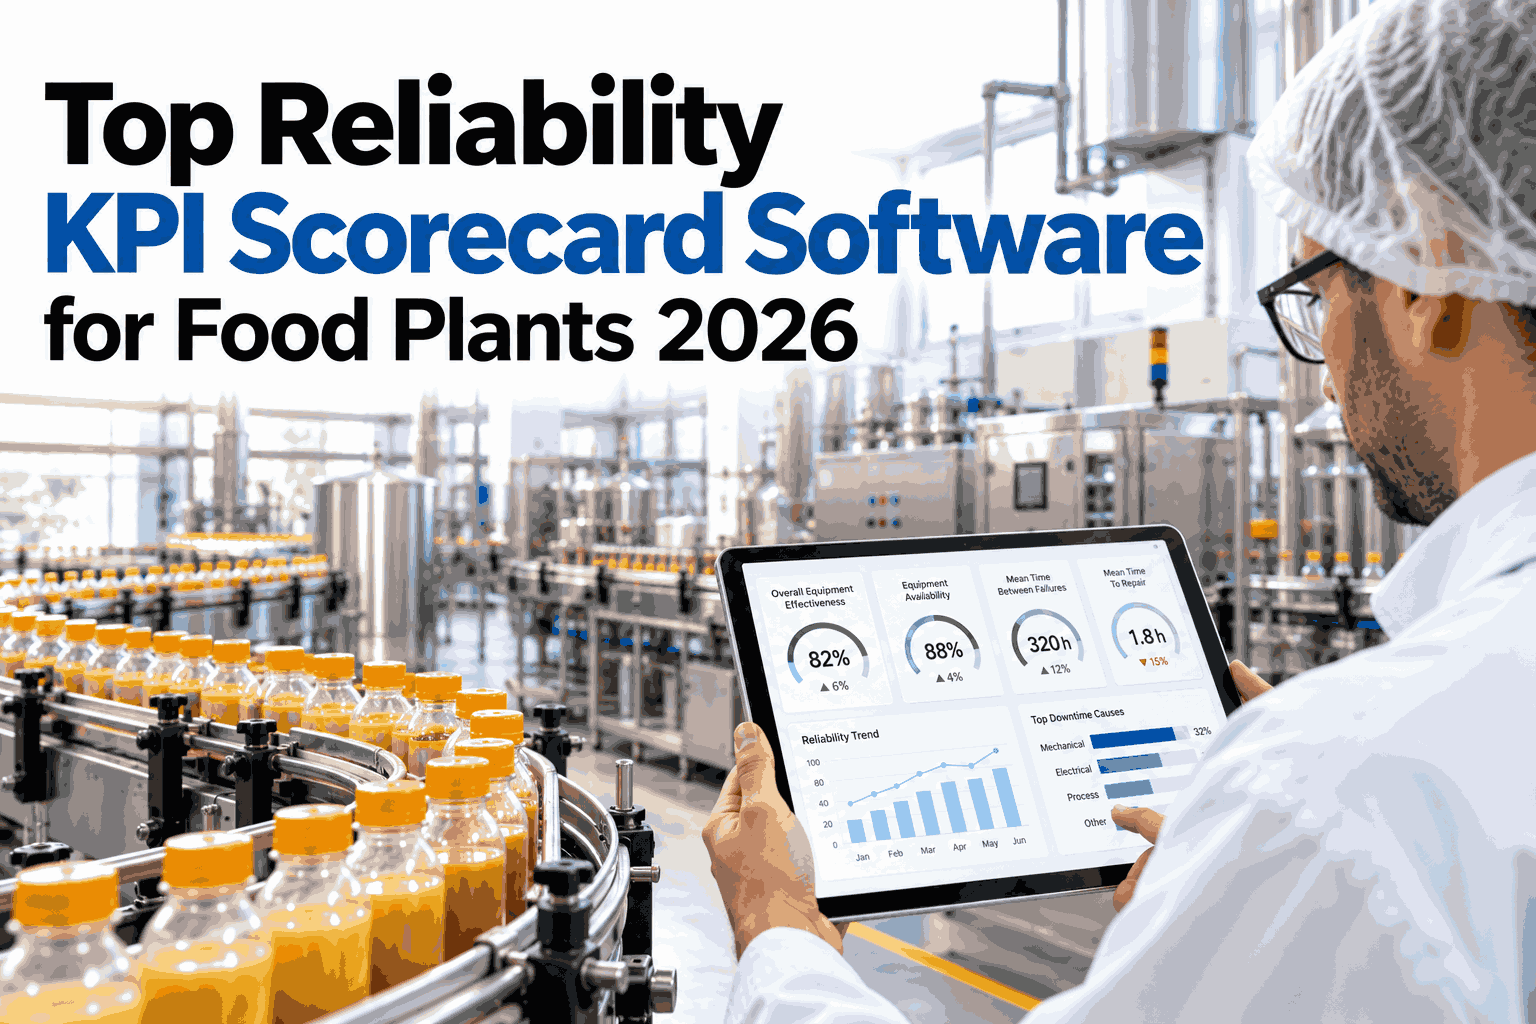
Top Reliability KPI Scorecard Software for Food Plants 2026
MTBF, MTTR, PM compliance, PMO ratio, wrench time, schedule compliance and 8 more KPIs, live on one screen.
Why a Single Scorecard Beats Scattered Reports
Most plants already track reliability data somewhere. The problem is rarely missing data; it is three issues that keep the numbers apart.
Monthly reports mean a bad week is already over before anyone sees the trend forming.
CMMS records, sensor data and manual logs rarely feed the same report automatically.
MTBF or wrench time calculated differently across lines makes comparison unreliable.
A scorecard earns its place by fixing all three: one definition per KPI, one live feed, and one screen for every line in the plant.
14 Reliability KPIs on One Scorecard
Each KPI falls into one of three groups, and a complete scorecard tracks all three together instead of picking a favourite metric.
See All 14 KPIs on Your Own Plant Data
Book a 30-minute session and iFactory AI will show the full scorecard calculated live from your CMMS and downtime logs.
Core Formulas at a Glance
Consistent formulas matter more than one impressive-looking number. Use this table to check a vendor calculates KPIs the same way your team already does.
| KPI | Formula | Good Practice Target |
|---|---|---|
| MTBF | Total uptime divided by number of failures | Trending upward over time |
| MTTR | Total repair time divided by number of repairs | Trending downward over time |
| PM Compliance | PMs completed on time divided by PMs scheduled | 90% or higher |
| PMO Ratio | Planned maintenance hours divided by overtime hours | Higher is better |
| Wrench Time | Hands-on repair time divided by total time on the clock | 50 to 60% |
| Schedule Compliance | Work completed as scheduled divided by total scheduled work | 85% or higher |
How the Scorecard Stays Current
The scorecard runs on a continuous loop rather than a scheduled export, so numbers move as work actually happens on the floor.
Work order status, PM completions and downtime events are pulled in as they happen.
Each KPI is recalculated using one consistent formula across every line.
Current values are set against targets and against the plant's own trend line.
A KPI that drifts past its target is flagged to the reliability lead automatically.
Where Top Quartile Food Plants Land
Benchmarks vary by line type and product, but these ranges are a reasonable starting point for most food and beverage plants.
Treat these as a starting target rather than a pass or fail line. A plant's own trend over time usually matters more than one outside number.
Inside the iFactory AI Reliability Scorecard
The dashboard pulls CMMS, sensor and downtime data into one live view built for the reliability team.
Live KPI Feed
All 14 metrics recalculate as work orders close, not once a month when the report is due.
Line and Shift Breakdown
Every KPI can be split by line, shift and asset class to find where the number actually comes from.
Root Cause Linking
A dip in wrench time or schedule compliance is linked back to the work orders behind it.
Plain-Language Queries
Managers can ask which line has the worst PM compliance this quarter and get a ranked answer.
iFactory AI ships on a pre-configured NVIDIA server, racked and ready with software pre-loaded. Scope covers CMMS integration, KPI formula mapping, team training and 24x7 remote monitoring.
Frequently Asked Questions
Does this replace our CMMS?
No, the scorecard reads from the CMMS rather than replacing it. Work orders, PMs and failure records stay where the team already enters them, and the scorecard pulls that data to calculate KPIs continuously. This avoids asking technicians to change how they log work. You can see a live CMMS connection in a demo session.
Can KPI formulas be adjusted to match our own definitions?
Yes, formulas such as MTBF or wrench time can be set to match how the plant already calculates them, so historical comparisons stay valid. Some plants adjust definitions during onboarding once they see where small inconsistencies were hiding. Either way the final formula is agreed with the reliability team before go-live. Ask support about formula mapping during setup.
How often do the numbers actually update?
KPIs recalculate as new data arrives from the CMMS and sensors, typically within minutes of a work order closing or a PM being marked complete. This is different from a nightly or weekly batch report that only reflects yesterday's work. A manager checking the scorecard mid-shift sees numbers from that same shift. Watch a live update happen in a short walkthrough.
Can different lines or plants be compared fairly?
Lines can be compared once formulas and targets are standardised, but raw comparison without context can be misleading if lines run different products or ages of equipment. The scorecard shows each line against its own trend first, then against peers. This keeps the comparison useful rather than punitive. Request a multi-line comparison demo to see how it is presented.
What does the rollout involve for a multi-plant group?
A single plant is typically live within six to ten weeks, and additional plants move faster once CMMS integration and formula mapping are already proven at the first site. Most groups start with their highest-downtime plant and expand once the formulas and targets are validated. Contact support for a rollout plan across multiple sites.
See Every Reliability KPI in One Live View
iFactory AI tracks MTBF, MTTR, wrench time and 11 more KPIs as work happens on the floor. Book a walkthrough on your own data.