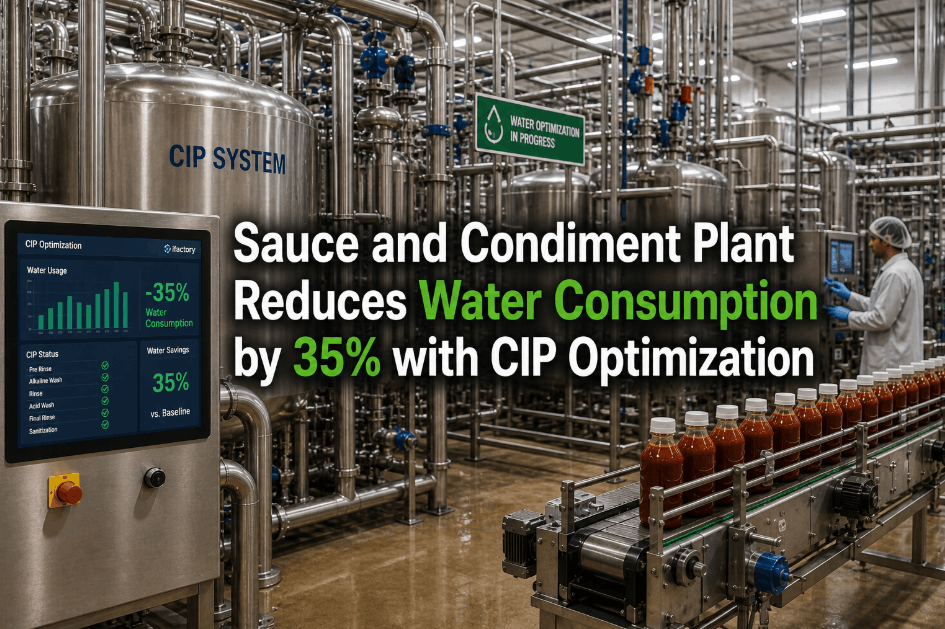
A mid-sized sauce and condiment manufacturing facility processing over 18,000 metric tons of product annually was consuming far more water than industry benchmarks across its Clean-In-Place (CIP) operations. With no real-time visibility into CIP cycle performance, chemical concentration levels, or rinse completion status, the plant's engineering and sustainability teams had no actionable mechanism to reduce waste without risking product contamination or regulatory non-compliance. Following a structured deployment of ifactory's Energy & ESG Reporting platform, the plant achieved a 35% reduction in total water consumption, cut CIP chemical expenditure by 29%, and established full automated rinse verification across all 11 production lines within 47 days.
WATER EFFICIENCY STARTS WITH VISIBILITY
Stop Wasting Water on CIP Cycles You Can't Measure
See exactly how ifactory's AI-driven CIP optimization delivers measurable water savings across every production line — without compromising hygiene standards.
01 / The Facility
A High-Volume Condiment Plant Operating Without CIP Intelligence
Facility TypeSauce and condiment manufacturing plant. Eleven active production lines. Four dedicated CIP skid systems. Two allergen-segregated filling halls. Primary product categories: hot sauces, ketchup variants, mayonnaise, and salad dressings.
Scale18,000+ metric tons of product annually. CIP cycles executed across all 11 lines at an average of 3.4 cycles per line per day. Total pre-deployment water consumption: 9.2 million liters per month dedicated to CIP operations alone.
Operations Team24-person operations and quality engineering team. Three CIP supervisors, 14 line technicians, seven quality assurance and compliance coordinators. Specializations: food hygiene, chemical handling, fluid dynamics, and ESG reporting.
CIP Cycle VolumeAveraging 37.4 CIP cycles per day across all production lines. Pre-deployment cycle durations were fixed by calendar schedule regardless of actual soil load — with no adaptive logic, no conductivity verification, and no real-time rinse quality confirmation.
Prior SystemManual CIP scheduling based on fixed time intervals. No conductivity or turbidity monitoring. Chemical dosing calculated manually per batch. Rinse completion assessed by operator visual inspection only. No ESG water consumption data at line level.
Annual CIP Operating CostPre-deployment annual CIP-related operating cost of approximately $2.21 million — comprising water procurement, chemical consumables, energy for heating CIP circuits, and wastewater treatment discharge. Benchmarked 34% above industry average for equivalent production volume.
02 / The Challenge
The Hidden Cost of Fixed-Schedule CIP in a High-Throughput Condiment Facility
Clean-In-Place operations in sauce and condiment manufacturing are non-negotiable from a food safety and regulatory standpoint — but the volume of water, chemical, and energy consumed in each cycle is directly tied to how intelligently the process is managed. This plant's CIP model was entirely schedule-driven. Every cycle ran to a fixed time duration, consumed a preset chemical volume, and was cleared for completion through operator sign-off rather than measured cleanliness confirmation. The consequence was systematic over-rinsing, chemical waste from imprecise dosing, and no mechanism to correlate CIP resource consumption with actual product soil load across different SKUs and production runs. Without sensor-driven cycle management, every CIP cycle consumed maximum resource — regardless of whether maximum resource was required.
9.2M
Liters of water per month on CIP alone
Monthly CIP water consumption of 9.2 million liters — with no line-level metering, no cycle-level tracking, and no visibility into which lines, product types, or shift patterns were driving the highest water demand per unit of output.
34%
Above industry benchmark for CIP cost
At $2.21 million annually in CIP-related operating cost against an industry benchmark of $1.65 million for comparable output, the plant's quality and sustainability leadership identified CIP optimization as the single highest-return efficiency opportunity available without capital equipment replacement.
0%
CIP cycles with automated rinse verification
Not a single CIP cycle across all 11 production lines used automated conductivity or turbidity measurement to confirm rinse completion. Operator visual checks were the only quality gate — inconsistent across shifts and impossible to audit for regulatory documentation purposes.
±38%
Variance in chemical dosing accuracy
Manual chemical dosing calculations produced up to 38% variance from target concentrations across cycles. Under-dosing risked hygiene compliance; over-dosing generated excess chemical waste, elevated wastewater treatment costs, and unnecessary environmental discharge load.
"We knew we were using more water and chemical than we needed — but without data at the cycle level, we had no way to prove it, no way to target it, and no defensible path to reduction that wouldn't put product safety at risk."
03 / The Solution
ifactory Energy & ESG Reporting: AI-Driven CIP Cycle Intelligence Across All Production Lines
Following a competitive evaluation of four industrial IoT and ESG analytics platforms, the plant's operations and sustainability leadership selected ifactory for its food-industry-validated CIP monitoring architecture, real-time conductivity and flow data integration, and demonstrated capability to deliver automated rinse verification without modification to existing CIP skid infrastructure. The platform was deployed to instrument all four CIP skid systems feeding all 11 production lines — with a unified analytics interface providing cycle-level resource consumption data, chemical dosing accuracy scores, and ESG-grade water consumption reporting. For food manufacturing facilities assessing similar deployments, book a demo to see how ifactory structures CIP optimization programs.
MONITOR
Real-time CIP cycle instrumentation across all four CIP skid systems — inline conductivity sensors, flow meters, temperature probes, and turbidity measurement units installed at wash, rinse, and sanitize circuit points. All sensor telemetry streamed to ifactory's platform at 10-second intervals throughout every active CIP cycle.
OPTIMIZE
AI-driven cycle duration optimization analyzed incoming conductivity and turbidity readings against cleanliness thresholds validated against the plant's food safety protocols — dynamically determining rinse completion rather than relying on fixed time windows, eliminating over-rinsing as a structural source of water waste.
DOSE
Automated chemical dosing recommendations generated per cycle based on actual soil load data derived from pre-CIP residue measurement — replacing manual calculation with data-driven dosing targets that reduced both under-dosing compliance risk and over-dosing chemical waste simultaneously.
REPORT
ESG-grade water and chemical consumption reporting delivered line-level, shift-level, and product SKU-level resource consumption data with audit-ready documentation — enabling the sustainability team to submit verified water reduction metrics to regulatory bodies and retail customer ESG reporting frameworks for the first time.
04 / Implementation
Full CIP Monitoring Network Active Across All 11 Production Lines in 47 Days
Days 1–10
CIP Circuit Audit and Sensor Specification
All four CIP skid systems and 11 production line circuits audited to map measurement point requirements. Sensor types specified per circuit position — conductivity at return headers, flow meters at supply manifolds, turbidity at final rinse outlets, and temperature probes at heating coil outputs. Network topology designed to support full data continuity during active production without interference with CIP control logic.
Days 11–28
Phased Sensor Installation — Highest-Volume Lines First
Sensors installed in production-schedule sequence, prioritizing the three highest-volume lines producing ketchup and hot sauce — the product categories with the most variable soil loads and highest historical CIP water demand. All installations completed during scheduled CIP maintenance windows with zero production interruption. First live cycle telemetry confirmed on Day 13 from Line 2's CIP return header.
Days 29–42
Platform AI Baseline Training and Chemical Dosing Model Calibration
ifactory's AI engine trained on 14 months of historical CIP log data alongside incoming live telemetry — establishing product-specific cleanliness baselines for all 23 active SKUs across the facility. Chemical dosing models calibrated per product category in coordination with the quality assurance team to ensure all automated dosing recommendations remained within validated food safety parameters before any changes were made to live cycle management.
Days 43–47
Full Network Validation, ESG Dashboard Activation, and First Optimized Cycle
Complete sensor network validated across all 11 lines. ESG water and chemical consumption dashboards activated for sustainability and operations leadership. First AI-optimized CIP cycle executed on Line 6 on Day 44 — reducing rinse duration by 31% against the previous fixed-schedule baseline while achieving verified conductivity clearance 7 minutes earlier than the prior manual sign-off average. No food safety parameters were compromised in any optimized cycle during the validation window.
05 / Results
12 Months of Measured Water, Chemical, and Cost Reduction
The shift from fixed-schedule CIP management to AI-driven cycle optimization produced verified improvements across every tracked performance dimension within the first 60 days of full platform operation. Water consumption fell sharply as automated rinse verification eliminated structural over-rinsing across all product categories. Chemical dosing accuracy improved as data-driven recommendations replaced manual calculation. And for the first time, the plant's sustainability leadership had the cycle-level resource data required to produce auditable ESG reports aligned with retail customer and regulatory reporting requirements.
| Metric |
Before ifactory |
After ifactory |
Change |
| Total monthly CIP water consumption |
9.2M liters |
5.98M liters |
−35% water reduction |
| Annual CIP chemical expenditure |
~$410,000 |
~$291,000 |
−29% chemical savings |
| Chemical dosing accuracy variance |
±38% |
±6% |
−84% dosing variance |
| Average CIP rinse duration per cycle |
22.4 minutes |
14.8 minutes |
−34% cycle time |
| Cycles with automated rinse verification |
0% |
100% |
Full cycle coverage |
| Wastewater discharge volume (CIP) |
8.7M liters/month |
5.64M liters/month |
−35% discharge reduction |
| CIP-related energy consumption |
Baseline index 100 |
Index 71 |
−29% energy reduction |
| ESG water data audit readiness |
Not available |
Full line-level audit trail |
Regulatory-grade reporting |
| Annual CIP operating cost |
~$2.21M |
~$1.57M |
−$640K annual savings |
| Sensor deployment timeline |
N/A |
47 days |
Fully live in 47 days |
"Within three months of full deployment, we had the data to prove to our retail partners that our ESG commitments were real, measurable, and independently verifiable. The water reduction is significant — but the shift to evidence-based CIP management is what changes how this plant operates long term."
06 / Key Analysis
Why the Water Reduction Was This Significant
01
Automated rinse verification eliminated the single largest source of water waste. The 35% reduction in water consumption was primarily driven by conductivity-confirmed rinse termination replacing fixed-duration rinsing. AI analysis of 47 days of baseline telemetry determined that 68% of all rinse phases were completing measurable cleanliness targets an average of 7.6 minutes before the fixed schedule terminated — water that was consumed with no hygiene benefit.
02
Data-driven chemical dosing compressed variance from ±38% to ±6%. Manual dosing calculation produced wide variance across shift teams and product changeovers. ifactory's AI-driven dosing recommendations — calibrated per SKU soil load profile — reduced this variance by 84%, simultaneously eliminating compliance risk from under-dosing and chemical waste from over-dosing across all 11 production lines.
03
CIP cycle time reduction of 34% increased available production uptime. Reducing average rinse duration from 22.4 to 14.8 minutes across 37.4 daily cycles recovered an estimated 283 minutes of production-available line time per day — without any reduction in cleaning efficacy as confirmed by the plant's quality assurance monitoring programme throughout the 12-month measurement period.
04
Line-level ESG data enabled retail customer reporting compliance for the first time. With cycle-level water and chemical consumption data attributed to each production line and product SKU, the sustainability team produced its first externally submittable water reduction report within 60 days of platform activation — satisfying ESG disclosure requirements from three major retail partners that had previously been deferred due to data unavailability.
07 / Business Impact
Operational, Financial, and Sustainability Outcomes Beyond Water Volume Reduction
Food Safety Compliance
Automated conductivity-verified rinse confirmation replaced operator visual sign-off as the primary CIP clearance mechanism — producing an unbroken digital audit trail for every cycle across all 11 lines. First external food safety audit under the new system resulted in zero non-conformances relating to CIP documentation.
ESG Reporting Readiness
ifactory's ESG reporting module delivered line-level, SKU-level, and shift-level water and chemical consumption data in formats directly compatible with GRI, CDP, and major retailer sustainability disclosure frameworks — enabling the plant to submit verified environmental performance data to external stakeholders for the first time.
Wastewater Cost Reduction
The 35% reduction in CIP water throughput produced a corresponding 35% reduction in wastewater discharge volume — delivering $87,000 in annual wastewater treatment and trade effluent charge savings that were not included in the primary CIP cost reduction headline, adding to the platform's total financial return.
Production Capacity Recovery
The 7.6-minute average reduction in per-cycle rinse duration, applied across 37.4 daily cycles, recovered approximately 283 minutes of daily production-ready line time — equivalent to an additional 1.2 production shifts per week without capital investment or staffing increases.
$2.21M
Annual CIP cost before
$1.57M
Annual CIP cost after
$640K
Annual savings achieved
08 / Conclusion
Condition Intelligence at Every CIP Cycle: The Compounding Value of AI-Driven Water Optimization
This sauce and condiment plant's 35% reduction in water consumption was achieved by replacing assumption-based CIP management with real-time sensor intelligence and AI-driven cycle optimization. ifactory's Energy & ESG Reporting platform gave the plant's operations and sustainability teams cycle-level visibility into water consumption, chemical dosing accuracy, and rinse completion status across all 11 production lines — and the AI optimization engine converted that visibility into verifiable resource savings without compromising food safety standards on any cycle throughout the 12-month measurement period.
The compounding value extends well beyond the first year's $640,000 in direct savings. Every CIP cycle adds to the soil load history that refines SKU-specific dosing recommendations. Every verified water reduction strengthens the ESG reporting position that retail partners and regulators increasingly require. And every minute of recovered production uptime represents capacity that would otherwise require capital investment to create. To assess what this deployment model would deliver for your food manufacturing facility, book a demo with ifactory's food industry engineering team.
35% Less Water. $640K in Annual Savings. Full CIP Visibility in 47 Days.
See how ifactory's AI-driven CIP optimization delivers verified water reduction, chemical savings, and ESG-grade reporting across your sauce and condiment production lines.
09 / FAQ
Frequently Asked Questions
How does AI-driven CIP optimization reduce water consumption in sauce and condiment plants?
AI-driven CIP optimization reduces water use by replacing fixed-duration rinse schedules with real-time conductivity and turbidity monitoring. Sensors measure cleanliness at the rinse return circuit continuously — the AI engine terminates the rinse phase the moment verified cleanliness thresholds are met, rather than running to a preset time. This plant's 35% water reduction resulted directly from eliminating over-rinsing that averaged 7.6 minutes of excess per cycle across 37.4 daily cycles.
Does automated CIP cycle management compromise food safety or hygiene compliance?
No. ifactory's AI optimization recommendations are calibrated against the facility's own validated food safety protocols and regulatory cleanliness thresholds before any changes are made to live cycle management. Rinse termination occurs only after conductivity measurements confirm compliance with validated standards — providing a stronger assurance basis than manual operator sign-off, and generating an unbroken digital audit trail for every cycle.
How long does CIP sensor deployment take across a sauce and condiment manufacturing facility?
Deployment timelines depend on CIP skid count, circuit complexity, and production scheduling. This facility achieved full sensor coverage across four CIP skid systems feeding 11 production lines within 47 days — with all installations completed during scheduled CIP maintenance windows with zero production interruption. ifactory's phased deployment model prioritizes highest-volume lines first so water savings begin accruing before full network completion.
Can ifactory's platform support ESG water reporting for retail customer sustainability frameworks?
Yes. ifactory's Energy & ESG Reporting module delivers line-level, SKU-level, and facility-level water and chemical consumption data in formats compatible with GRI, CDP, and major retailer sustainability disclosure requirements. This plant submitted its first externally verified water reduction report to three retail partners within 60 days of platform activation — using data that had not been available under the previous manual CIP management model.
What is the typical ROI timeline for CIP water optimization in food manufacturing?
Facilities with high water consumption and unoptimized CIP cycles typically recover platform investment costs within the first two quarters of full operation. This plant achieved payback within approximately 11 weeks of full deployment through combined water procurement, chemical, and wastewater treatment savings. Annual savings of $640,000 represent a sustained return from a one-time sensor infrastructure deployment.
How does ifactory handle CIP optimization across multiple product SKUs with different soil loads?
ifactory's AI engine builds individual soil load profiles per product SKU based on historical CIP telemetry — enabling dosing and cycle duration recommendations to adapt automatically to product changeovers. High-residue products like tomato-based sauces receive higher dosing recommendations and longer validated wash phases; lower-residue products like clear dressings are optimized for minimal resource use. All profiles are calibrated against food safety validation data before deployment.
READY TO REDUCE YOUR CIP WATER CONSUMPTION?
See How Much Water Your CIP Cycles Are Wasting Right Now
ifactory's AI-driven CIP platform gives your operations and sustainability teams real-time cycle intelligence — across chemical dosing, rinse verification, and ESG-grade water reporting on every production line.