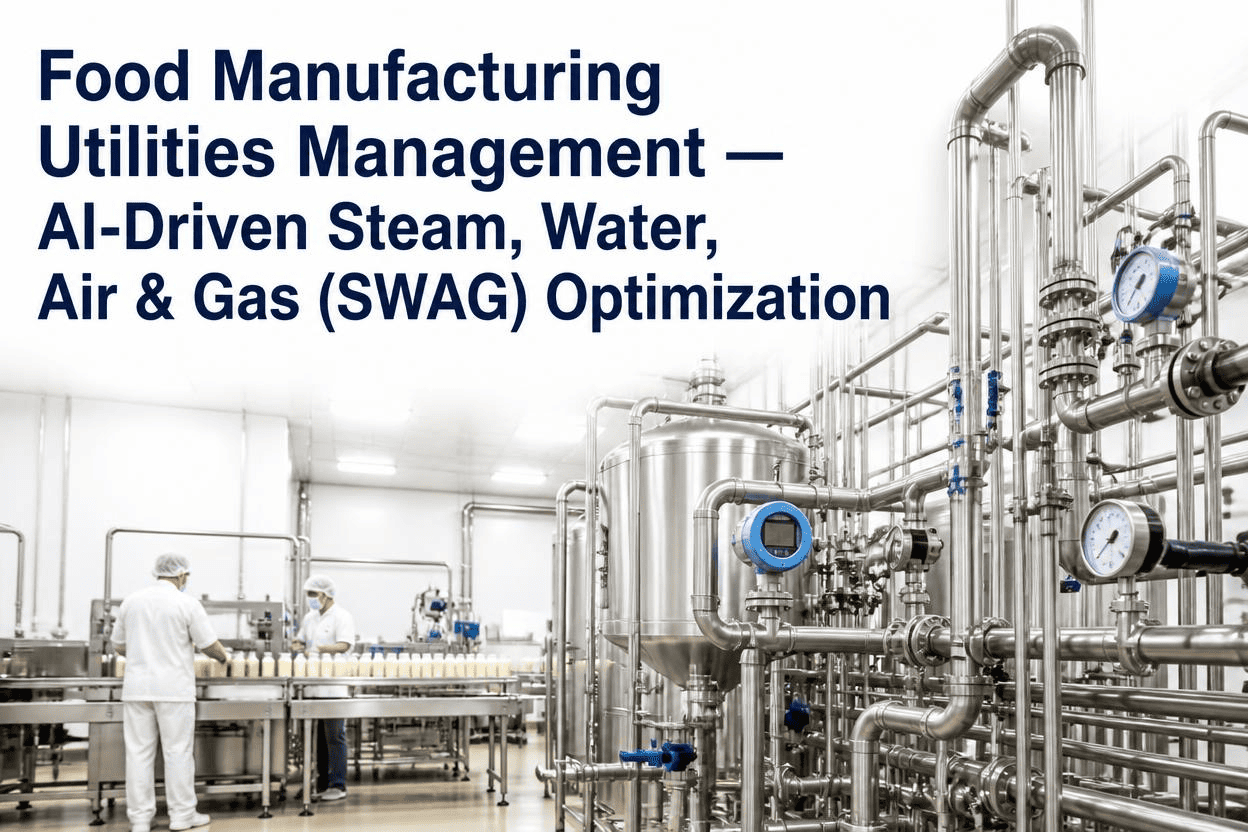
Steam, water, compressed air, and gas usually get budgeted, metered, and managed by four different people in four different systems, even though they all draw from the same boiler house or utility yard and often trade off against each other in ways nobody is tracking. A boiler running hotter than it needs to wastes gas to make steam nobody uses, and a compressed air leak silently draws water through cooling towers that then need more chemical treatment. Operations directors who start looking at utilities as one connected system instead of four separate line items tend to find savings the individual utility reports never showed, which is worth exploring in a demo using your own utility data.
Utility Costs Often Run 10 to 20 Percent of Food Plant Operating Cost, Split Across Systems Nobody Looks at Together
iFactory unifies steam, water, compressed air, and gas data into one AI-driven view, surfacing the cross-utility waste that separate meters and separate teams miss.
Steam, Water, Air, and Gas Each Have Their Own Waste Pattern
Every utility system tends to lose efficiency in a characteristic way, and most plants have a rough sense of their biggest offender without ever quantifying it against the other three.
Steam
Boiler efficiency losses and trap failures typically account for the largest share of recoverable utility cost in food plants running thermal processing.
Water
CIP cycles and cooling tower makeup water are the two largest consumption points, both sensitive to schedule and setpoint discipline.
Air
Compressed air leaks commonly waste 20 to 30 percent of generated volume in plants without a regular leak detection program.
Gas
Natural gas usage tracks closely with steam demand, making boiler efficiency the single biggest lever on gas cost in most facilities.
Four Signals iFactory Correlates Across Utility Systems
The waste that costs the most is rarely visible inside a single utility's own report. It shows up when steam, water, air, and gas data sit side by side against production volume.
Utility Cost Per Unit Produced
Normalizes steam, water, air, and gas consumption against actual output, so a cost spike is tied to a specific line or shift, not just a monthly total.
Boiler-to-Steam-Trap Correlation
Flags when rising gas consumption doesn't match steam demand, often pointing to a failed trap or boiler efficiency drop.
Compressed Air Leak Ranking
Ranks zones by estimated leak volume from pressure and flow data, prioritizing repair work by dollar impact.
Water-Energy Tradeoffs
Surfaces cases where a cooling or CIP schedule change would reduce total utility cost even if one individual utility's usage rises.
Four Utility Bills Rarely Tell the Same Story a Combined View Does
iFactory brings steam, water, air, and gas data into one dashboard so operations directors can see the tradeoffs, not just the totals.
Sample Utility Cost Allocation Across a Food Manufacturing Facility
Allocation varies significantly by process type, but this pattern is common across plants running thermal processing alongside packaging and sanitation.
| Utility | Typical Share of Utility Spend | Primary Driver | Main Waste Source |
|---|---|---|---|
| Steam / Gas | 40-50% | Thermal processing demand | Boiler inefficiency, failed traps |
| Compressed Air | 15-20% | Pneumatic equipment, packaging | Undetected leaks |
| Water | 20-25% | CIP cycles, cooling towers | Over-scheduled cleaning cycles |
| Electricity (Other) | Remainder | Motors, lighting, refrigeration | Off-shift equipment left running |
Results Reported by Plants After Unifying Utility Monitoring
These figures reflect changes reported by food manufacturing facilities after connecting previously siloed steam, water, air, and gas monitoring into one analytics layer.
Questions Operations Directors Ask About Unified Utility Monitoring
Stop Reviewing Four Utility Reports That Never Talk to Each Other
See how iFactory brings steam, water, air, and gas into one operational view built for the decisions operations directors actually make.