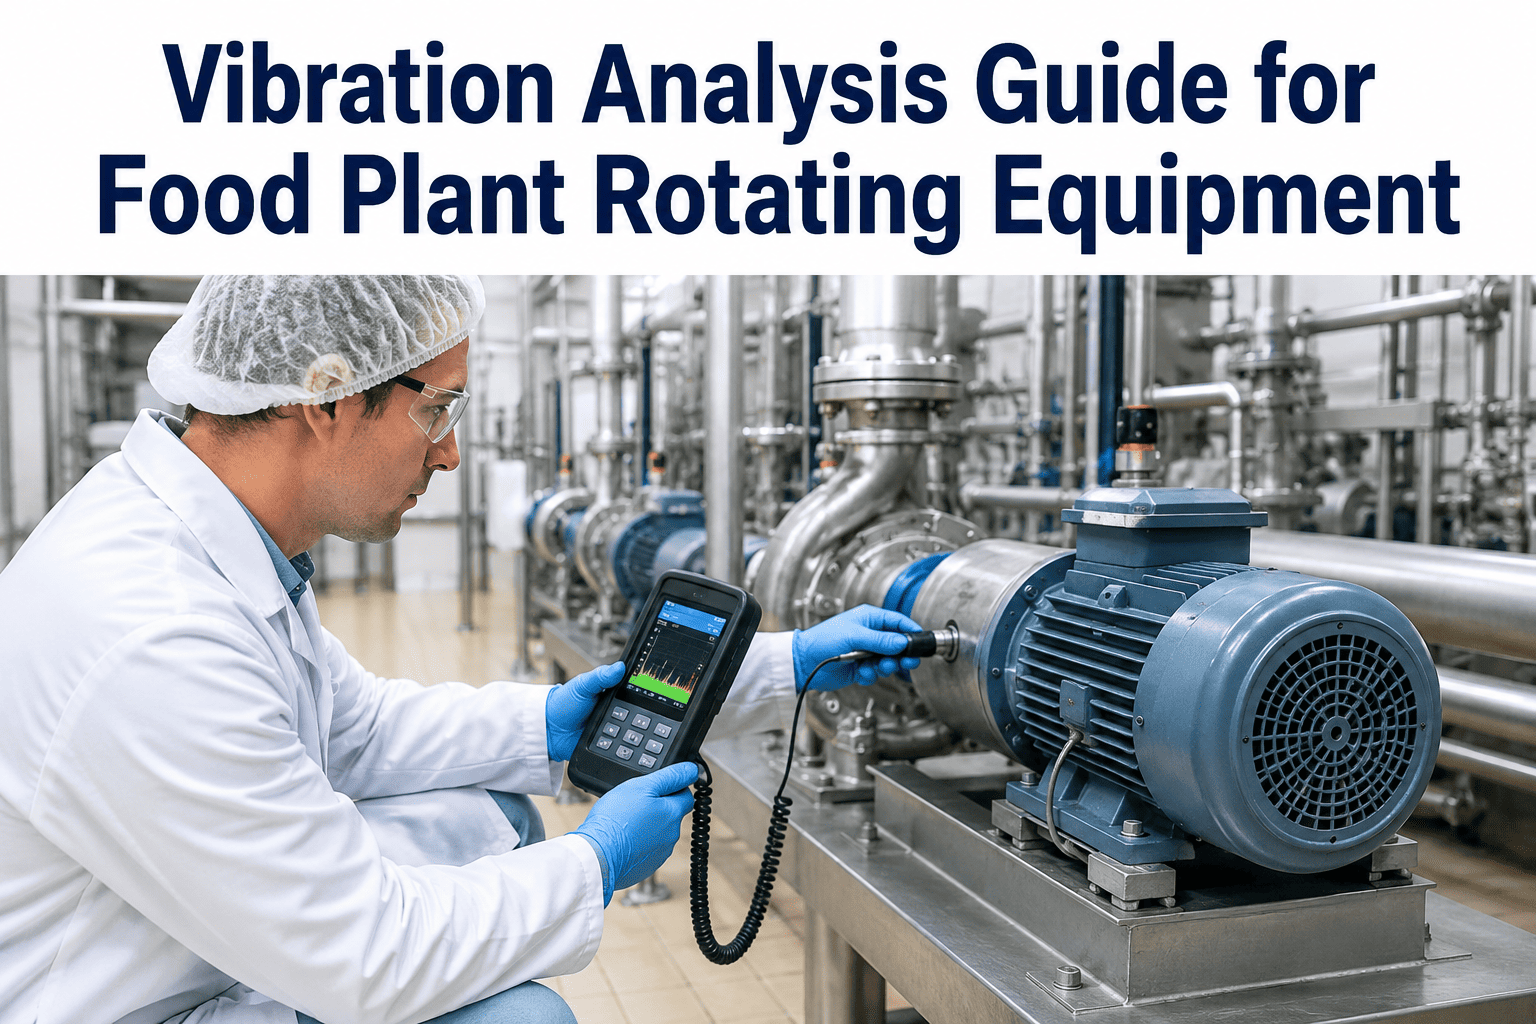
Every rotating machine on a food production line produces a vibration signature, and that signature changes in predictable, measurable ways long before a bearing seizes or a motor trips offline. Vibration analysis reads those changes through an accelerometer mounted on the equipment housing, converting raw motion into a frequency spectrum that reveals exactly which component is degrading and how fast. Most food plants already own the rotating equipment that benefits most from this technique — motors, pumps, mixers, and industrial fans — but many have never connected vibration data to a maintenance decision because the interpretation step feels like it requires a specialist the plant does not have on staff. That gap is smaller than it looks once the core fault signatures are understood. Teams ready to put a vibration program in place on their highest-priority rotating equipment can talk through sensor placement and alert thresholds with iFactory in a working session.
Every Bearing Failure Announces Itself in the Vibration Spectrum First.
iFactory turns accelerometer data from your motors, pumps, mixers, and fans into fault predictions your maintenance team can act on before a breakdown.
How an Accelerometer Turns Motion Into a Diagnosis
An accelerometer mounted on a bearing housing measures acceleration in one or more axes, producing a raw waveform that on its own looks like noise. The diagnostic value comes from converting that waveform into the frequency domain using a Fast Fourier Transform, which separates the signal into its component frequencies and reveals distinct peaks tied to specific mechanical events — one rotation of the shaft, the passage of each rolling element through a bearing defect, or the number of blades on a fan striking the air stream. Once the raw vibration is expressed as a spectrum, each fault type has a recognizable fingerprint, and tracking how that fingerprint changes over weeks and months is what allows a technician to say with confidence that a specific bearing is degrading rather than simply noting that "vibration is a bit higher than last month."
Time Waveform
The raw acceleration signal over time — useful for spotting impacting or looseness but hard to diagnose specific fault types directly.
FFT Spectrum
The waveform converted into frequency components, showing distinct peaks at frequencies tied to specific mechanical faults.
Trend Over Time
Overall vibration amplitude tracked across weeks and months, showing the rate of degradation rather than a single snapshot.
What Each Common Fault Looks Like in the Frequency Spectrum
The four fault categories below account for the large majority of mechanical problems detected through vibration analysis on food plant rotating equipment. Each one produces a distinct pattern in the FFT spectrum, and learning to recognize these four patterns covers most of the diagnostic work a maintenance technician will do with vibration data.
Bearing Defects
Produces sharp peaks at specific bearing defect frequencies calculated from the bearing geometry, appearing first as high-frequency energy that rises in amplitude as the defect worsens, eventually spreading into harmonics as the damage progresses from an early spall to a fully degraded race or roller.
Shaft Misalignment
Shows a dominant peak at two times running speed alongside the normal 1x peak, often with elevated axial vibration, and is one of the most common preventable faults since it typically results from an installation or coupling issue rather than gradual wear.
Rotor Imbalance
Dominated by a single strong peak at exactly one times running speed in the radial direction, with amplitude that scales directly with the severity of the imbalance and typically stays stable rather than progressing rapidly like a bearing fault.
Mechanical Looseness
Produces multiple harmonics of running speed with an irregular, often unstable pattern that can change from one reading to the next, commonly traced to loose mounting bolts, worn foundation, or excessive bearing clearance.
Catch the Spectrum Change Before the Bearing Fails.
iFactory streams vibration data from every monitored asset into one dashboard, flagging fault signatures automatically as they emerge.
How Vibration Signatures Differ Across Food Plant Equipment Types
The same fault types show up differently depending on the equipment they occur in, and knowing what is normal for a specific machine type prevents false alarms on equipment that is simply designed to run with more inherent vibration than a precision motor.
| Equipment Type | Common Fault | Watch For |
|---|---|---|
| Motors | Bearing wear, rotor bar defects | Rising high-frequency energy, sideband peaks around running speed |
| Centrifugal Pumps | Cavitation, impeller imbalance | Broadband high-frequency noise, elevated vane-pass frequency |
| Mixers | Gearbox wear, shaft misalignment | Gear mesh frequency sidebands, 2x running speed peak |
| Industrial Fans | Blade imbalance, bearing wear | Strong 1x peak, blade-pass frequency amplitude changes |
Building a Vibration Monitoring Program Without a Dedicated Analyst
Plants without a resident vibration analyst can still run an effective program by leaning on automated fault classification and focusing human review time on the alerts the software flags rather than reviewing every spectrum manually. The sequence below is what most food plants follow when introducing vibration monitoring for the first time.
Mount Sensors on Priority Assets
Install accelerometers on the bearing housings of the highest-criticality motors, pumps, mixers, and fans identified in your asset priority list.
Capture a Healthy Baseline
Record several weeks of vibration data while equipment is confirmed healthy, establishing the normal spectrum against which future readings are compared.
Set Alert Thresholds
Configure amplitude and frequency-band thresholds tied to the baseline, so the system flags a genuine deviation rather than normal operating variation.
Route Alerts to a Response Workflow
Connect every alert to a defined owner and inspection task, so a flagged spectrum change results in an actual work order rather than sitting unreviewed.
The Cost Case for Vibration Monitoring on Food Plant Rotating Equipment
A bearing failure on an unmonitored motor rarely announces itself until it seizes, and by that point the failure often takes out more than just the bearing — a seized bearing can damage the shaft, the coupling, and in some cases the driven equipment itself, turning what should have been a routine bearing swap into a multi-day repair involving parts that were never stocked because nobody expected to need them. Vibration monitoring changes the economics of that repair by giving the maintenance team weeks of lead time to order the correct part, schedule the work during a planned sanitation window, and complete the swap before secondary damage occurs. For food plants specifically, the avoided cost extends beyond the repair itself: a bearing failure mid-run on a filler or mixer can contaminate the product with metal fragments, triggering a hold or scrap event that often costs more than the mechanical repair combined. Plants that have run vibration monitoring on their Tier 1 rotating equipment for a full year typically report that the avoided cost of just one or two prevented catastrophic failures covers the sensor investment for several assets, which is why vibration analysis is usually the first predictive maintenance technique food plants adopt before expanding into other sensing methods.
Why a Single Reading Matters Less Than the Trend Line
A single vibration reading tells a technician the condition of a machine at one moment, but the real diagnostic power comes from comparing that reading against weeks or months of history on the same asset. An amplitude that looks moderate in isolation can be alarming if it has doubled in the last three readings, while the same amplitude might be entirely normal if it has stayed flat for a year. This is why baseline capture matters so much in the early phase of a program — without a documented healthy baseline, every subsequent reading has nothing meaningful to compare against, and the team is left guessing whether a given spectrum represents genuine degradation or simply the normal operating signature of that specific machine. Trend-based alerting, where the system flags a rate of change rather than a fixed absolute threshold, tends to catch developing faults earlier and with fewer false alarms than a program that relies on a single static amplitude limit applied uniformly across every asset regardless of its individual baseline.
Choosing the Right Accelerometer for a Food Plant Environment
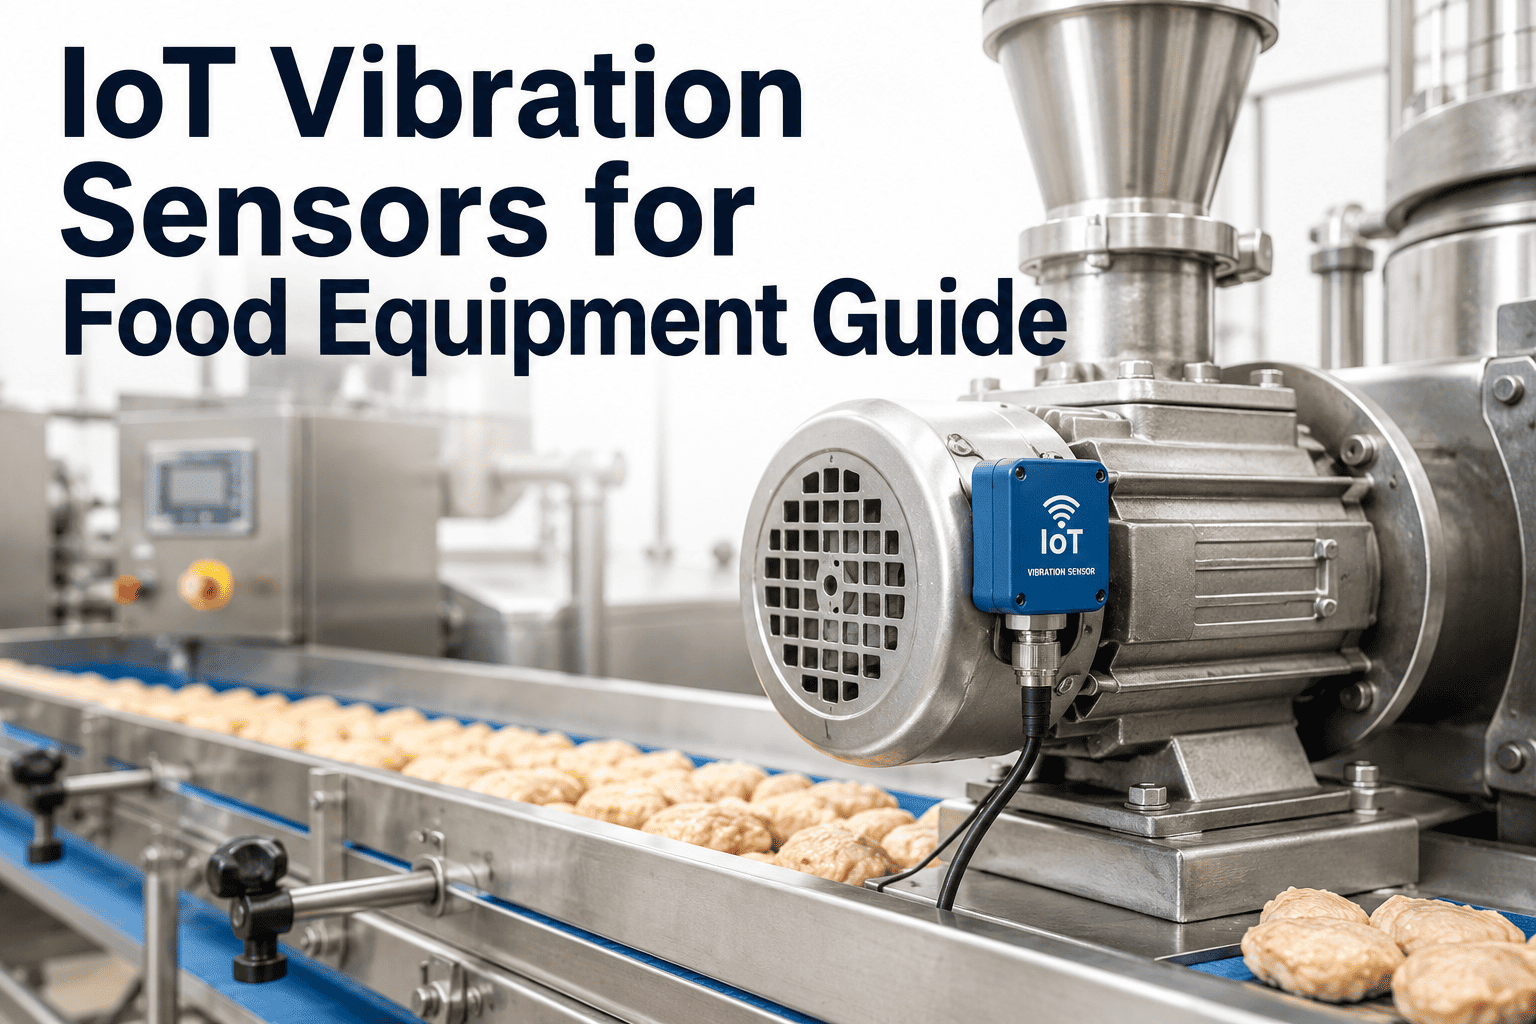
Not every accelerometer performs equally well once it leaves a controlled lab environment and gets mounted on a bearing housing in a wash-down zone. Sensor selection has to account for both the mechanical frequency range needed to catch the fault types relevant to a given piece of equipment and the environmental protection needed to survive daily exposure to water, temperature swings, and sanitizing chemicals. High-frequency piezoelectric accelerometers remain the standard choice for bearing fault detection on motors and pumps because bearing defect frequencies typically fall in a range these sensors capture cleanly, while slower-speed equipment such as large gearboxes and agitators sometimes benefits from a sensor with better low-frequency response even at some cost to high-frequency sensitivity. Mounting method matters just as much as the sensor itself — a magnetically mounted sensor is quick to install and reposition but can lose contact integrity under heavy wash-down pressure, while a stud-mounted sensor provides a more permanent and reliable connection at the cost of requiring a drilled and tapped mounting point on the equipment housing. Wireless battery-powered sensors have become the default choice for most new food plant vibration programs specifically because they eliminate cable runs that would otherwise need to be routed through or around wash-down zones, removing one of the most common points of failure in a permanently installed sensor network.
Turning a Spectrum Into a Maintenance Decision
Capturing a clean vibration spectrum is only half the work — the harder and more valuable skill is translating that spectrum into a specific maintenance action with an appropriate level of urgency. Most vibration monitoring platforms assign a severity rating automatically, typically expressed as a simple scale from acceptable through satisfactory, unsatisfactory, and unacceptable, based on internationally recognized vibration severity standards adjusted for the specific equipment class being monitored. A reading that falls in the unsatisfactory range does not necessarily mean immediate shutdown is required, but it does mean the asset should be scheduled for closer inspection and increased monitoring frequency to track whether the fault is progressing quickly or slowly. The most effective food plant programs pair this automated severity rating with a documented response protocol tied to each severity level — for example, an unsatisfactory reading triggers an inspection within the next scheduled sanitation window, while an unacceptable reading triggers an immediate work order regardless of the current production schedule. Without this kind of predefined response mapping, even a perfectly accurate vibration alert can sit unactioned simply because nobody has clearly established what should happen once a specific severity threshold is crossed, which undermines much of the value the monitoring program was built to deliver in the first place.
Justifying Sensor Investment With Real Failure Cost Data
Plant leadership evaluating a vibration monitoring investment usually wants to see the cost case laid out against a specific, recent failure rather than an abstract industry statistic, since a concrete example from the plant's own operating history carries far more weight in a budget conversation than a generic benchmark figure. The most persuasive business case pulls together the full cost of the last unplanned bearing failure on a Tier 1 asset — the direct repair cost, the labor hours spent diagnosing and fixing the problem under time pressure, the value of lost production during the downtime, and in food plants specifically, any product that had to be scrapped or held because of contamination risk from the failure itself. Comparing that total cost against the price of a sensor and a year of software subscription for that single asset almost always produces a payback period measured in months rather than years, and expanding the same comparison across a handful of similarly critical assets tends to make the case for a broader rollout self-evident. Plants that skip this exercise and instead try to justify the investment purely on a general OEE improvement argument often struggle more in the budget approval process, since OEE improvement is harder for finance teams to tie directly to a dollar figure than a specific avoided repair bill from a failure that everyone in the room still remembers.
Vibration Analysis for Food Plants — Common Questions
How much advance warning does vibration analysis typically give before a bearing fails?
Bearing defects typically progress through recognizable stages over weeks to months, giving well-monitored equipment anywhere from four to twelve weeks of advance warning between the first detectable spectrum change and an actual failure, though this range depends heavily on the operating speed and load of the specific machine. High-speed equipment tends to progress through fault stages faster than slow-speed equipment, which is one reason monitoring frequency should be higher on faster-running assets. The advance warning window is the entire value proposition of vibration monitoring, since it converts an unplanned emergency repair into a scheduled maintenance event that can be timed around production and sanitation windows. Plants wanting to understand realistic lead times for their specific equipment mix can book a session with iFactory to review benchmark data for similar assets.
Can vibration sensors survive daily wash-down in a food plant environment?
Yes, provided the sensors and mounting hardware are rated for the specific wash-down environment, which typically means an IP67 or higher ingress protection rating along with corrosion-resistant housing material suited to the sanitizer chemistry used on the line. Standard industrial-grade sensors not rated for washdown will fail prematurely when exposed to daily high-pressure cleaning, which is a common and avoidable mistake in first-time food plant deployments. Wireless battery-powered sensors have become the more common choice in wash-down areas specifically because they eliminate cable entry points that are otherwise a frequent source of moisture ingress and eventual sensor failure.
Is vibration analysis useful on slow-speed equipment like large mixers and agitators?
Yes, though slow-speed equipment requires more careful sensor selection and longer sampling times than high-speed motors, since the frequencies of interest are lower and standard accelerometers optimized for high-frequency bearing defects can lose sensitivity at very low shaft speeds. Specialized low-frequency accelerometers or velocity sensors are often better suited to slow mixers and agitators, and the sampling duration typically needs to be extended to capture enough shaft revolutions for a clean spectrum. Once configured correctly, vibration analysis remains one of the most reliable diagnostic tools even on slow-speed gearbox-driven equipment, where gear mesh frequencies and their sidebands provide a clear signature for developing gear wear.
What is the difference between a portable vibration reading and continuous monitoring?
A portable reading, taken by a technician walking a fixed route with a handheld collector, captures a snapshot of vibration condition at the moment of the reading, typically on a weekly or monthly interval. Continuous monitoring through permanently mounted wireless sensors captures data around the clock, which matters most for fast-developing faults or equipment where operating conditions change significantly across shifts, since a monthly snapshot can miss a fault that develops and worsens between route readings. Most food plants use a hybrid approach — continuous monitoring on Tier 1 critical assets where a missed fault would be costly, and periodic route-based readings on lower-priority equipment where the cost of continuous sensors is harder to justify. The iFactory Support team can help determine the right mix for a specific asset list.
Stop Discovering Bearing Failures When the Motor Trips Offline.
Talk to iFactory about mounting vibration sensors on your priority rotating equipment and turning fault signatures into scheduled work orders.