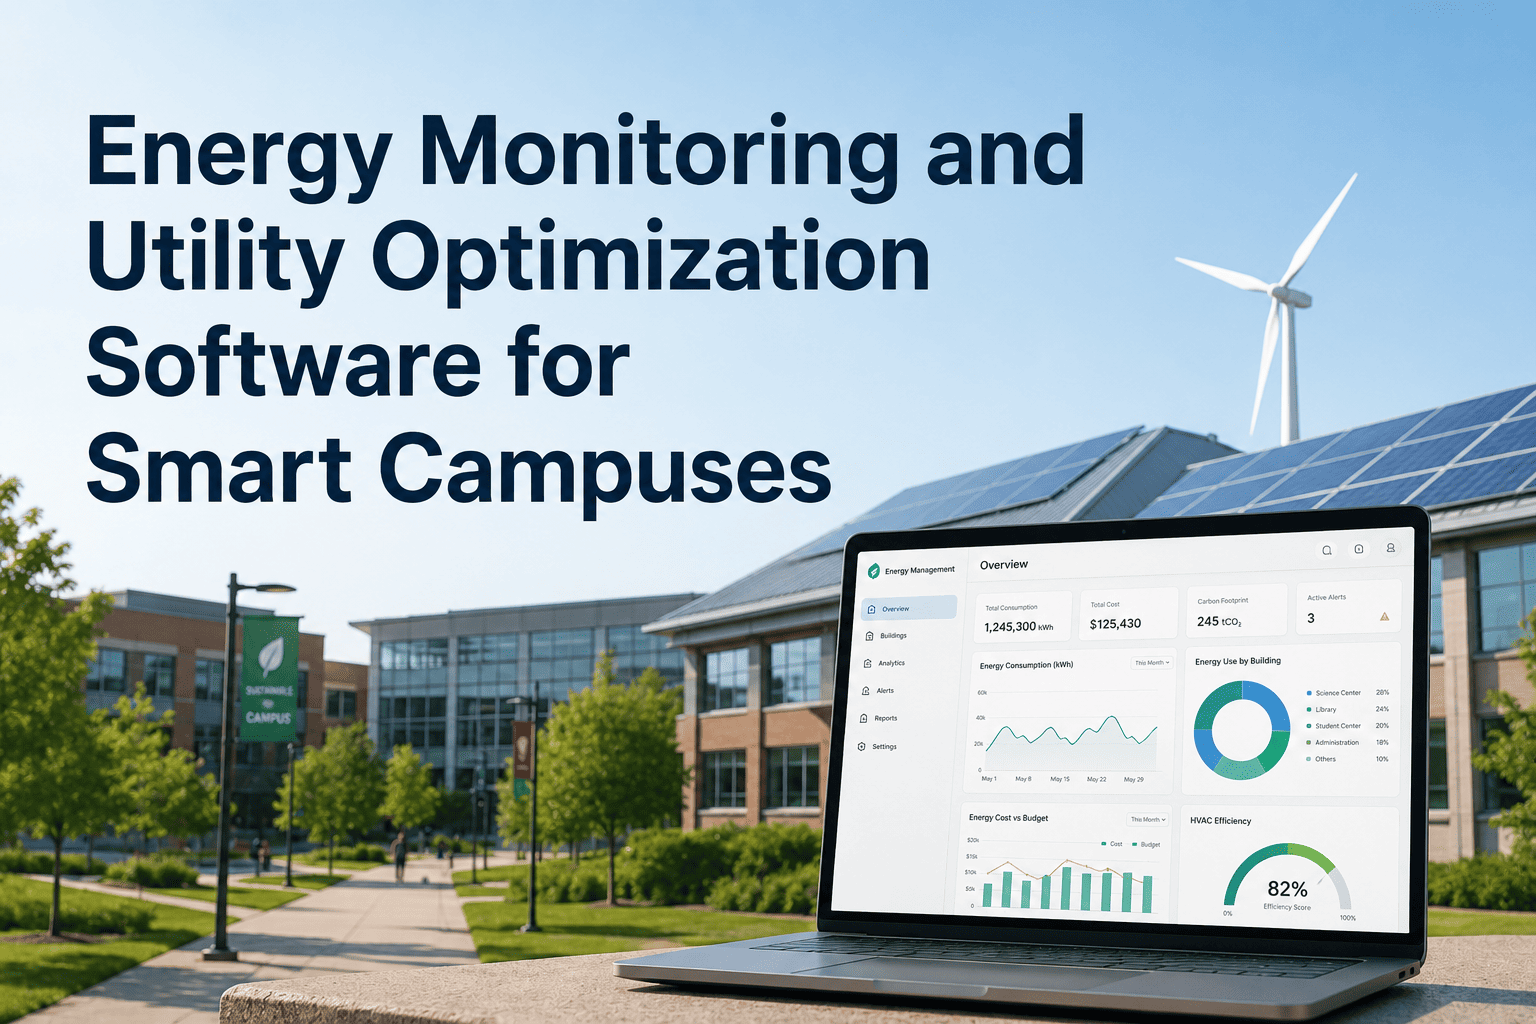
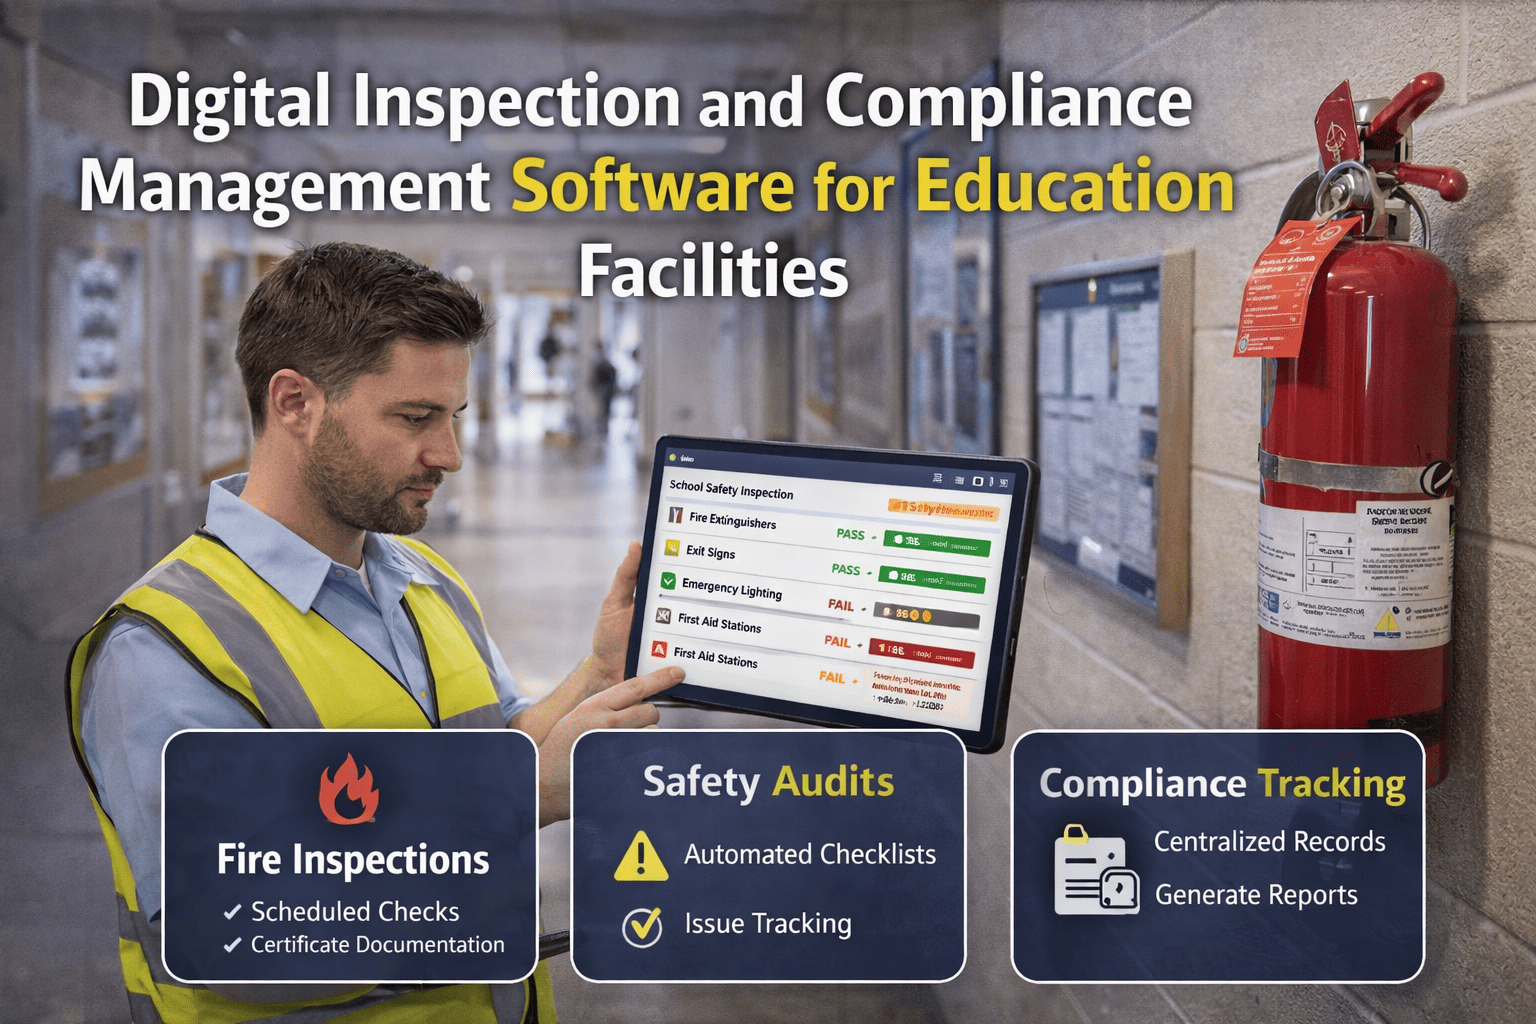
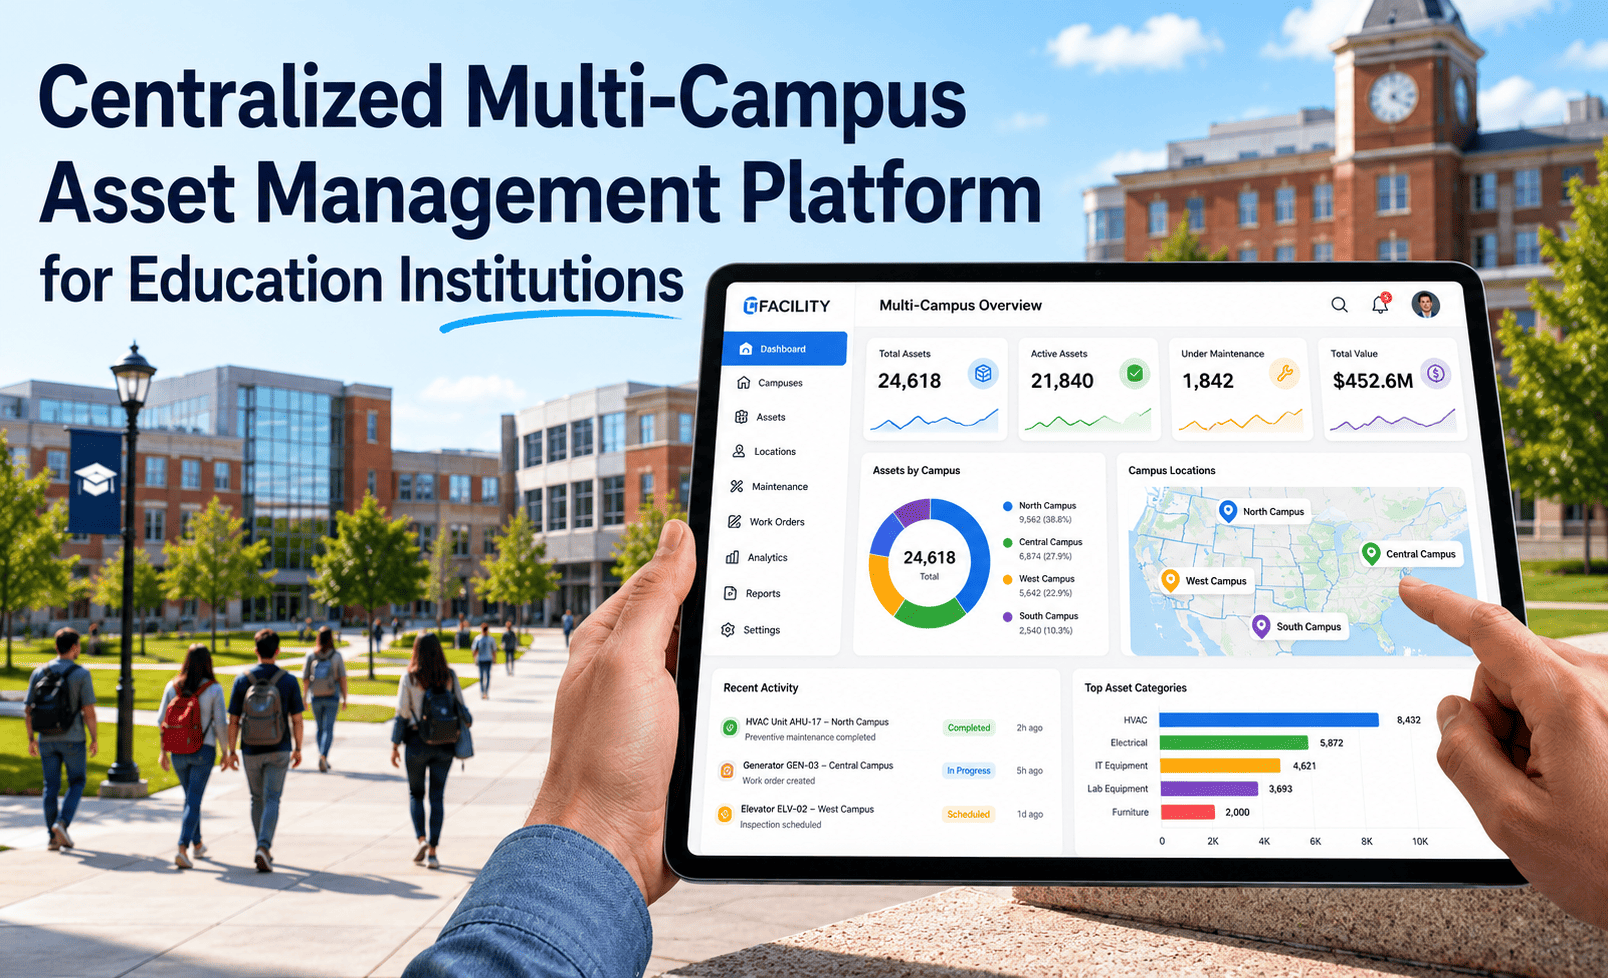
University sustainability mandates are no longer aspirational commitments on a webpage — in 2026 they carry regulatory deadlines, accreditation consequences, and credit agency scrutiny. EPA ENERGY STAR reporting, state carbon reduction targets, LEED recertification cycles, and STARS ratings now require the kind of continuous, auditable data that manual collection systems structurally cannot produce. The facilities leaders closing the compliance gap fastest are not adding staff to track spreadsheets — they are automating the data layer. See exactly which sustainability mandates your campus can automate today — Book a Demo.
With new sustainability mandates taking effect globally, universities must automate energy tracking, asset optimization, carbon reporting, and compliance documentation — or face findings, funding risk, and accreditation exposure.
Why 2026 Is the Year Sustainability Automation Became Non-Negotiable
Four structural shifts have converged in 2026 to make manual sustainability tracking untenable for universities of any size. State carbon reduction legislation now ties performance data to capital funding eligibility at many institutions. Accreditation bodies have increased the documentation granularity required in sustainability sections. Credit agencies explicitly incorporate ESG data quality into institutional bond assessments. And the SEC climate disclosure framework, now in phased rollout, requires higher education institutions receiving federal funding to align with structured carbon reporting standards.
None of these requirements can be satisfied by spreadsheet collection, periodic manual surveys, or annual consultant-assembled reports. They require continuous monitoring, timestamped records, and on-demand audit export — capabilities that only an automated platform can deliver at the data quality these frameworks now specify. See how the platform maps to your institution's specific compliance calendar — Book a Demo.
The Six Sustainability Mandates Facilities Leaders Must Address in 2026
Each mandate below has a distinct documentation requirement that manual systems routinely fail to satisfy. Understanding what each framework specifically demands is the starting point for building a defensible automation strategy.
EPA ENERGY STAR certification and benchmarking for universities requires whole-campus and per-building energy use intensity data submitted through Portfolio Manager. Manual meter reading produces data quality failures that disqualify submissions. Automated continuous metering connected to Portfolio Manager API satisfies the data currency and completeness requirements without staff data entry.
Over 30 US states and all UK higher education institutions now operate under carbon reduction frameworks with mandatory reporting cycles and documented reduction trajectories. Non-compliance links directly to capital funding eligibility at many institutions. Automated Scope 1 and Scope 2 carbon calculations from live utility and combustion data replace manual calculation worksheets that auditors consistently flag for methodology inconsistency.
LEED O+M recertification requires documented performance data across energy, water, waste, and indoor environmental quality categories over a minimum performance period. Manual data collection across these categories produces the gaps that cause recertification failures. Continuous monitoring with automated performance period documentation enables recertification submission without a data assembly project at each cycle.
STARS ratings require institutions to document performance across operations, academics, planning, and administration. The operations category — covering energy, water, grounds, purchasing, and waste — requires quantitative data with documented baselines and trajectories. Automated monitoring provides the per-category data streams that manual STARS submissions substitute with estimated figures, which reduce scores and trigger reviewer challenges.
Regional accreditation bodies have expanded sustainability documentation requirements in 2025 and 2026 cycles. HLC, SACSCOC, WASC, and MSCHE now require institutions to demonstrate institutional sustainability planning with measurable outcomes and documented progress. Data-backed sustainability dashboards generated from continuous monitoring satisfy these requirements; narrative-only submissions are increasingly challenged during evaluation visits.
Moody's, S&P, and Fitch now incorporate ESG factors including sustainability governance and environmental data quality into higher education bond ratings. Institutions that can demonstrate continuous monitoring, documented reduction trajectories, and audit-ready sustainability records are assessed more favorably than those presenting annual snapshot reports. The documentation format and data currency matter as much as the underlying performance numbers.
What Campus Sustainability Automation Actually Requires
Sustainability automation is not a single tool — it is an integrated data layer that connects existing campus infrastructure to the reporting frameworks that mandate continuous, auditable performance evidence. The platform capabilities below map directly to what each framework requires rather than what vendors generically describe.
Energy use intensity calculated per building continuously from connected meters and BMS feeds — not campus aggregate totals. Per-building data identifies the 20-30% of buildings consuming disproportionate energy due to equipment fault or occupancy mismatch, enabling targeted intervention rather than campus-wide averages that mask the real cost drivers. EPA Portfolio Manager integration and ENERGY STAR submission handled automatically without staff data preparation.
Carbon calculations derived continuously from live utility consumption, combustion equipment data, and regional grid emission factors. Scope 1 direct emissions from campus boilers, generators, and fleet are tracked from connected equipment. Scope 2 market-based and location-based calculations updated automatically as grid factors change. State carbon reporting submissions generated from live data without manual calculation worksheets that introduce methodology inconsistency between reporting cycles.
Space utilization data from occupancy sensors integrated with HVAC and lighting scheduling to eliminate conditioning of unoccupied spaces — the single highest-impact energy reduction action available to most campuses. The quick win documented across deployments is unoccupied space conditioning reduced in the first semester as occupancy-driven scheduling activates. Full 15-19% energy cost reduction range reached at month 18 as the AI model accumulates building-specific usage patterns and tightens scheduling precision.
Water consumption monitored per building from connected meters with anomaly detection identifying leaks, irrigation overuse, and cooling tower inefficiency automatically. LEED O+M water use reduction credits require documented baseline and performance period data — continuous monitoring provides both without manual meter read scheduling. Utility consumption trends surfaced in the sustainability dashboard alongside energy and carbon data for unified reporting across all STARS and LEED categories.
Board sustainability dashboards, STARS submissions, LEED performance period reports, state carbon disclosures, and accreditation sustainability sections generated automatically from live monitoring data. Reports produced in the format each framework requires without manual data assembly. Audit packages exported on demand with complete data lineage, timestamps, and methodology documentation that satisfies reviewer scrutiny at accreditation visits and credit agency assessments.
Energy performance data from continuous monitoring feeds directly into facility condition scoring and capital prioritization. Retrofit ROI modelling combines energy savings projections with deferred maintenance cost avoidance to build the financial case for building envelope, mechanical, and lighting investments. Capital requests for sustainability projects backed by live performance data rather than consultant estimates achieve higher board approval rates and shorter approval cycles than projects presented without current evidence.
Documented Outcomes at Deployed Campuses
From university deployments on existing operational budgets. No additional sustainability staffing added in any documented case. Get a projected sustainability ROI modelled against your campus energy spend — Book a Demo.
Documented range across campus deployments at 18 months. Begins with unoccupied space conditioning in first semester; full range reached as AI model matures on building-specific data.
140 manual staff hours per quarterly sustainability cycle reduced to 18 hours through automated report generation from live monitoring data.
Automated documentation from continuous data eliminates the data gaps and methodology inconsistencies that produce findings in manual sustainability audits.
Documentation maturity score improvement from 41 to 79 out of 100 in first full audit cycle — the largest single-cycle gain recorded in state benchmarking reports.
How the Platform Integrates with Existing Campus Infrastructure
The platform does not require replacing existing building management systems, meters, or energy infrastructure. Open API integration connects to existing BMS, smart meters, IoT sensors, and utility data feeds — the sensor gap assessment in the first two weeks identifies any coverage gaps. Most campuses achieve significant sustainability intelligence from existing infrastructure alone without new hardware investment.
Johnson Controls, Siemens Desigo, Honeywell, Schneider EcoStruxure, and Trane connected via open API without replacement or data migration.
Smart meters, interval data, and utility API feeds connected for automatic energy use intensity calculation per building without manual meter reading schedules.
Occupancy sensors, CO2 monitors, and temperature arrays connected where installed. Gap assessment identifies additional coverage needs; most campuses require minimal new hardware.
Utility billing data from SAP, Oracle, and Banner integrated for cost-per-building calculations and sustainability capital investment ROI modelling against live performance.
EPA Portfolio Manager API sync, STARS data export, and LEED Arc platform integration for direct submission without manual data re-entry into reporting portals.
Core integration live in 60 to 90 days. Initial energy baselines established in first two weeks from existing data. No operational disruption during integration phase.
Frequently Asked Questions
Continuous energy monitoring, automated carbon reporting, LEED and STARS documentation — all from existing campus infrastructure. Core integration live in 60 to 90 days.