Municipal parks departments manage an average of 47 facilities per 10,000 residents across playgrounds, athletic fields, aquatic centers, community buildings, and trail systems with maintenance budgets that average $83 per resident annually. iFactory's AI-powered facility analytics platform consolidates work orders, predictive maintenance schedules, safety compliance documentation, and asset lifecycle tracking across your entire parks portfolio into a single platform that municipal teams in the US, UAE, UK, Canada, and Europe use to reduce liability exposure by 67%, extend asset lifespan by 40%, and cut reactive maintenance costs by 52%. Book a demo to see iFactory analytics configured for parks and recreation operations.
iFactory applies IoT sensors, mobile inspection workflows, and machine learning analytics to parks infrastructure including playground equipment, turf irrigation systems, pool mechanical equipment, HVAC in community centers, and trail surface conditions. The platform automatically generates preventive maintenance schedules, flags safety compliance violations before inspections, and calculates asset replacement timing based on condition trends and budget cycles. Average municipal results: 67% reduction in liability claims, 40% asset lifespan extension, 52% lower reactive maintenance spend, full ROI within 18 months.
How iFactory Analytics Works Across Parks and Recreation Facilities
The pipeline below shows the five-stage process iFactory applies across every parks asset from playgrounds and athletic fields to pools and community centers, converting raw condition data into scheduled maintenance actions and compliance documentation.
iFactory consolidates playground inspections, athletic field monitoring, pool equipment analytics, and community center maintenance into one platform with automated compliance documentation and liability defense records built into every workflow.
Critical Parks and Recreation Asset Categories iFactory Monitors
Every card below represents a specific facility type where iFactory deploys condition monitoring, safety compliance tracking, and predictive maintenance analytics for municipal parks departments.
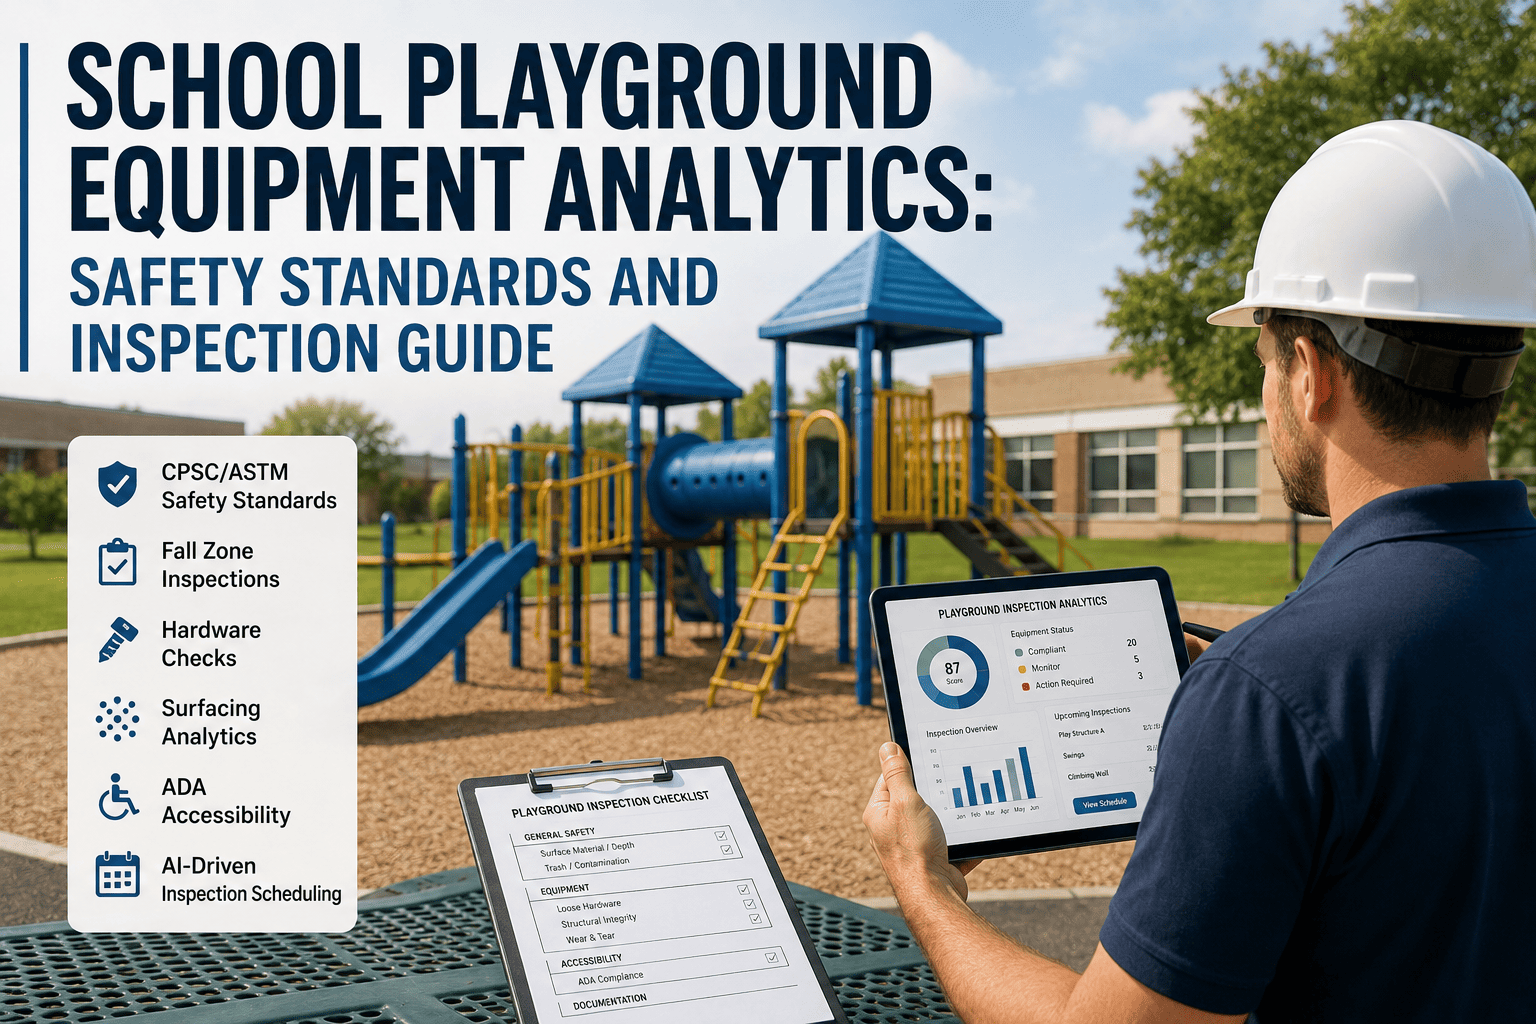
Liability Protection: Playgrounds generate 75% of parks department liability claims. Timestamped inspection records with photo evidence are the primary legal defense proving the municipality maintained reasonable care standards.
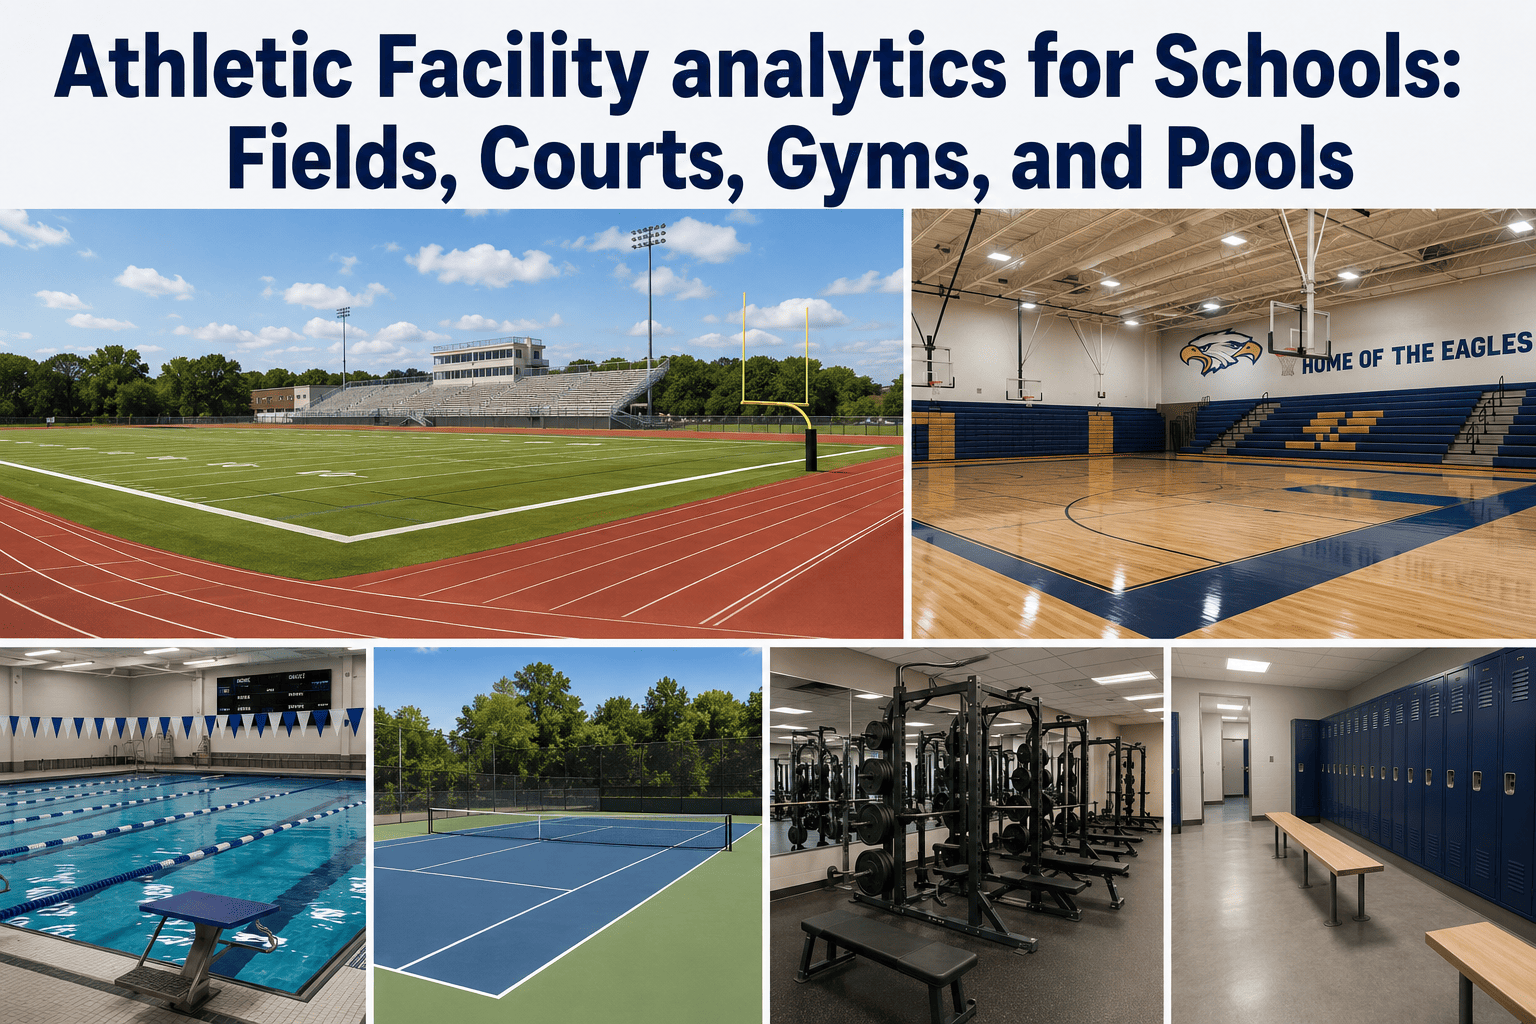
Cost Optimization: Athletic field renovations cost $180,000 to $850,000 per field. Extending turf lifespan by 2 to 3 years through optimized irrigation and maintenance timing delivers 6-figure savings per field across a typical municipal portfolio.
Compliance Mandate: Pool health code violations result in immediate closure orders and fines up to $25,000 per violation. Continuous chemical monitoring with documented compliance logs is required in all major municipal jurisdictions.
Energy Savings: Community centers average 85,000 square feet with annual utility costs of $2.40 per square foot. HVAC optimization and building envelope improvements reduce energy consumption by 18% to 28%, delivering $36,000 to $57,000 annual savings per facility.
ADA Mandate: Trail surface defects exceeding 0.5 inch height differential violate ADA accessibility standards and generate liability exposure. Regular documented inspections with prompt remediation are required to maintain safe harbor protection under federal accessibility law.
Safety and Security: Park lighting failures increase crime incidents by 42% in affected areas and generate liability claims when assaults occur in darkened park sections. Predictive lighting maintenance ensures continuous illumination without relying on citizen complaints to identify outages.
Platform Capability Comparison: Parks and Recreation Asset Management
Enterprise CMMS platforms like IBM Maximo and SAP EAM offer general maintenance tracking but lack parks-specific workflows, CPSC playground compliance templates, and GIS asset mapping integration that municipal operations require. iFactory differentiates on mobile inspection workflows, playground safety compliance automation, and predictive analytics for turf and pool systems. Book a comparison demo.
| Capability | iFactory | Brightly Asset Essentials | Cityworks | Lucity | IBM Maximo |
|---|---|---|---|---|---|
| Parks-Specific Workflows | |||||
| CPSC playground inspection templates with photo documentation | Pre-configured compliance checklists | Generic inspection forms | Custom config required | Basic templates available | Not available |
| Athletic field turf analytics with irrigation optimization | IoT soil moisture integration | Not available | Not available | Not available | Not available |
| Pool chemical monitoring with health code compliance alerts | Real-time chemical sensors | Manual entry only | Not available | Basic tracking | Not available |
| Mobile and GIS Integration | |||||
| Mobile inspection app with GPS asset mapping and offline capability | Full offline mobile app | Strong mobile capability | Esri-based GIS integration | CentralSquare GIS | Mobile with limitations |
| Automated work order generation from inspection findings | AI-generated with routing | Manual creation required | Rule-based triggers | Rule-based triggers | Notification only |
| Predictive Analytics and AI | |||||
| Asset condition trending with replacement timing forecasts | Budget-cycle aligned forecasts | Basic trending available | Not available | Condition assessment module | APM add-on required |
| AI safety risk scoring for playground and facility hazards | CPSC injury data trained | Not available | Not available | Not available | Not available |
| Energy optimization analytics for community center HVAC | Utility cost tracking integrated | Energy module available | Not available | Not available | Separate energy module |
| Deployment and Pricing | |||||
| Time to full deployment across municipal parks portfolio | 4 to 8 weeks turnkey | 8 to 16 weeks | 16 to 24 weeks heavy config | 12 to 20 weeks | 6 to 18 months enterprise |
| Pricing model for municipal budgets | Per-asset transparent pricing | SaaS subscription model | Custom enterprise pricing | Module-based pricing | Enterprise license only |
Based on publicly available product documentation as of Q1 2026. Verify current capabilities with each vendor before procurement decisions.
Regional Compliance: How iFactory Meets Parks and Recreation Regulations
Parks departments operate under federal, state, and local safety regulations that impose specific documentation requirements on playground equipment, aquatic facilities, athletic fields, and public buildings. iFactory generates compliance records automatically as a byproduct of daily maintenance workflows.
| Region | Primary Compliance Requirements | iFactory Coverage | Documentation Output |
|---|---|---|---|
| United States | CPSC Playground Safety Handbook, ADA Title II accessibility for trails and facilities, MAHC Model Aquatic Health Code for pools, ASTM F1487 playground equipment standards, EPA stormwater regulations for athletic fields | CPSC-compliant inspection checklists, ADA accessibility audit trails, MAHC chemical monitoring logs, ASTM surfacing depth documentation, EPA stormwater permit records, timestamped photo evidence for all inspections | Audit-ready export packages formatted for CPSC investigations, ADA compliance reports, health department pool inspections, liability defense documentation |
| United Arab Emirates | UAE Municipality park safety standards, Dubai Parks and Recreation Authority guidelines, pool facility health regulations, fire safety for community buildings, environmental compliance for irrigation systems | UAE Municipality inspection templates, Dubai Parks Authority compliance logs, pool health code documentation with Arabic-language interfaces, fire safety system maintenance records, water conservation reporting for irrigation analytics | Municipality submission-ready compliance packages, Civil Defence fire safety records, environmental impact reports for water usage |
| United Kingdom | Health and Safety Executive (HSE) playground standards, BS EN 1176 equipment safety, PUWER regulations for park machinery, swimming pool treatment advisory group guidelines, DDA accessibility requirements | HSE-aligned inspection protocols, BS EN 1176 compliance verification, PUWER equipment maintenance logs, pool chemical treatment documentation per PWTAG standards, DDA accessibility audit trails with photo evidence | HSE audit-ready reports, annual playground safety compliance certificates, pool operator log exports, accessibility compliance documentation |
| Canada | CSA Z614 playground safety standards, provincial accessibility legislation, pool operator certification requirements, municipal bylaw compliance for park facilities, environmental regulations for pesticide use on athletic fields | CSA Z614 inspection checklists, provincial accessibility compliance tracking, pool operator daily logs with certification verification, municipal bylaw documentation, pesticide application records meeting environmental standards, bilingual English/French interfaces | Provincial inspection submission packages, pool health permit renewals, accessibility compliance reports, environmental impact documentation |
| European Union | EN 1176 playground equipment standards, EN 15288 swimming pool equipment, EU accessibility directive implementation, GDPR for maintenance data, national park safety regulations per member state, ISO 55001 asset management | EN 1176 and EN 15288 compliance documentation, EU accessibility audit trails, GDPR-compliant EU data residency, member state regulatory template customization, ISO 55001 asset registry and lifecycle tracking, multilingual support for all EU languages | EU regulatory submission packages, member state inspection compliance reports, ISO 55001 asset management certification support documentation |
iFactory maintains ISO 27001 certification for information security management and provides region-specific compliance template libraries updated quarterly to reflect regulatory changes.
Implementation Roadmap: iFactory Deployment Across Parks Portfolio
Municipal parks departments typically complete iFactory deployment across 40 to 100 facilities within 4 to 8 weeks. The phased approach prioritizes high-liability playgrounds and aquatic centers first, proving ROI before expanding to athletic fields and trails.
iFactory team conducts portfolio assessment identifying all playgrounds, athletic fields, pools, community centers, and trail systems. Each asset receives GPS coordinates, photos, and condition rating. High-liability assets like playgrounds and pools are prioritized for immediate monitoring based on CPSC injury statistics and pool violation history.
CPSC playground checklists, pool chemical monitoring protocols, athletic field condition assessments, and building inspection forms are loaded into mobile app. Field staff complete hands-on training with actual facility inspections. First 30 days of inspection data establishes baseline condition trending for predictive analytics.
IoT sensors installed on pool chemical systems, irrigation controllers, community center HVAC, and athletic field soil moisture monitoring points. AI models begin training on inspection history to predict playground surfacing replacement timing, pool equipment failures, and turf renovation needs. Energy analytics activated for community centers to identify HVAC optimization opportunities.
System operates at full scale across entire parks portfolio with daily mobile inspections, automated work order generation, predictive maintenance alerts, and real-time compliance monitoring. Quarterly performance reviews track liability claim reduction, asset lifespan extension, maintenance cost savings, and compliance audit results. Expansion to additional facility types based on demonstrated ROI.
iFactory customers deploy playground safety monitoring, pool compliance tracking, and athletic field analytics across 40 to 100 facilities within 8 weeks. The first prevented playground injury claim justifies the entire platform investment for a typical municipal portfolio.
Measured Outcomes Across Municipal Parks Deployments
Real Results: Municipal Parks Department Case Study
Frequently Asked Questions
Continue Reading: Municipal Infrastructure Analytics
iFactory consolidates playground safety compliance, athletic field monitoring, pool equipment analytics, and community center maintenance into one platform with automated liability defense documentation, predictive asset replacement forecasting, and energy optimization analytics. Municipal parks departments in the US, UAE, UK, Canada, and Europe use iFactory to reduce liability claims by 67%, extend asset lifespan by 40%, and achieve full ROI within 18 months.