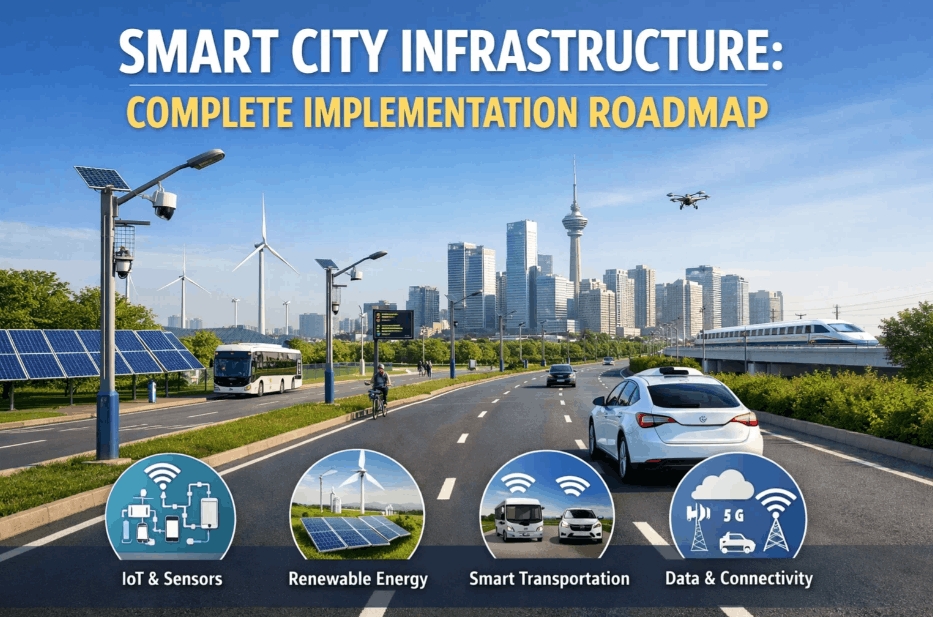
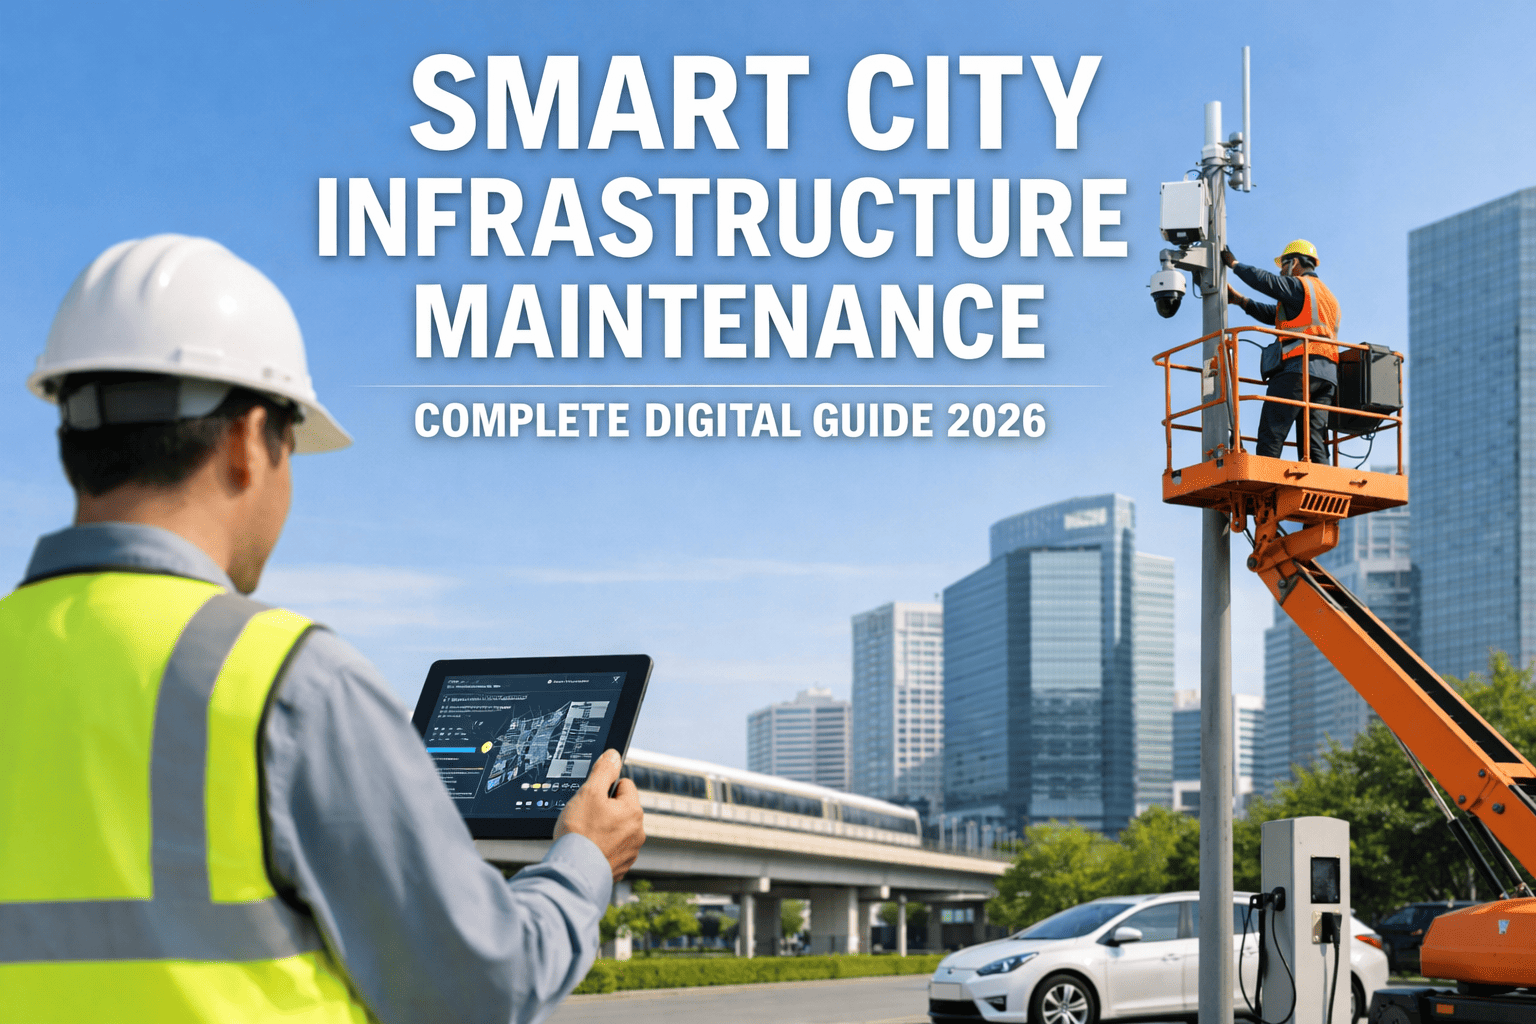
Smart city IoT infrastructure is reshaping how municipalities manage roads, utilities, air quality, and public safety. By connecting thousands of sensors to a centralised analytics platform, city operators gain real-time visibility into every layer of urban infrastructure — from traffic flow and energy consumption to water pressure and environmental conditions. This guide breaks down exactly how smart city IoT integration works, what results forward-thinking municipalities are achieving, and how platforms like iFactory are making it deployable in weeks, not years. Book a free smart city assessment to see what your infrastructure data is currently missing.
iFactory's pre-deployment assessment maps your existing IoT infrastructure, identifies data gaps, and calculates measurable improvement values — before you commit to anything.
Smart city IoT integrates environmental sensors, traffic monitors, utility meters, and infrastructure sensors into a unified analytics platform. AI detects anomalies, triggers automated alerts, and gives operators a real-time operational picture across all municipal services — reducing response times by up to 40% and cutting operational costs significantly.
What Is Smart City IoT Infrastructure?
Smart city IoT infrastructure refers to the network of connected sensors, edge devices, communication gateways, and analytics software deployed across a city's physical assets. These sensors collect continuous data from streetlights, bridges, water mains, air quality monitors, waste bins, traffic signals, and dozens of other urban systems.
The raw data alone is not enough. What makes a smart city truly intelligent is the analytics layer — software that turns sensor readings into actionable insights, detects anomalies before they become failures, and helps operators prioritise where to send resources. Platforms like iFactory connect directly to your existing SCADA, PLCs, and IoT gateways through standard protocols like OPC-UA, MQTT, and Modbus, integrating all sensor streams into a single operational dashboard without replacing any existing systems. Book a demo to see how it maps to your current infrastructure.
Key Components of a Municipal IoT Sensor Network
A well-designed municipal sensor network covers five critical infrastructure domains. Each generates different data types and requires different monitoring logic, but they all feed into a single analytics platform for unified visibility.
Air quality sensors measure PM2.5, NOx, CO2, and ozone levels across the city. Noise monitors track decibel levels in residential zones. Weather stations feed hyperlocal conditions into traffic and utility models.
Inductive loop detectors, LiDAR units, and camera-based counters track vehicle flow, pedestrian density, and parking occupancy. Data feeds adaptive signal control systems in real time.
Smart meters, pressure transducers, and flow monitors on water and gas mains detect leaks, pressure drops, and consumption anomalies before they become service disruptions.
Vibration sensors and tilt meters on bridges, underpasses, and retaining walls detect early signs of structural stress, giving engineers weeks of advance warning before a failure risk emerges.
Ultrasonic fill-level sensors in bins trigger collection routes only when needed. This cuts unnecessary truck movements by 30 to 40% in pilot deployments across European municipalities.
Smart streetlight controllers monitor energy draw, detect outages instantly, and dim lights based on real-time occupancy — reducing municipal energy spend without compromising public safety.
How Smart City Analytics Platforms Process IoT Data
Raw sensor data arrives as high-frequency time-series streams — thousands of readings per second across hundreds of devices. Without the right analytics architecture, this volume of data overwhelms operators and goes unused. A smart city AI platform processes this data at the edge, inside the facility, with zero cloud dependency required. Book a demo to understand how the edge architecture protects your data sovereignty.
Sensor streams from SCADA, PLCs, and IoT gateways are ingested via OPC-UA, MQTT, and Modbus directly onto on-premise NVIDIA edge servers — no cloud transmission required.
AI models establish a baseline for every sensor. When readings deviate — a water main pressure drop, an unusual vibration signature — the system flags it instantly, not hours later.
Operators receive targeted alerts with 48 to 72 hours of advance notice before equipment failure. No more watching dashboards — only actionable notifications reach the right teams.
Condition-based maintenance replaces calendar schedules. Vibration patterns, motor current draw, and pressure trends trigger work orders in your CMMS automatically — before failure occurs.
All sensor domains — utilities, traffic, environment, structures — feed a single dashboard. Every department sees their data in context, with no platform switching required.
EPA, EU, and regional regulatory reports are generated automatically from sensor data — timestamped, geo-tagged, and audit-ready, eliminating hundreds of manual staff hours per year.
Smart City IoT Integration: Technical Architecture
Successful municipal IoT integration depends on getting the data architecture right from the start. Most cities already have fragmented sensor networks — traffic systems from one vendor, utilities monitored by a SCADA platform, environmental sensors feeding a separate portal. The integration challenge is unifying these streams without a costly rip-and-replace project.
| Integration Layer | Protocol / Standard | Municipal Use Case | iFactory Support |
|---|---|---|---|
| SCADA Systems | OPC-UA, Modbus | Utilities, water, wastewater | Native read-only integration |
| IoT Gateways | MQTT, CoAP | Environmental, traffic sensors | Full MQTT broker support |
| GIS Platforms | REST API, GeoJSON | Asset mapping, field operations | Esri & open GIS compatible |
| CMMS | REST API | Work order generation | Bi-directional API sync |
| Smart Meters | AMI / DLMS | Energy & water consumption | AMI head-end integration |
| Traffic Management | NTCIP, REST API | Signal control, flow data | NTCIP & vendor API support |
Environmental Monitoring and Regulatory Compliance
Municipal governments face increasing regulatory pressure around air quality reporting, noise ordinance compliance, and environmental impact assessments. Smart city IoT analytics platforms automate the data collection and reporting workflows that previously consumed hundreds of staff hours per year.
iFactory integrates with environmental sensor networks to deliver automated compliance reports for EPA, EU Air Quality Directive, and regional standards. All data is timestamped, geo-tagged, and audit-ready. Book a demo to see how environmental compliance reporting is automated for your region.
Air Quality Monitoring Networks
Dense air quality sensor networks give city planners and health departments real-time pollution maps. Instead of relying on a handful of official monitoring stations, low-cost IoT sensors deployed at street level provide block-by-block resolution of PM2.5, NO2, and ozone concentrations.
This granularity enables targeted interventions — rerouting heavy vehicles away from high-exposure zones during peak hours, triggering public health alerts when thresholds are breached, and building accurate baseline datasets for long-term urban planning decisions. The analytics platform turns raw sensor readings into colour-coded risk maps updated every few minutes, viewable by any authorised city department.
Results Municipalities Are Achieving With Smart City IoT
Smart City IoT vs Traditional Municipal Operations
Traditional municipal infrastructure management relies on reactive maintenance, periodic manual inspections, and fragmented data stored in departmental silos. A water main bursts and the operations centre finds out from a resident complaint. A bridge shows stress signs that go undetected until a routine inspection months later. A streetlight outage sits on a backlog for days.
Smart city IoT infrastructure changes the operating model entirely. Problems are detected before they escalate. Resources are dispatched based on real data, not assumptions. And department heads get the performance dashboards they need to justify capital investment decisions with evidence rather than gut feel. If your city is still managing assets this way, book a free assessment to quantify what reactive operations are costing you annually.
Data Security and Sovereignty for Municipal IoT
Municipal governments handle sensitive operational data — infrastructure vulnerability information, citizen service patterns, utility consumption data, and more. Cloud-dependent IoT platforms create data residency and sovereignty risks that many city governments cannot accept.
iFactory is built on an on-premise architecture. All AI processing happens on NVIDIA edge servers inside your network. Zero operational data is transmitted to external cloud services. This architecture satisfies NIST SP 800-82, GDPR, UK GDPR, PIPEDA, and equivalent regional data governance frameworks. The result is enterprise-grade analytics without enterprise-grade data risk.
iFactory connects to your existing sensors, SCADA, and GIS in read-only mode. No rip-and-replace. No cloud dependency. Measurable results within 45 days.
Frequently Asked Questions
iFactory deploys in weeks, connects to your existing systems, and delivers measurable improvements in infrastructure reliability, compliance, and cost efficiency — with zero cloud dependency.