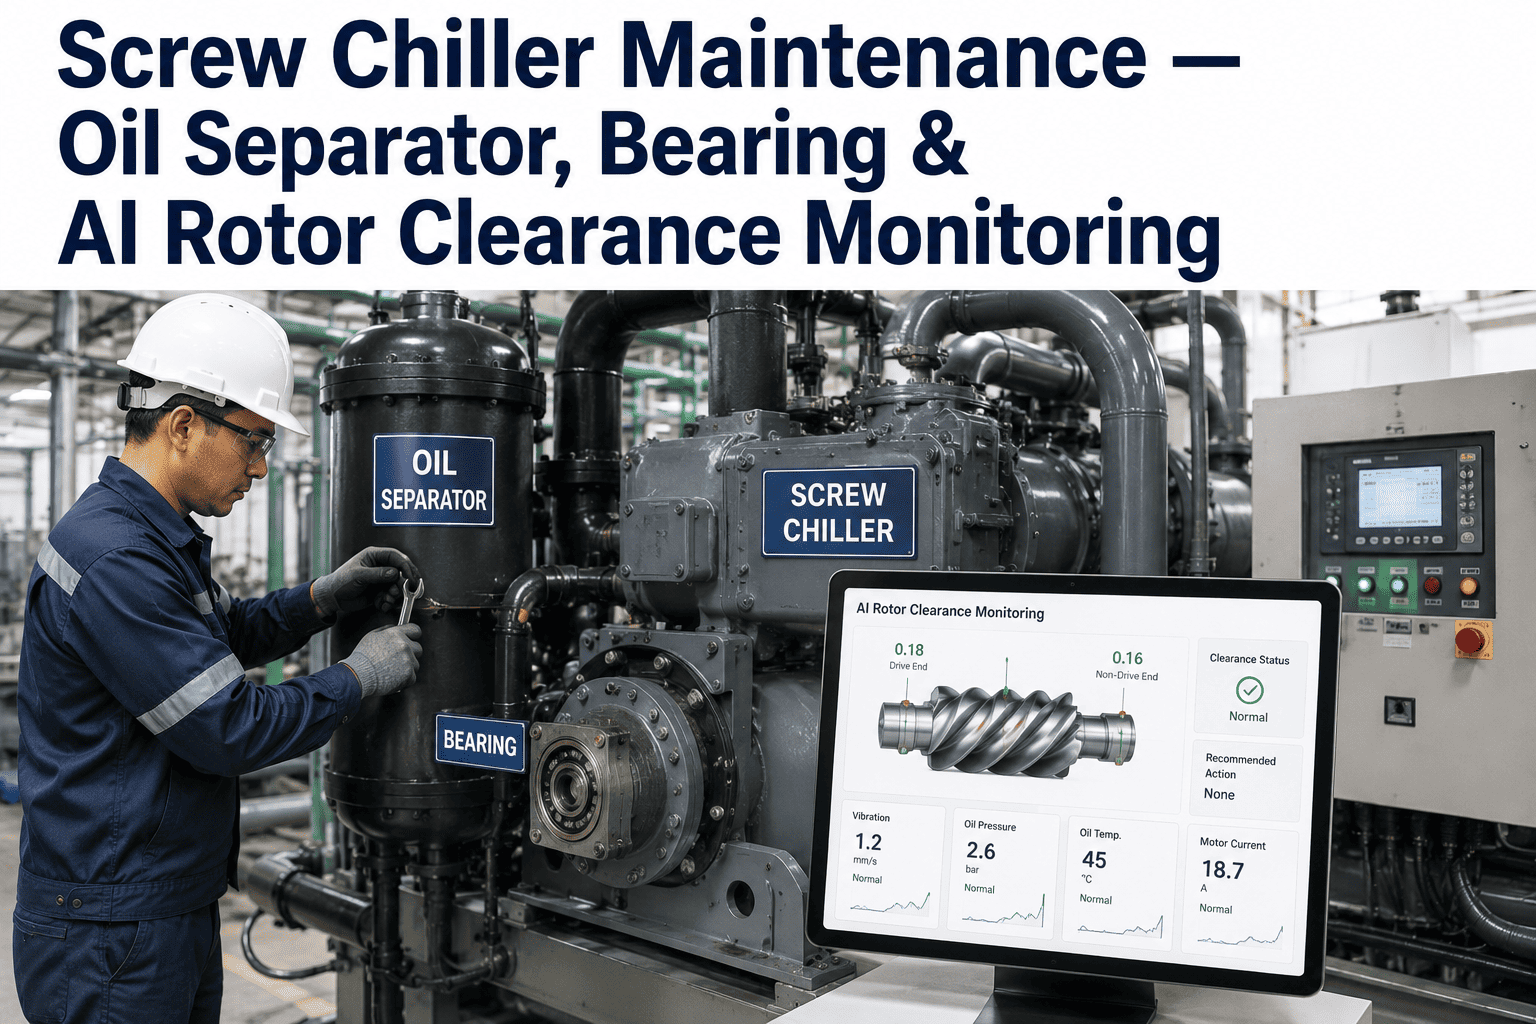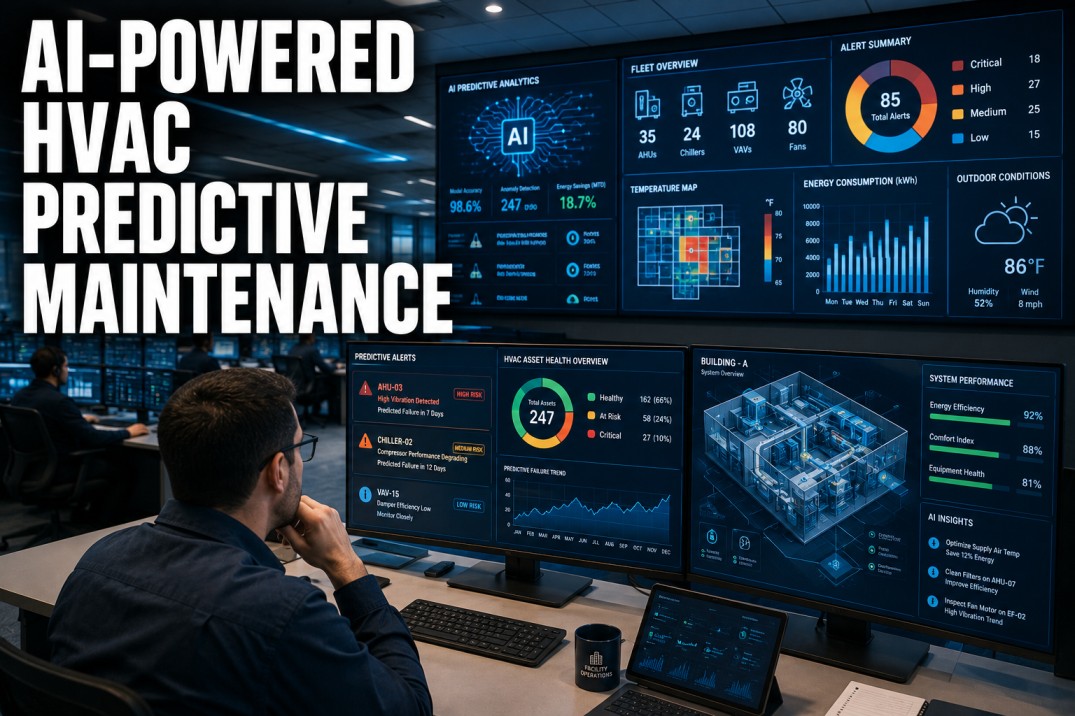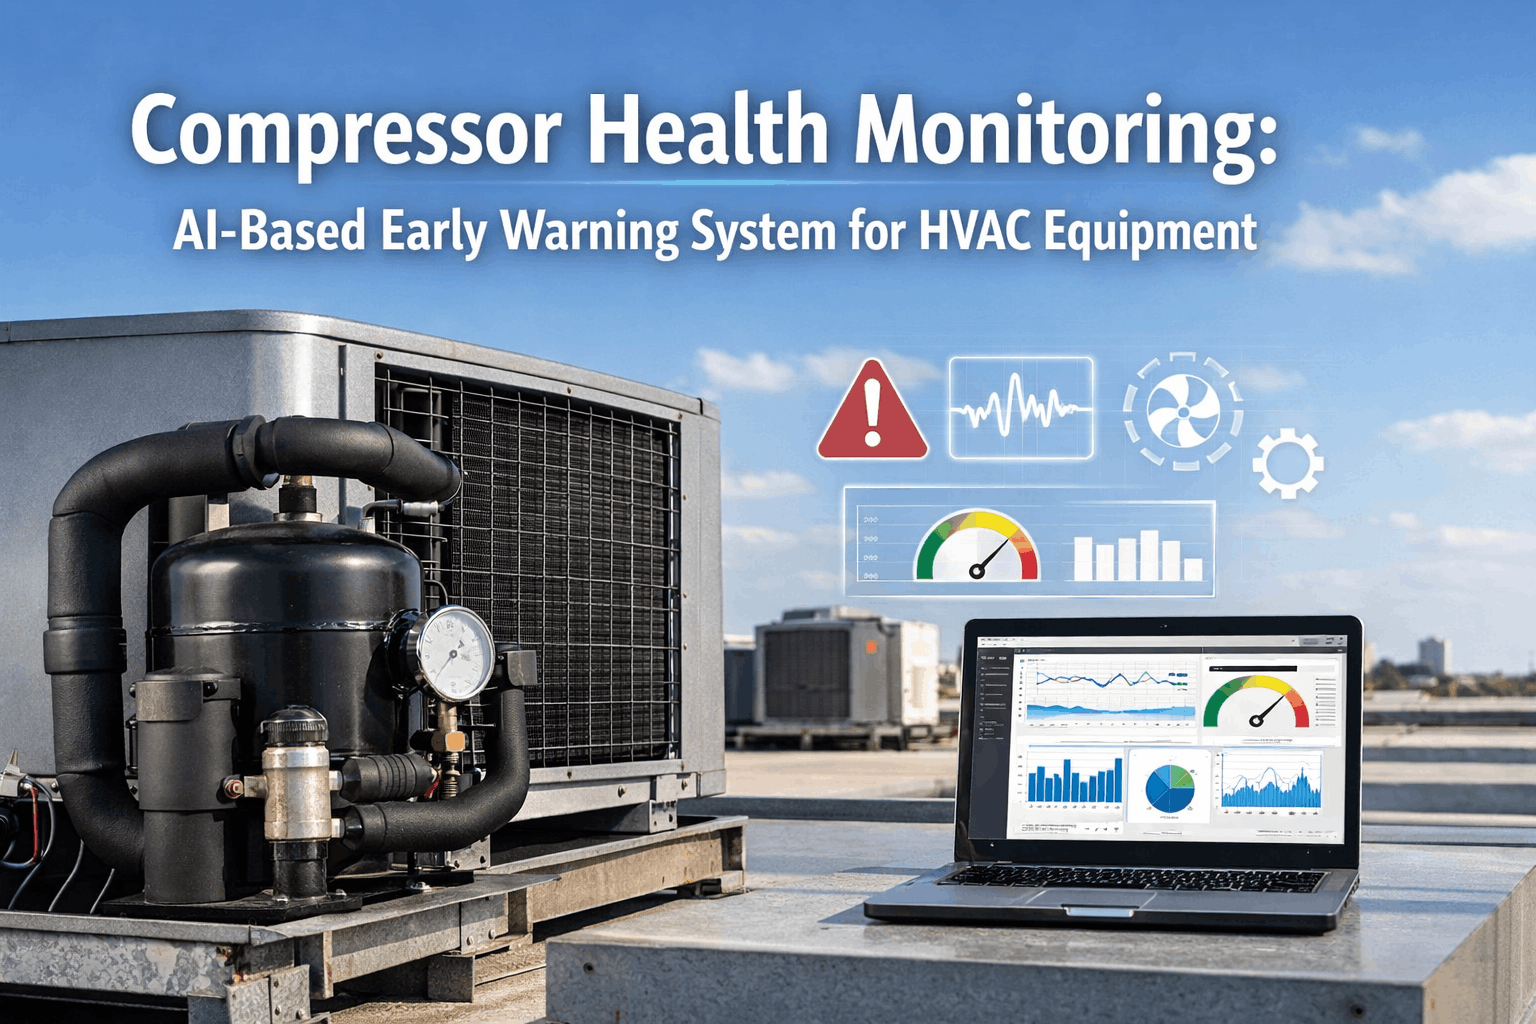
A commercial chiller is rarely just one more line item on a maintenance schedule. It is often the single largest piece of rotating equipment in a building, the asset that consumes the largest share of the utility bill, and the one system with no good backup plan if it goes down in July. Most facility teams still manage it the same way they manage a rooftop fan: a quarterly PM checklist, a logbook of readings nobody trends, and a hope that whatever is wrong will announce itself before it becomes an emergency. It usually does announce itself, just not in a way anyone can use in time. See how continuous chiller monitoring closes that gap at ifactory support.
Know a Compressor Is Failing Weeks Before It Trips
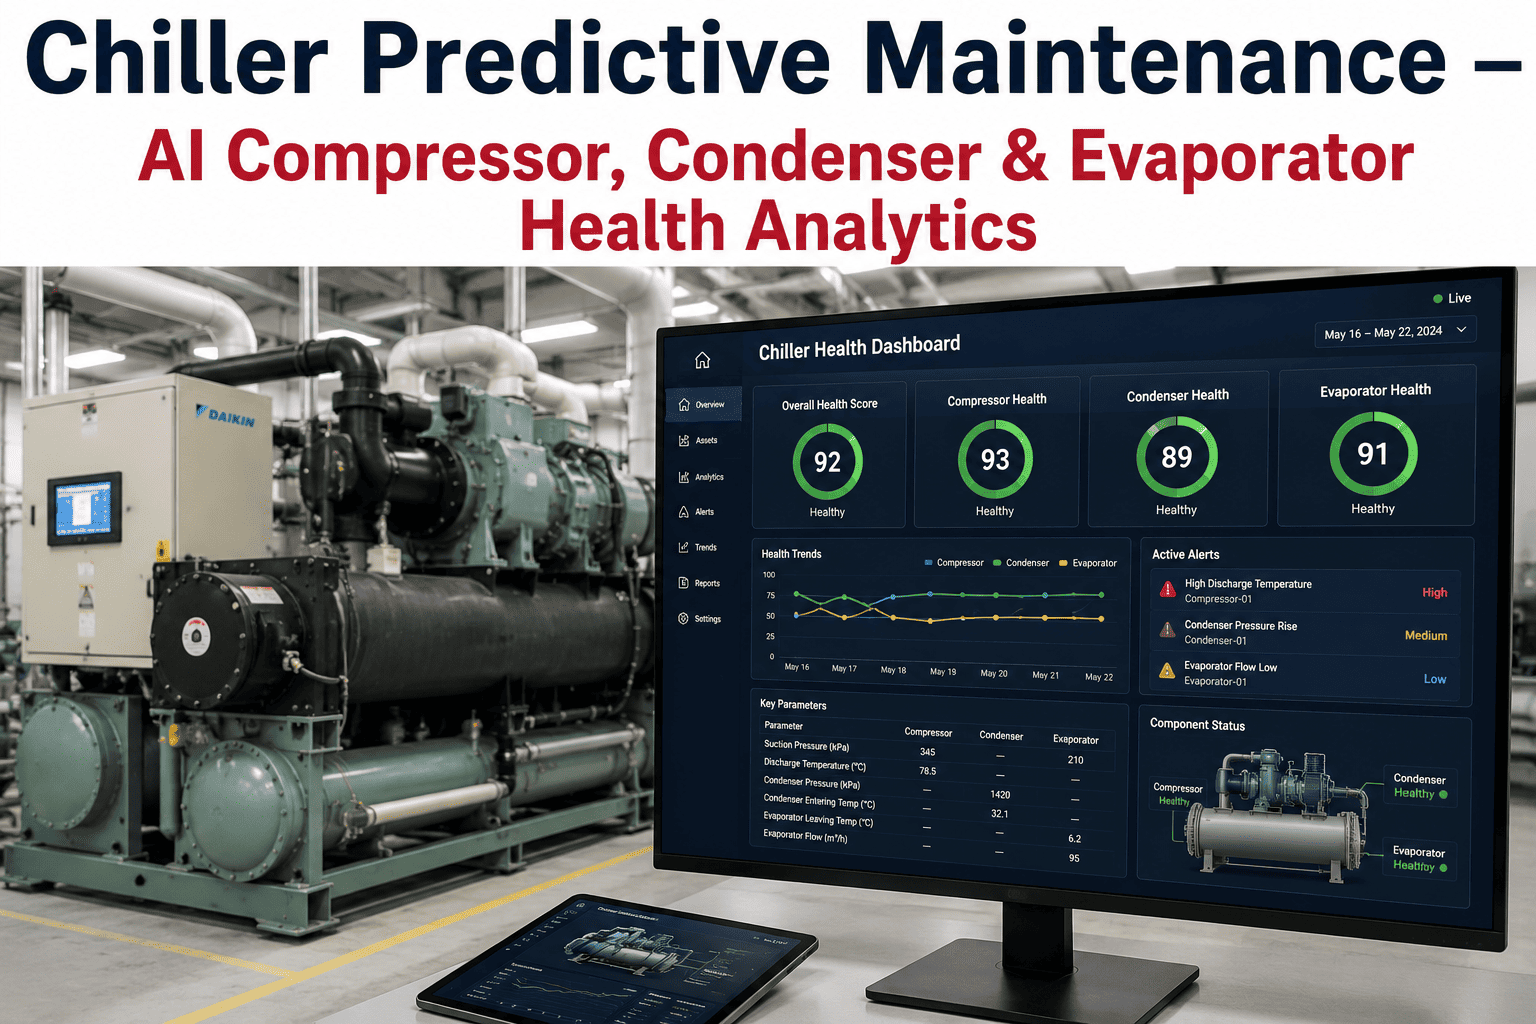
AI reads compressor vibration, condenser approach temperature, and evaporator fouling rate together, every few minutes, and turns the small drifts your quarterly PM cannot catch into work orders your team can act on.
The Real Cost of Waiting for a Chiller to Tell You Something Is Wrong
Chillers fail the way most rotating equipment fails, gradually, through a slow accumulation of small deviations that only become obvious once they combine into a trip, an alarm, or a compressor that will not restart. A bearing does not go from healthy to seized overnight. Condenser tubes do not go from clean to fully fouled in a single week. Refrigerant does not vanish from the circuit in one afternoon unless there is a catastrophic leak. Every one of these failure paths writes itself into the operating data for weeks before the mechanical failure actually happens, but a technician walking the mechanical room once a week or once a month with a clipboard has no realistic way to see a trend that develops that slowly. The readings look normal on any single visit even while the underlying pattern is clearly abnormal across a month of visits.
The financial exposure behind that blind spot is significant. A single chiller often represents a capital investment well into six figures, and it frequently serves as the only source of cooling for an entire building or process line, which means there is no redundancy to fall back on when it trips. Emergency repairs called in outside business hours carry a steep premium over the same repair scheduled during a planned outage, compressor replacements are among the most expensive line items in a mechanical budget, and every day the chiller is down translates directly into lost production, uncomfortable occupants, or spoiled inventory depending on the facility. None of that is a hypothetical risk. It is the default outcome of managing a chiller reactively, and it repeats every cooling season until something changes about how the equipment is watched.
Three Systems, Scored Continuously, on One Chiller
A chiller is really three interdependent systems wearing one nameplate, and each one degrades through its own distinct failure path. Watching only one of the three, which is what most quarterly inspections effectively do, leaves the other two to fail without warning. iFactory scores all three together, continuously, so a fault anywhere in the machine gets caught while it is still cheap to fix.
Bring One Chiller's Trend Data to a 30-Minute Call
Whatever readings your BMS already logs are enough for a first look. We will walk through what a continuous health score would have flagged, and when.
Reactive, Scheduled, and Predictive: Three Very Different Cost Curves
Every chiller maintenance program falls into one of three categories, and the difference between them is not effort, it is timing. Reactive maintenance waits for something to break. Scheduled preventive maintenance guesses at a calendar interval regardless of actual condition. Predictive maintenance reads the equipment's own data and acts only when the data says action is actually needed. The table below lays out how those three approaches compare on the things that matter most to a facility budget.
| Approach | When Work Happens | Typical Repair Cost | Unplanned Downtime Risk |
|---|---|---|---|
| Reactive | After a trip or failure alarm | Highest, emergency labor and rush parts | High, no advance notice |
| Scheduled PM | Fixed calendar interval regardless of condition | Moderate, some unnecessary work performed | Moderate, faults between visits are missed |
| AI Predictive | Only when a monitored parameter actually drifts | Lowest, planned parts and labor | Low, weeks of advance warning |
What Changes Once a Facility Team Can See the Trend
The value of predictive monitoring is not the dashboard, it is the decisions the dashboard makes possible. A facility manager who can see condenser approach temperature climbing for six straight weeks can schedule a tube cleaning during a planned low-occupancy window instead of discovering the fouling only after the chiller can no longer meet setpoint on the hottest day of the year. A reliability engineer who can see vibration and amp draw drifting together can order the bearing kit two weeks ahead of the outage instead of waiting on a rush shipment while the building runs warm.
This also changes the conversation with finance. A capital request for an aging compressor lands very differently when it is backed by a documented degradation trend instead of a technician's general sense that the unit is getting old. Continuous monitoring turns chiller maintenance from an educated guess into a data-backed function that can defend every dollar it asks for, and that shift tends to matter as much to a facilities budget as the avoided repair costs themselves.
Building the Business Case for Continuous Monitoring
Facility managers rarely struggle to convince themselves that continuous chiller monitoring makes sense, the harder conversation is usually convincing a finance team to fund it during a budget cycle already stretched thin. The strongest version of that case is not built on hypothetical risk, it is built on the specific chiller in question: its age, its maintenance history, and what a single unplanned failure would realistically cost in emergency labor, rush parts, and lost cooling capacity during whatever season the failure happens to land in. A five-year-old chiller with no documented efficiency trend is a much harder capital request to defend than the same chiller with eighteen months of approach temperature and vibration data showing a clear, gradual decline.
There is also a second, quieter benefit that tends to surface only after a facility has been monitoring for a full season. Continuous data exposes not just impending failures but also chronic inefficiencies that never rise to the level of an alarm, a condenser that runs a degree or two warmer than it should for months at a time, or a compressor that cycles more than its peers under similar load. None of those individually justify an emergency work order, but together they represent real, recoverable energy cost that a facility team simply could not see without a continuous baseline to compare against. Many teams find that the energy savings alone cover a meaningful share of the monitoring investment well before the first avoided failure is ever counted.
What Good Chiller Data Actually Looks Like Day to Day
It helps to be concrete about what continuous monitoring changes in a technician's actual workday, because the abstract promise of AI-driven insight can otherwise sound more complicated than it is. On a normal day, nothing changes at all, the dashboard shows every monitored chiller running within its expected band and no action is required. That quiet is itself valuable information; it confirms the fleet is healthy without anyone needing to walk the mechanical room to verify it.
On the day a parameter actually drifts, the technician receives a specific, prioritized alert rather than a vague warning. The alert names the exact chiller, the exact parameter, how far it has moved from baseline, and how quickly that movement has been progressing, along with a recommended first inspection step. That is a fundamentally different starting point than a general complaint about warm air on the third floor, and it is the difference between a technician who spends the first hour of a callout diagnosing the problem and one who spends the first hour already fixing it.
Frequently Asked Questions
See What Your Chiller's Data Has Been Trying to Tell You
Bring a few months of chiller readings or BMS trend logs to the call, and we will show you which faults a continuous health score would have already flagged.