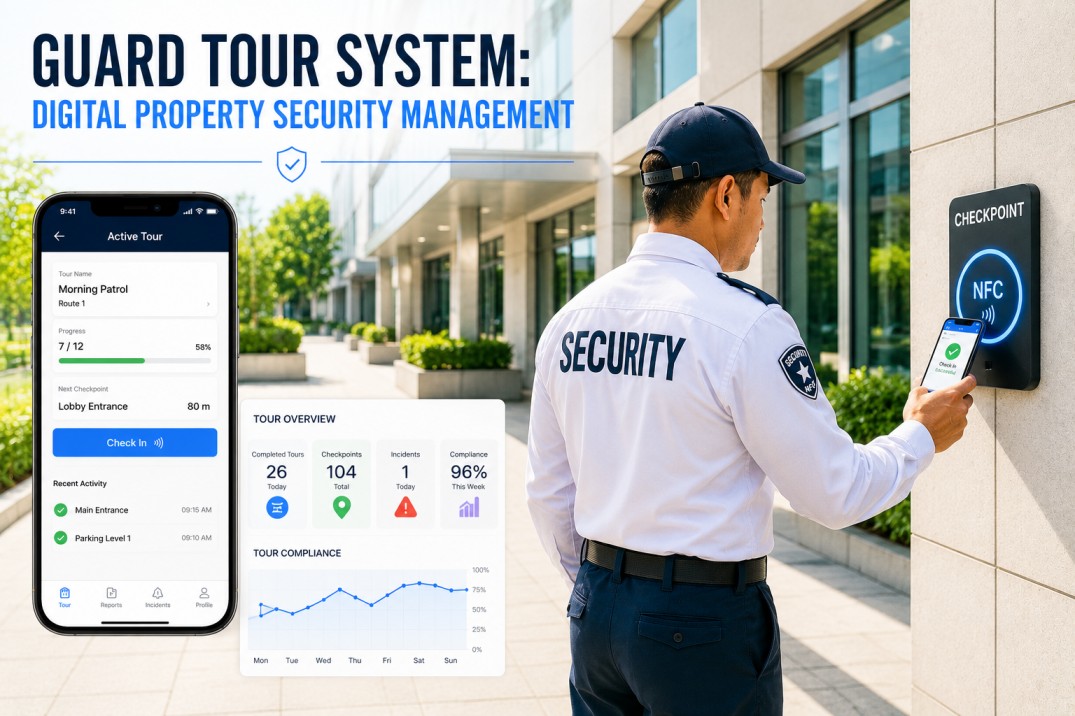
Security guard tour systems have evolved from paper logbooks and mechanical watchman clocks to digital platforms that use NFC tags, QR codes, Bluetooth beacons, and GPS geofences to verify patrol completion at designated checkpoints with precise time-stamped records, photo evidence capture, and automatic alerting when tours deviate from scheduled routes or schedules — a critical advancement given that industry studies indicate 35-45% of security incidents at commercial properties occur during night shifts and weekends when guard patrols are least supervised, and properties without digital tour verification experience 3x higher rates of skipped patrols compared to those with automated checkpoint monitoring. A digital guard tour system provides five essential capabilities that paper-based processes cannot match: tamper-proof checkpoint verification that prevents time sheet fraud by requiring physical presence at each checkpoint with timestamp and guard identity recorded at the moment of scan, configurable tour route management that assigns specific patrol sequences with varying frequencies across different building zones based on risk profiles and historical incident patterns, real-time incident reporting that allows guards to document safety hazards, security concerns, or equipment issues with photos and notes at the exact location and time of discovery, guard performance analytics that track tour completion rates, on-time performance, incident reporting frequency, and response times to individual and shift-level benchmarks, and automated escalation workflows that notify supervisors immediately when a guard misses a checkpoint, deviates from the assigned route, or fails to start a scheduled tour within a configurable grace period. This article explores five checkpoint technology types used in digital guard tour systems, maps a typical facility patrol route with checkpoint placements and zone designations, provides a tour compliance tracking interface with schedule-vs-actual timing, profiles six common incident categories with reporting workflows, and presents guard performance metrics with team-level and individual scorecards for property security managers.
Digitize Your Security Patrols With a Modern Guard Tour System
iFactory's platform includes NFC checkpoint verification, route management, incident reporting with photo capture, guard performance analytics, and automated escalation workflows for commercial properties. Book a demo to see how digital guard tours improve patrol compliance and incident documentation.
Guard Tour Checkpoint Technology — Five Verification Methods
The choice of checkpoint technology determines how guards verify patrol completion, what data is captured at each point, and how resistant the system is to fraudulent check-ins. Each technology type offers different trade-offs between installation cost, verification security, smartphone compatibility, and environmental durability for the specific conditions of commercial property patrol routes.
Facility Patrol Route Map — Checkpoint Layout & Zone Design
An effective guard tour route distributes checkpoints across building zones based on risk priority, asset value, historical incident locations, and emergency response coverage requirements. The floor plan diagram below maps a typical commercial property patrol route with six numbered checkpoints, three zone designations, and the recommended patrol direction that minimizes backtracking while ensuring critical areas are visited at optimal intervals.
Design Effective Patrol Routes With Digital Checkpoint Management
iFactory's guard tour platform enables route design with zone-based checkpoint assignment, configurable patrol sequences, photo verification requirements, and estimated patrol time calculations. Book a demo to see how digital route management improves security coverage consistency.
Guard Tour Compliance Tracking — Schedule vs Actual Performance
Real-time tour compliance tracking compares scheduled patrol rounds against actual checkpoint visits, calculating on-time performance, late arrivals, missed checkpoints, and early departures for each tour and guard. The schedule dashboard below displays a single shift's tour data with color-coded status indicators that enable supervisors to identify compliance issues at a glance and take corrective action before the shift ends.
Security Incident Categories — Reporting Workflow Reference
When guards discover safety hazards, security concerns, or facility issues during patrol, the digital tour system enables immediate incident documentation with location tagging, photo evidence capture, severity classification, and automated notification to the appropriate response team. The reference below profiles six common incident categories with their severity levels, required documentation, and escalation paths.
Guard Performance Scorecard — Team & Individual Metrics
Digital guard tour systems generate objective performance data for each security guard and shift, measuring tour completion rates, on-time performance, incident reporting activity, and response times against property-specific benchmarks. The scorecard dashboard below displays key performance indicators at the team level with individual guard detail cards for supervisor review and performance management.
Frequently Asked Questions About Digital Guard Tour Systems for Commercial Properties
What is a digital guard tour system and how does it differ from paper-based patrol logs?
A digital guard tour system replaces paper logbooks and mechanical watchman clock keys with electronic checkpoint technology that records each patrol stop with a precise timestamp, guard identity, and location identifier that cannot be altered or falsified after the fact. When a guard taps an NFC tag, scans a QR code, or enters a Bluetooth beacon range using a smartphone or handheld reader, the system captures the exact time, date, guard name, and checkpoint ID and transmits that data in real time to a cloud-based management platform accessible to supervisors and property managers. The fundamental difference from paper-based systems is verification integrity: paper logs can be signed in advance, filled out retrospectively, or altered without detection, while digital systems create tamper-evident audit trails where any irregularity such as a guard completing all checkpoints in an impossibly short time triggers automatic alerts. Digital systems also provide real-time visibility that paper cannot match, with live dashboards showing which guards are on which checkpoints at any moment, automated alerts when tours are missed or delayed, historical data for trend analysis and performance benchmarking, and integrated incident reporting with photo evidence attached to the exact checkpoint location and patrol time. Properties switching from paper to digital guard tour systems typically see tour completion rates improve from 65-75% to 93-98% within the first 60 days, with the most significant improvements occurring on night shifts and weekend patrols where supervisor oversight was previously limited or nonexistent.
How should checkpoint locations be selected for an effective guard patrol route?
Checkpoint locations should be selected based on a risk-weighted assessment that considers asset value, vulnerability history, critical infrastructure dependence, and emergency response coverage requirements for each area of the property. Perimeter checkpoints at every exterior door and accessible ground-floor window ensure that forced entry points are inspected on every patrol cycle. High-value asset checkpoints at server rooms, IT infrastructure closets, secure storage areas, and executive office suites protect the organization's most critical physical and data assets. Utility and life safety checkpoints at fire alarm panels, sprinkler system valves, emergency generators, fuel storage, and electrical rooms ensure essential building systems are operational and have not been tampered with. Congestion and hazard checkpoints in loading docks, shipping and receiving areas, and maintenance workshops monitor areas where theft risk and safety incidents are elevated due to frequent personnel and vehicle traffic. Checkpoints should be spaced so that a patrol round takes approximately 20 to 30 minutes at a normal walking pace, allowing guards to complete two to three tours per hour depending on the property size and risk profile. A typical commercial building with 100,000 to 200,000 square feet requires 8 to 12 checkpoints per patrol route. Checkpoints should be installed at a consistent height between 48 and 54 inches above the floor for ergonomic scanning, protected from weather and vandalism with appropriate enclosures, and clearly marked with visible signage indicating that the location is a security checkpoint monitored by the digital guard tour system.
What happens when a guard misses a checkpoint or fails to complete a scheduled tour?
When a guard misses a checkpoint or fails to complete a scheduled tour, the digital guard tour system executes a configurable escalation workflow that begins with an automated alert to the guard's mobile device reminding them of the missed checkpoint and requesting immediate acknowledgment. If the checkpoint remains unscanned beyond a configurable grace period typically set at 5 to 10 minutes from the scheduled time, the system escalates to the shift supervisor who receives a notification with details of the missed checkpoint, the scheduled time, the guard's current location if GPS is enabled, and the time elapsed since the scheduled visit. If the supervisor does not acknowledge the alert within an additional configurable window, escalation proceeds to the security manager or on-duty property manager who can dispatch a relief guard, initiate a welfare check if the guard may be injured or incapacitated, or review camera footage around the missed checkpoint area to determine whether the guard was present and failed to scan or never arrived at the location. All escalation steps are logged for post-incident review. For recurring missed checkpoint patterns, the system can automatically adjust patrol schedules to redistribute workload, flag specific guards for retraining, or recommend checkpoint relocation if the missed location is consistently problematic due to physical accessibility issues, safety concerns, or route inefficiency. Properties using digital guard tour systems with automated escalation reduce missed checkpoints by 60-75% within the first quarter of deployment compared to systems without escalation.
How do digital guard tour systems handle incident reporting during patrols?
Digital guard tour systems handle incident reporting through a structured in-app workflow that activates when the guard selects an incident type from a predefined category menu at any point during the patrol, not only at checkpoint locations. The guard captures photos of the incident using the phone camera, which automatically tags the image with the current GPS coordinates, timestamp, and guard identity. The guard then completes a standardized incident form that includes fields for incident category such as fire hazard, unsecured door, water leak, equipment fault, suspicious activity, or unauthorized access, severity level selection that determines the escalation priority, a free-text description of the incident and actions already taken, and any additional photo or voice note evidence. Once submitted, the system routes the incident report to the appropriate response team based on the category and severity configuration. Critical incidents generate immediate push notifications and SMS alerts to the designated responders with all incident details and photo evidence included in the alert message. The incident record is permanently linked to the guard's patrol tour at the specific checkpoint or GPS location where it was reported, creating a complete timeline of patrol activity and incident discovery that is invaluable for post-incident investigations, insurance claims documentation, and liability defense. Digital incident reporting typically captures 3 to 5 times more incidents than paper-based systems because guards can complete reports in under 60 seconds directly from their patrol route without needing to return to a guard office to fill out paper forms.
What performance metrics should property managers track for guard patrol effectiveness?
Property managers should track tour completion rate as the primary metric, calculated as the percentage of scheduled checkpoints that are actually visited within the allowed time window, with a target benchmark of 95% or higher for well-managed security teams. On-time checkpoint performance measures the percentage of checkpoint scans that occur within a configurable tolerance window before or after the scheduled time, typically plus or minus 5 minutes, with on-time performance above 90% indicating effective patrol execution. Incident reporting rate tracks the number and category distribution of incidents reported per tour or per shift, providing insight into guard attentiveness and environmental awareness rather than serving as a negative performance indicator. Average incident response time measures the elapsed time between incident report submission and the arrival of the designated responder at the incident location, with sub-5-minute response times representing excellent performance for most commercial property environments. Time-between-checkpoints analysis identifies irregular patrol patterns where a guard may be spending too little or too much time between consecutive checkpoints, potentially indicating rushed patrols or unauthorized stops. Individual guard scorecards aggregating these metrics over rolling 30-day and 90-day periods enable supervisors to identify training needs, recognize top performers, and detect declining performance trends before they result in security gaps. Properties that actively review guard performance metrics on at least a weekly basis achieve 15-20% higher overall patrol compliance compared to properties that review metrics monthly or only in response to incidents.
Transform Security Patrol Management With a Digital Guard Tour System
iFactory's platform provides NFC checkpoint verification, route management, tour compliance tracking with real-time alerts, incident reporting with photo capture, guard performance analytics, and automated escalation workflows for commercial properties of any size. Book a demo to see how digital guard tours improve patrol accountability and security incident response.


.png)