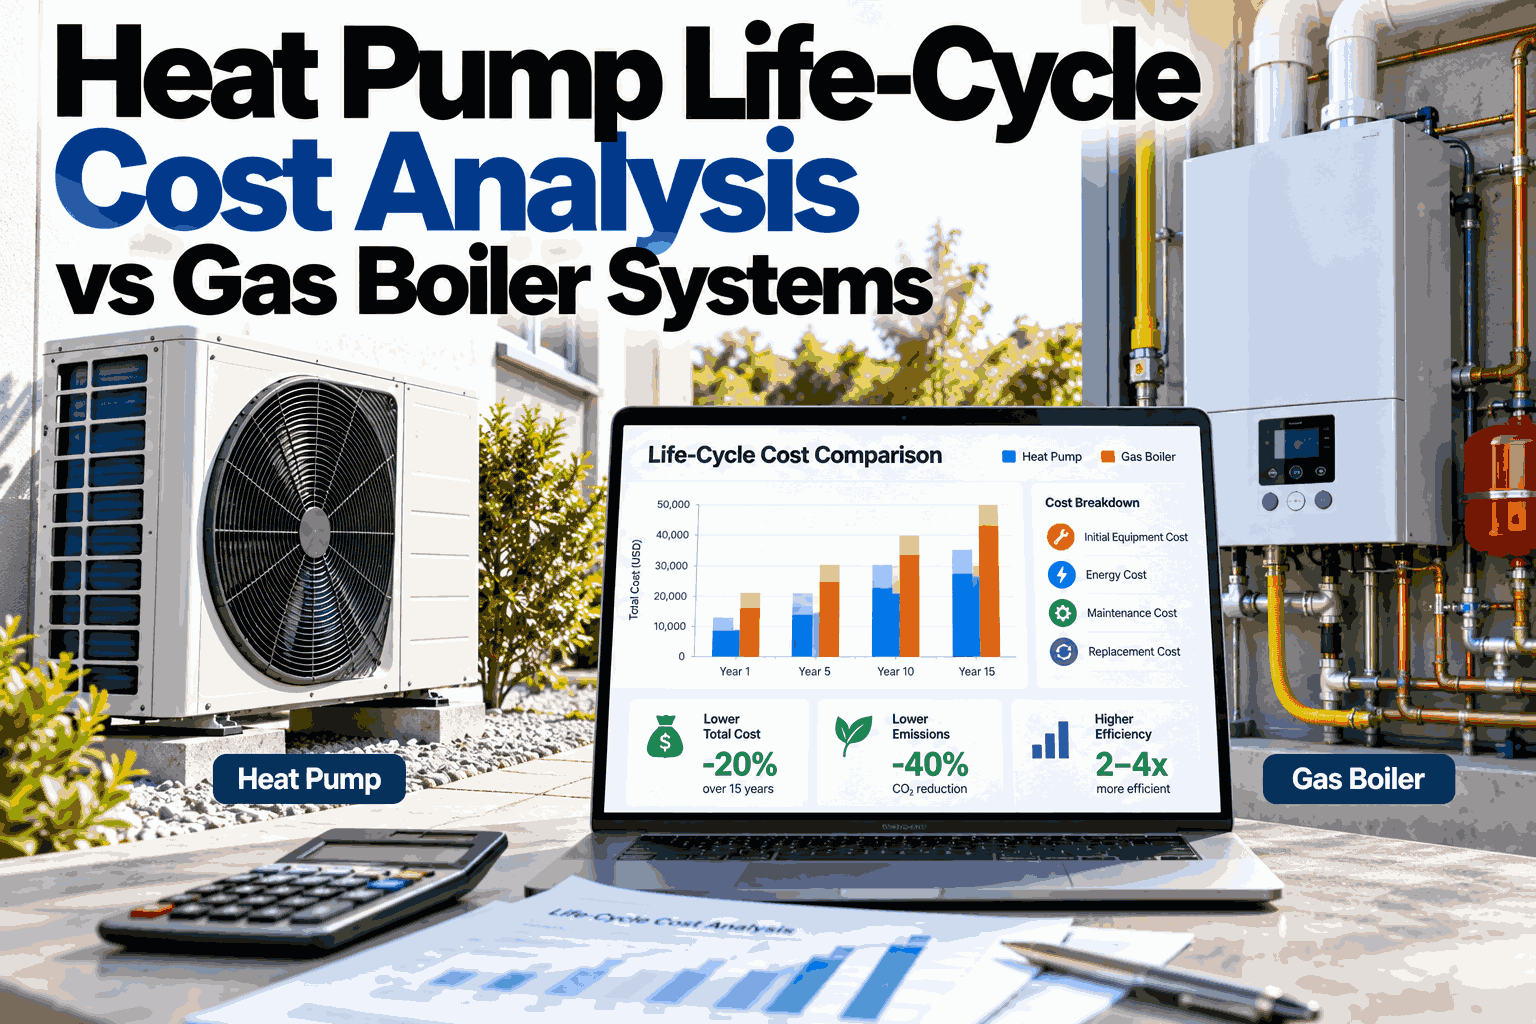
A heat pump versus gas boiler comparison usually stops at install cost and annual energy bill, which misses the one variable that changes the whole 25-year math: a well-maintained heat pump can run 20-25 years, while a condensing boiler typically needs replacing at 10-15 years. That means a single heat pump install can span the same horizon as one or two full boiler replacements — a timing difference most simple comparisons never model. Facilities teams ready to build this against their own building's numbers can talk to iFactory AI about a 25-year electrification cost model.
The Comparison That Actually Spans 25 Years, Not Just Year One
iFactory AI models heat pump versus gas boiler life-cycle cost across CapEx, OpEx, carbon cost, and the replacement-timing asymmetry most comparisons skip entirely.
Four Cost Categories, Not One Installed Price
A heat pump versus boiler decision usually gets reduced to "which costs more to install." A real life-cycle comparison has to carry four separate cost categories across the full horizon.
Capital expenditure
Equipment and installation cost, including any electrical service upgrade a heat pump retrofit may require.
Operating expenditure
Annual fuel/electricity cost plus routine maintenance, both sensitive to local utility rates and usage patterns.
Carbon cost
Direct emissions from combustion versus the grid emissions factor behind the electricity a heat pump draws.
End-of-life cost
Replacement timing and disposal/refrigerant-handling cost at the end of each system's working life.
The Lifespan Mismatch Nobody Models
The single biggest structural difference between the two systems isn't efficiency or fuel cost — it's how often each one needs replacing inside the same 25-year window.
Model the Full Replacement Timeline for Your Building
Get a demo of iFactory AI's 25-year life-cycle model against your own equipment age and condition.
CapEx: Higher Upfront, Variable by Building Type
Heat pump installations commonly carry a higher upfront cost than a like-for-like gas boiler, though the gap varies by building type, existing infrastructure, and whether electrical service upgrades are needed.
What Drives the CapEx Gap, Specifically
The upfront cost difference isn't one lump number — it breaks down into a handful of specific drivers, and knowing which ones apply to a given building changes how large the gap actually is.
OpEx: Where Local Utility Rates Decide the Outcome
Operating cost is the single most locally-variable piece of this comparison. The same two systems can land on opposite sides of the cost line depending on the building's actual electricity and gas rates.
Run the OpEx Comparison on Your Own Utility Rates
Schedule a walkthrough and iFactory AI will model OpEx against your building's actual electricity and gas rates.
Carbon Cost: Direct Combustion vs the Grid's Emissions Factor
A gas boiler's carbon footprint is straightforward — it's tied directly to combustion. A heat pump's carbon footprint depends entirely on what's generating the electricity it draws, which changes by region and over time.
A Worked 25-Year Horizon, Structured Correctly
The point isn't to produce one universal number — local rates make that impossible — but to make sure the model's structure captures every cost event that actually falls within 25 years.
| Cost event | Gas boiler path | Heat pump path |
|---|---|---|
| Year 0 install | One capital event | One capital event, typically higher |
| Year 10-15 replacement | Likely one full replacement | Usually none yet — still within rated life |
| Year 20-25 replacement | Possibly a second replacement | Approaching end of rated life, first replacement due |
| Annual OpEx | Fuel cost fixed by combustion efficiency | Fuel cost variable by SPF and local electricity rate |
| Carbon trend | Flat across the horizon | Typically improving as grid mix shifts |
Maintenance Cost: Different Failure Modes, Different Bills
Both systems need annual servicing, but what tends to go wrong — and what it costs to fix — differs enough between the two to belong in the OpEx line explicitly.
What the Business Case Needs to Show a Finance Committee
A heat pump retrofit decision usually competes for capital against other building investments. The business case holds up better when it's built from the building's own numbers.
A Composite Illustration: The Boiler Replacement That Wasn't in the First Model
This is an illustrative composite, not a specific named building, built to show how a 25-year horizon changes the comparison.
Getting Started: What to Pull Together First
Building this model doesn't require a perfect dataset on day one. A handful of inputs get a usable first draft running.
Who Uses This Model, Day to Day
A life-cycle cost model isn't built once and filed away. Different roles pull different value from the same underlying numbers.
Where iFactory AI Fits
A real life-cycle comparison needs the building's own equipment age, utility rates, and maintenance history — not a generic industry assumption. iFactory AI builds that model from the asset record directly.
CapEx & Replacement Timing
Models the full 25-year replacement timeline for both paths, based on each system's actual expected working life.
OpEx Against Real Utility Rates
Runs the efficiency comparison against the building's own electricity and gas rate structure, not a national average.
Carbon Cost Trajectory
Tracks the grid emissions factor over time against the boiler's fixed combustion emissions.
Finance-Ready Output
A traceable model a committee can test, with every assumption sourced back to the building's own data.
Turnkey AI, Live in 6-12 Weeks
iFactory AI ships as a complete hardware-and-software bundle — a pre-configured NVIDIA AI server, racked and ready, with software pre-loaded. Rack it, plug in power and Ethernet, and the AI is live. iFactory's team handles cabling, network setup, PLC/SCADA integration, operator training, and 24x7 remote monitoring.
Expert Review
This page's lifespan figures and life-cycle cost framework were reviewed for accuracy against published heat pump and boiler cost-comparison research before publication.
Frequently Asked Questions
Is a heat pump always cheaper than a gas boiler over 25 years?
No, and treating it as a universal rule is the mistake this page is built to avoid. The outcome depends heavily on local electricity and gas rates, available incentives, the heat pump's actual efficiency in the building's climate, and how much of the boiler's shorter replacement cycle falls inside the comparison window. A building with very low gas rates and high electricity rates can see a different result than one with the reverse. Reach out to iFactory AI's team to run the comparison on your own building's actual rates.
Why does the boiler's shorter lifespan matter so much to the comparison?
Because a 25-year comparison that only counts one capital event per system is comparing apples to oranges if one system's working life is 10-15 years and the other's is 20-25. A gas boiler path commonly needs one, sometimes two, full replacements inside the same horizon a single heat pump install can cover — and each of those replacement events is a real capital cost that belongs in the 25-year total.
How does the carbon cost comparison change over the equipment's life?
A gas boiler's carbon intensity stays essentially flat for its entire working life, since it's tied directly to the fuel it burns. A heat pump's carbon intensity is tied to the local electrical grid's emissions factor, which in most regions tends to improve over a 20-25 year horizon as renewable generation capacity grows — meaning the heat pump's carbon case often gets stronger over time without any action from the building owner.
What local factors have the biggest effect on which system wins the OpEx comparison?
The building's actual electricity rate relative to its gas rate is usually the single largest factor, followed by the heat pump's seasonal performance factor in that specific climate and building envelope. Available incentives, subsidies, or grid decoupling policies can also shift the comparison meaningfully, which is why a national average figure rarely applies cleanly to one specific building.
What information does a building need to gather before running this comparison?
The current boiler's age and condition, the building's actual electricity and gas billing rates, an estimate of the heat pump's expected seasonal performance factor for the climate zone, and any available local incentives or rebate programs. Set up time with iFactory AI's team and they can help assemble this into a complete model.
Build the Full 25-Year Comparison on Your Own Numbers
iFactory AI models CapEx, OpEx, carbon cost, and replacement timing against your building's real equipment and utility data. Get a demo to see the full model.