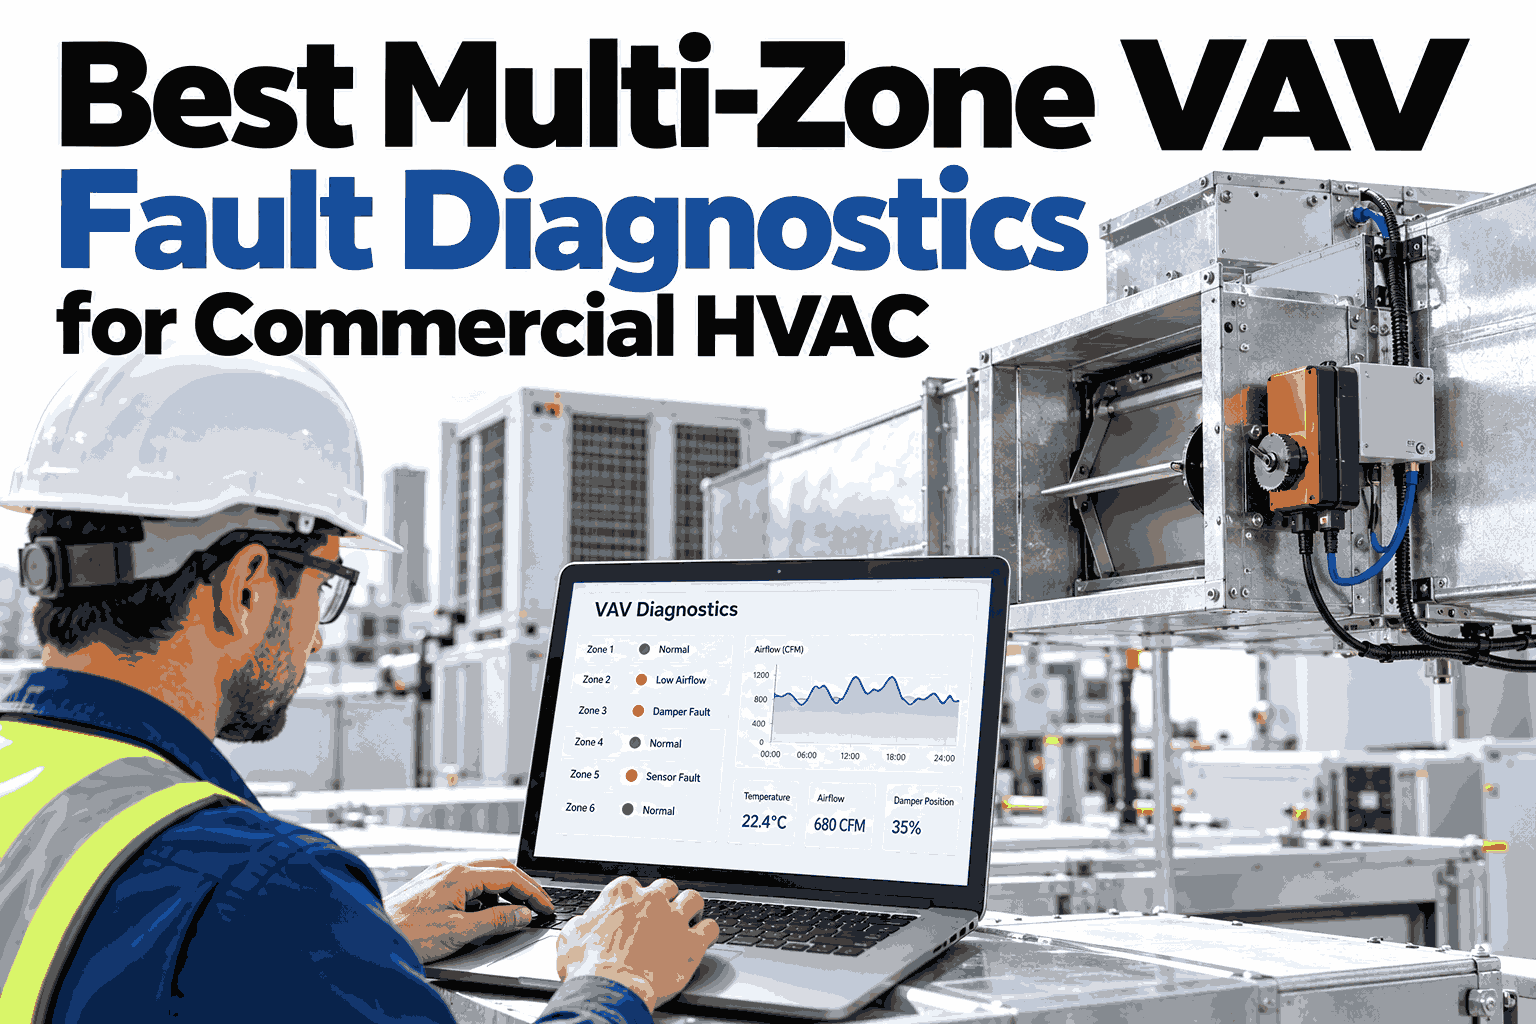
A commercial building can have hundreds of VAV boxes, and each one can fail quietly: a damper that sticks, a sensor that drifts, a reheat valve that leaks while the zone is being cooled. Alarms from the building automation system rarely say which fault matters most, so technicians end up chasing complaints one room at a time. Multi-zone VAV fault diagnostics reads every zone, names the likely cause, and rolls everything into a single ranked queue for the building. Facilities teams can see how iFactory AI ranks VAV faults across a whole building in a short demo that uses their own floor plans.
Every VAV Zone Diagnosed, Every Fault Ranked, One Queue for the Building
iFactory AI checks actuators, sensors and airflow zone by zone, then groups what it finds by air handler and floor so your team fixes the highest-impact problem first.
How a VAV Zone Works and Where It Breaks
A VAV box varies the airflow delivered to one zone and adds heat when the room needs it. Following the air through the box shows five points where something can go wrong, each with its own signature in the data.
Conditioned air arrives from the air handler at a set temperature and duct pressure.
The actuator opens or closes the damper to meet the zone's airflow demand.
A flow sensor reports how much air is actually moving through the box.
A hot water or electric coil warms the air when the zone is below setpoint.
The room temperature sensor tells the controller whether the box is doing its job.
Faults at point one affect many boxes at once, while faults at points two to five affect a single zone. Telling the two apart is the first job of any good diagnostic. Teams can ask iFactory AI how it separates upstream causes from box-level faults in their own system.
The Data Points Behind Each Diagnosis
Zone diagnostics usually runs on trend data the building automation system already collects. Three families of points are compared against each other, and the disagreement between them is what reveals a fault.
When a damper is commanded fully open yet the airflow stays low, the data itself points to the actuator, the linkage or the sensor. Reference sequences such as ASHRAE Guideline 36 describe how a healthy VAV box should behave, which gives the comparison a sound baseline.
Four Trend Shapes Every Technician Should Recognise
Faults leave a pattern in the data long before anyone feels a draught or a hot spot. These four shapes show damper position over a short period, and each one tells a different story about the box.
The damper moves smoothly as demand rises and falls. Small changes follow the room, and nothing stays pinned at one value.
The reading barely moves while the zone asks for more air. This points to a failed actuator, a slipped linkage or a frozen feedback signal.
The damper swings open and shut repeatedly. Common causes are loop tuning that is too aggressive, or an unstable airflow signal.
A reading creeps in one direction over days or weeks. The zone slowly goes out of tune because the controller trusts a number that is wrong.
Each shape is matched automatically, zone by zone, and each match is attached to the work order. Ask the iFactory AI team to show these shapes in your own trend data during a pilot review.
From Occupant Complaint to Likely Cause
Facilities teams hear symptoms, not fault names. The decoder below links the five most common complaints to the causes diagnostics checks first, in the order a technician would want to test them.
Damper stuck or slow to open, airflow below demand, low static pressure, warm supply air upstream, or a zone sensor reading lower than the room.
Reheat valve leaking or stuck open, minimum airflow set too high, damper stuck open, or a zone sensor reading higher than the room.
Control loop tuned too aggressively, an unstable airflow reading, a sticking actuator, or pressure swings in the duct.
Damper held below its ventilation minimum, an airflow sensor reading high, or an occupancy mode override left active.
Duct pressure set too high, a damper working at high velocity, or loose actuator linkage rattling in the box.
A complaint is only the starting clue. The diagnostic compares it with the trends so the technician arrives knowing which of these causes is most likely.
Trace One Complaint From Symptom to Cause
Bring a recent comfort complaint from your building. iFactory AI will show how the zone's data is read, which causes are ranked, and what evidence the work order would carry.
Faults Change With the Season
A VAV box does different work in different conditions, so the same fault can stay hidden for months and then appear in a single week. Season-aware diagnostics checks each box against what it should be doing right now.
Dampers open toward maximum airflow.
Dampers stuck partly closed, maximum airflow set too low, hot zones caused by supply conditions.
Dampers sit at minimum while reheat works.
Reheat valves stuck, low discharge temperature, minimum airflow set too high and wasting heat.
Boxes switch between heating and cooling often.
Heating and cooling at the same time, leaking valves, setpoints with too little gap between them.
Zones recover before occupants arrive.
Schedules that overlap, zones not ready at opening, overrides that were never cleared.
Because the system learns each zone's normal behaviour, a fault seen only in one season is flagged when it first appears, not when the first complaint arrives.
The Energy Side of VAV Faults
Comfort complaints are the faults people notice. The ones that waste energy are often silent, because the room feels acceptable while the system works against itself behind the ceiling.
Heating and cooling at once
A leaking reheat valve warms air that the air handler has just cooled. The room may feel fine, but both plants are working.
Minimum airflow too high
A box that moves more air than the space needs forces extra fan work and extra reheat in cool weather.
Static pressure set too high
If one stuck damper makes the system raise duct pressure for everyone, the fan runs harder across the whole building.
These faults rarely trigger an alarm because nothing is out of range. They are found by comparing related points over time. Teams can review an energy-focused fault list for their building in a demo.
Rolling Zones Up Into One Building View
Nine hot zones on the same air handler are rarely nine separate problems. Grouping faults by floor and air handler turns a flood of alarms into a short list of causes your team can actually act on.
In this example, the nine faulted zones on air handler 2 appear in the queue as a single upstream item, such as supply air temperature, followed by the one-off box faults. Preview a building rollup built from your own layout to see how many items your team would really face.
How the Fault Priority Queue Is Ranked
A long list of faults is not a plan. Ranking by impact tells technicians where the next hour of work does the most good. The chart below shows an example queue, scored out of one hundred.
What Goes Into the Score
The queue and weights are examples. Your own priorities, such as a floor with an executive suite or a lab, can raise or lower any factor, and the iFactory AI team can help set the weighting to match how your building is run.
A Zone Health Score Everyone Can Read
Managers do not need to read trend charts. A simple health view tells them how much of the building is working as designed, and whether that share is improving or slipping from month to month.
Zone holds its setpoint, damper and airflow agree, and no fault is active.
An early sign such as slow response or drifting readings. Not yet a comfort problem.
A confirmed fault with a likely cause, sitting in the priority queue.
Watching the share of watch-level zones is the earliest signal of trouble to come, because a zone can sit there for weeks before a complaint is raised.
The Life of a Fault: Without and With Diagnostics
The repair itself is rarely the slow part. The time goes on finding out what is wrong, and on returning to site with the wrong part. Here are the two paths for the same stuck damper.
Occupant complains
Technician dispatched
Manual checks above the ceiling
Best guess at the part
Return visit
Fixed, unconfirmed
Fault flagged from trends
Cause ranked with evidence
Work order with location
Right part on first trip
Repair completed
Zone confirmed back to normal
The comparison shows where the time is saved: fewer steps of searching and a closing check that the zone really recovered. Walk through a work order built from real zone data in a short session.
What a Diagnostic Work Order Contains
A ticket that says only "zone too hot" starts the search from zero. A diagnostic work order carries what the system already knows, so the technician can begin repairing instead of investigating.
The last row matters most. A closure test means the ticket is finished when the data shows the zone has recovered, not just when someone marks it complete.
What Separates the Best Diagnostics From the Rest
Many tools claim fault detection. Few take it from raw alarms all the way to verified repairs. Use the rubric below to place any product, including ours, on a three-level scale.
| Capability | Basic | Good | Best |
|---|---|---|---|
| Zone coverage | A sample of zones | Every VAV box on the system | Every zone, every day, with trend history |
| Diagnosis depth | Threshold alarms | Fault type named | Ranked likely causes with evidence |
| Rollup | Flat list of alarms | Grouped by air handler | Common causes merged into one building queue |
| Prioritisation | Newest first | By severity | By comfort, energy and spread |
| Work order | Alarm email | Ticket with the fault name | Ticket with evidence, location and a first check |
| Verification | None | Manual closure | System confirms the zone recovered |
A tool that reaches the third column on all six rows saves technician time at every step. Teams can ask for a scored copy of this rubric for the building they manage.
Where Diagnostics Fits Different Building Types
VAV systems serve very different buildings. The mix of zones, schedules and priorities changes what a team wants to see first, and where early results are most visible.
Many zones per air handler
Comfort complaints drive most work, so grouping by air handler and ranking by impact cuts the most noise.
Varied schedules and many buildings
Overrides and schedule overlaps are common, and one central queue replaces checking each building separately.
Consistent ventilation matters
Airflow faults deserve early attention. Diagnostics supports, but never replaces, required compliance checks.
Whatever the building, the starting point is the same: connect the trend data, learn normal behaviour and pilot on one air handler.
Three Pitfalls That Slow Zone Diagnostics Projects
Most delays have little to do with the analytics. They come from data and habits around it, and each one has a simple remedy if it is spotted in the first few weeks.
Zone names in the building system do not match the floor plan, so a fault cannot be located.
Map every zone to a floor and air handler once, during setup, and keep that map under change control.
Overrides and manual changes are left active, so the system compares zones against settings nobody intended.
Flag long-running overrides in the queue and review them weekly with the operators who set them.
Technicians are not shown how rankings are decided, so they distrust the first few work orders.
Walk the team through the evidence on early tickets, and let them correct causes so the system learns from them.
Trust is built ticket by ticket. Our team can run a short onboarding session for the technicians who will use the queue every day.
What to Measure in the First 90 Days
A pilot succeeds when everyone agrees in advance what good looks like. Three checkpoints, each with a few simple measures, keep the review honest and make the next decision easy to take.
Data is flowing for every zone in scope, normal behaviour is learned, and the first confirmed faults are in the queue. Check that the listed causes match what technicians find on site.
Repairs are being made from work orders, and closure tests are confirming recovery. Compare complaint volume and repeat visits with the same period before the pilot started.
The share of healthy zones is stable or rising, and the team trusts the ranking. Decide which air handlers or buildings to add next, and which priority weights to adjust.
Keep the measures few and visible. Open faults, time to closure, repeat visits and share of healthy zones are usually enough, and a planning call can set the baselines before the pilot begins.
Turnkey Delivery, Live in 6 to 12 Weeks
iFactory AI arrives pre-configured on an NVIDIA server that ships racked and ready with software pre-loaded. Your team racks it and connects power and Ethernet, and the rollout follows three phases across twelve weeks.
Server ships, cabling and network are completed, and the building automation and maintenance systems are linked.
Zones are mapped to air handlers and floors, normal behaviour is learned, and one air handler is piloted.
The facilities team is trained, the queue goes live and 24x7 remote monitoring begins.
The scope covers cabling, network, system integration, training and remote monitoring. Plan the twelve weeks against your building calendar in a short call.
Reporting for Owners, Tenants and Operators
The same diagnostic record supports three audiences. Each wants a different view, and having it ready removes the manual work of pulling numbers together at month end.
A live queue with the next job, its location and its evidence. The report answers what to fix today.
Weekly counts of open and closed faults, by floor and air handler, with the share of zones in good health.
A monthly summary of comfort performance and resolved issues, which helps answer tenant questions with evidence.
Reports are only as honest as the data behind them, so each figure can be traced back to the zone and trend that produced it. Request a sample monthly report to see the layout.
Frequently Asked Questions
How is fault diagnostics different from BAS alarms?
BAS alarms fire when a value crosses a limit and say little about why. Diagnostics compares related points, names the likely fault, and ranks it against everything else in the building. Ask our team for a side-by-side example using your alarm history.
Do we need to install new sensors?
Usually not. Diagnostics works from trend data your building automation system already records for each VAV box. Where a needed point is missing, that gap is listed in the pilot review, so you can decide whether adding it is worthwhile.
How does the queue avoid alarm fatigue?
Faults sharing a likely upstream cause are merged into one item, and everything is ranked by comfort, energy and spread. Technicians see a short, ordered list instead of hundreds of alerts. See a live queue in a demo and judge how long it is.
Does it depend on one VAV box manufacturer?
The analysis runs on trend data from your building automation system, not on one brand of box. Supported protocols and point naming are confirmed during setup. Mixed fleets of boxes from several manufacturers are common and are reviewed in the pilot.
How soon will we see useful results?
Once data is connected, the first weeks are spent learning normal behaviour for each zone, and early findings appear during the pilot on one air handler. Ask the team for a realistic timeline based on your system and trend history.
Turn Hundreds of VAV Alarms Into One Ranked Plan
iFactory AI diagnoses every zone, groups faults by their likely cause and ranks the whole building so your team fixes what matters first. Book a walkthrough to see it on your own floors and air handlers.