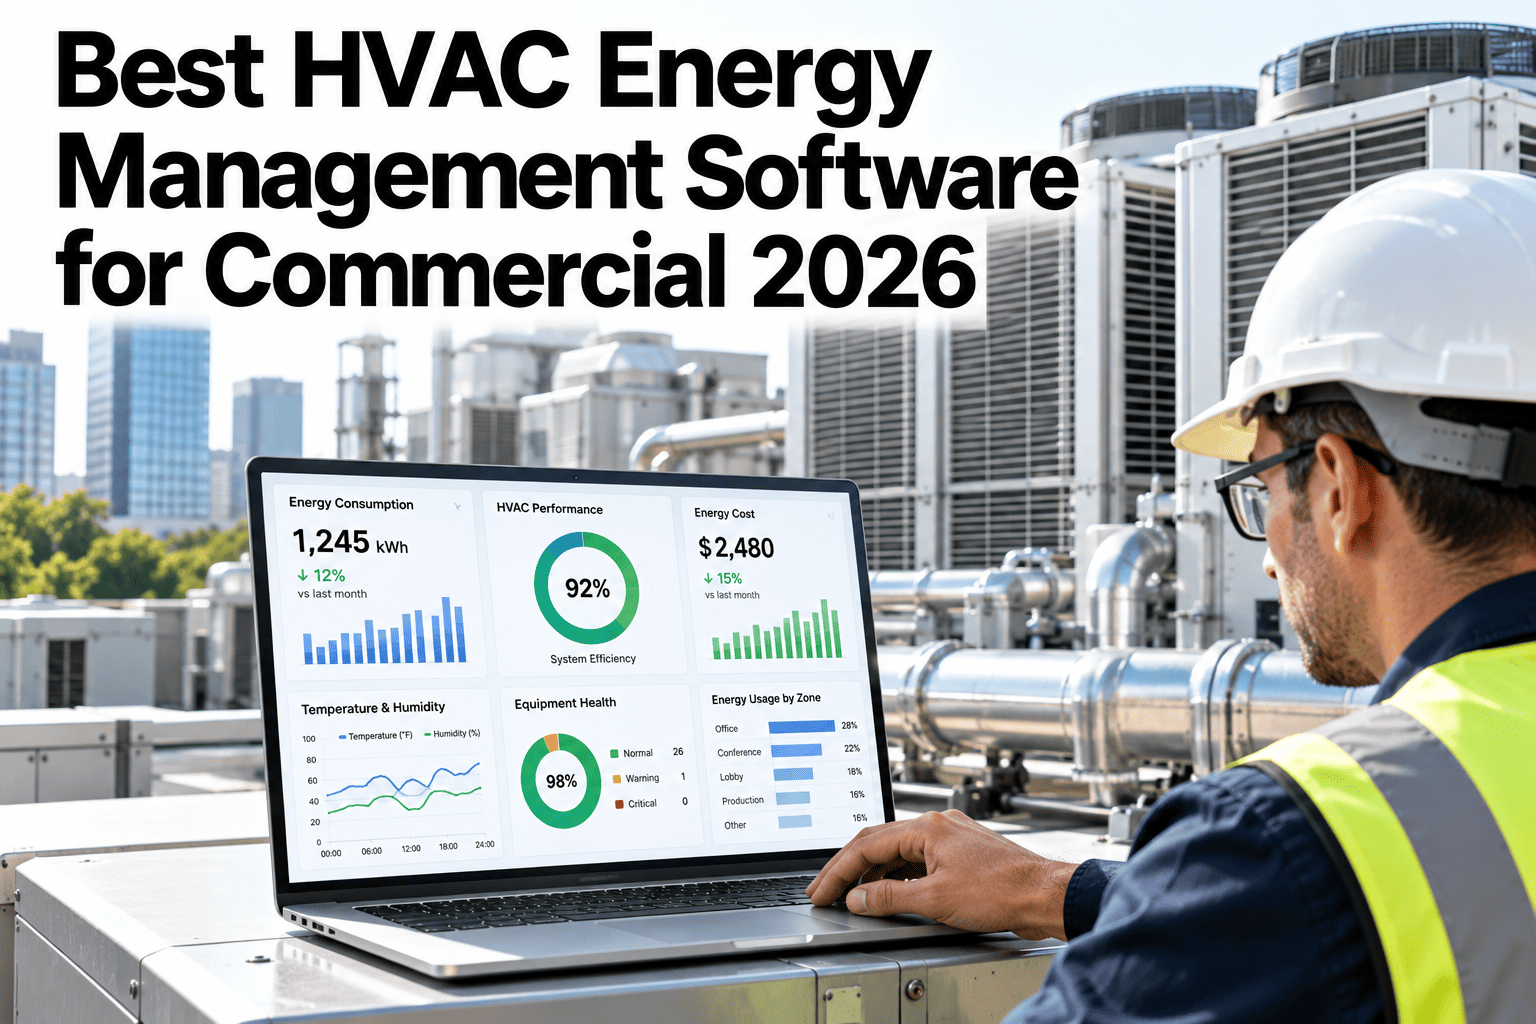
HVAC typically accounts for the largest single share of energy use in a commercial building, which makes it the highest-leverage place to look when evaluating energy management software, yet many buying decisions still focus on dashboards and reporting rather than the sub-metering granularity and control optimization that actually drive savings. A platform that only visualizes consumption after the fact leaves the hardest part, acting on what the data shows, to a human reviewing a report days later. Comparing platforms on what they actually do with the data, not just how the dashboard looks, is something facility teams can work through against their own building in a short session.
HVAC Is the Largest Energy Line Item. It Deserves More Than a Dashboard.
iFactory combines sub-metering, anomaly detection and control optimization, so energy data turns into action, not just a report.
What to Actually Look For in Energy Management Software
Many platforms in this category look similar in a sales demo. The real differences show up in how much of the loop, from reading to insight to action, the platform actually closes.
| Capability | What to Look For | Why It Matters |
|---|---|---|
| Sub-metering granularity | Equipment-level, not just whole-building meters | Whole-building data can't tell you which unit is wasting energy |
| Anomaly detection | Flags deviations from expected consumption automatically | Waits for a monthly bill review and the waste has already happened |
| Control optimization | Can adjust setpoints and schedules, not just report on them | Reporting alone requires a human to act on every insight manually |
| BMS integration | Reads and writes to your existing BAS rather than a separate system | A disconnected platform adds another screen, not a closed action loop |
Get Your Building's Sub-Metering Coverage Assessed
Book a 30-minute session and iFactory will review your current metering and control capability against this framework.
Three Capabilities That Separate Good From Great
Equipment-Level Sub-Metering
Granular metering down to individual air handlers and chillers reveals which specific equipment is driving a consumption trend, not just the building total.
Automated Anomaly Detection
Consumption that deviates from its expected pattern for the time of day and outdoor conditions gets flagged automatically, before it shows up on a bill.
Closed-Loop Control Optimization
The platform can adjust setpoints and schedules directly through the BMS, turning an insight into an action without manual intervention.
Savings Compound Across Capabilities
Each capability adds a different kind of savings, and they stack rather than overlap, which is why platforms offering only one tend to underperform a fully closed-loop system.
Signals Your Current Platform Is Reporting-Only
Where iFactory Fits
iFactory closes the full loop from metering to insight to action, rather than stopping at a dashboard.
Equipment-Level Sub-Metering
Granular metering identifies exactly which equipment drives a consumption trend, down to the individual unit.
Real-Time Anomaly Detection
Consumption deviations are flagged as they happen, not discovered weeks later on a utility bill.
Direct BMS Control Optimization
Setpoint and schedule adjustments are made directly through your existing BMS, closing the loop automatically.
Portfolio-Wide Benchmarking
Buildings are compared against each other and against weather-normalized baselines to find where savings potential is highest.
Reviewed by iFactory's Energy Engineering team for alignment with current commercial HVAC energy management practice. The end-use breakdown shown is illustrative; actual energy splits vary by building type, climate and equipment age, and should be measured directly rather than assumed from industry averages.
Frequently Asked Questions
Do we need to install new hardware for equipment-level sub-metering?
Often partially. Some equipment-level data may already be available through existing BAS points, while true sub-metering for others may require adding meters, assessed during the initial coverage review rather than assumed upfront. Support can assess what your building already has.
How does automated control optimization differ from our existing BMS schedules?
Existing BMS schedules are typically static and set once, while optimization adjusts based on live conditions like occupancy, weather and detected anomalies, within limits your facility team defines.
What kind of payback period is realistic?
It depends heavily on current metering coverage, building age and how much manual oversight currently exists, so a building-specific estimate is more useful than an industry-wide figure. See a payback estimate built for your own building in a short session.
Can this work alongside our existing energy reporting tools?
Yes, the platform is built to feed data into existing reporting and sustainability tracking tools rather than requiring you to replace an established reporting process.
Does control optimization risk occupant comfort?
Adjustments are made within comfort bounds your facility team sets, and any automated change can be reviewed or reverted, so optimization works within agreed limits rather than overriding comfort priorities. Ask support how comfort bounds are configured.
Turn Your Largest Energy Line Item Into Your Biggest Savings Opportunity
iFactory closes the loop from sub-metering to anomaly detection to control optimization. Book a walkthrough on your own building.