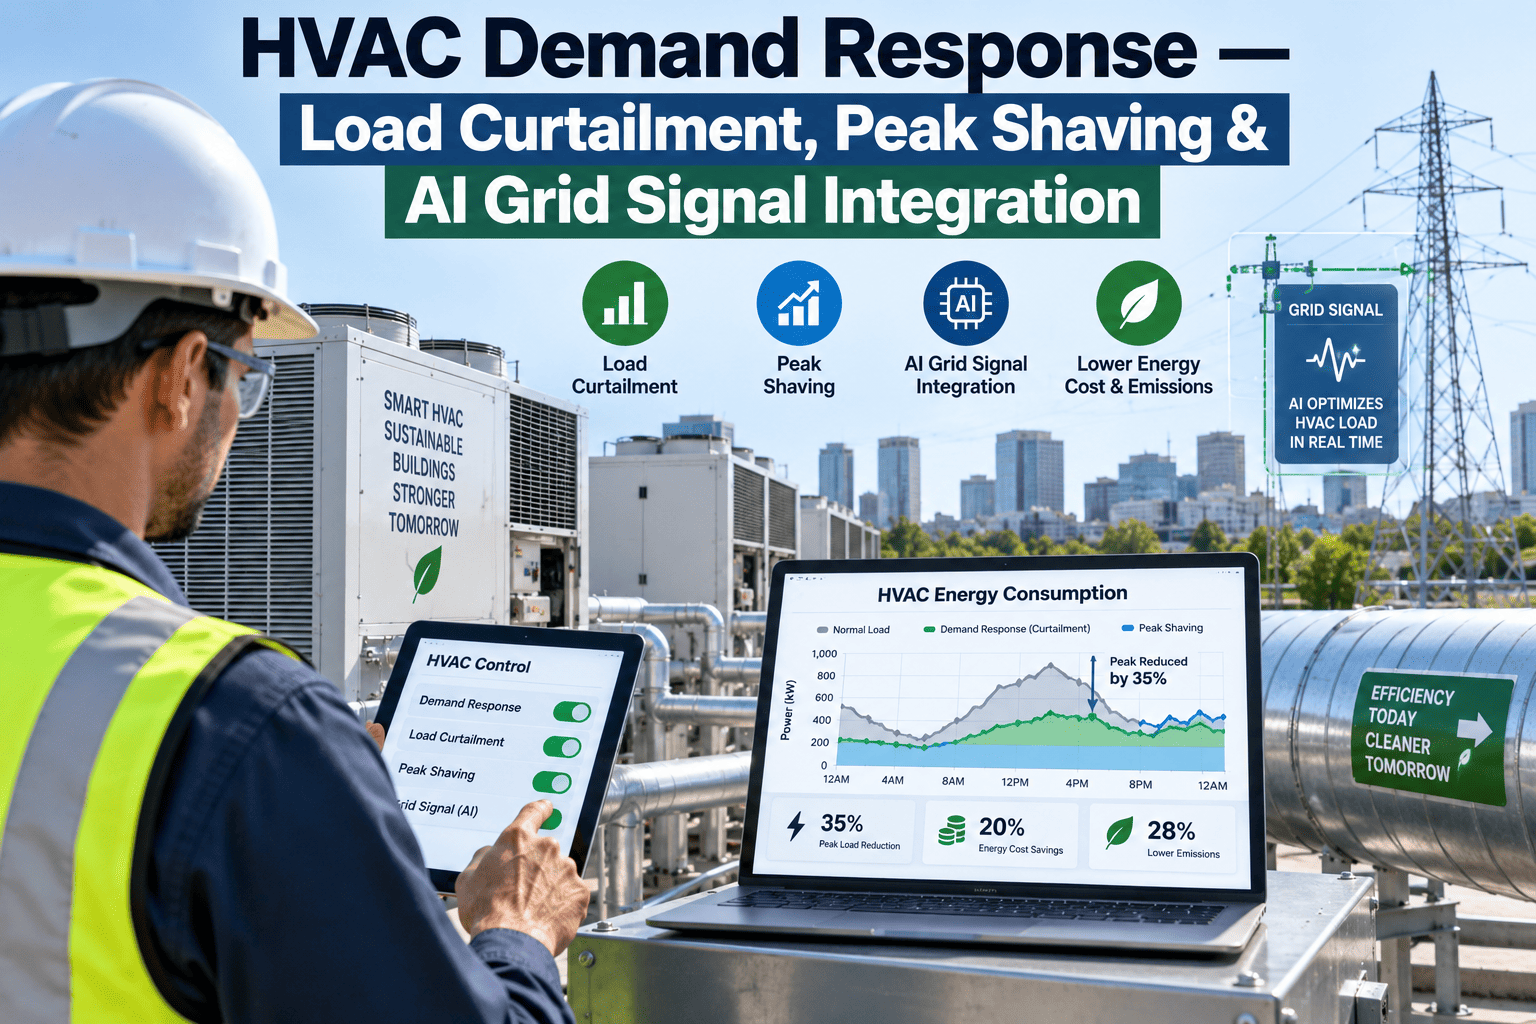
A utility demand response signal gives a plant somewhere between fifteen minutes and a few hours of warning before a peak event starts, and what happens in that window determines whether curtailment actually reduces the demand charge or just makes everyone uncomfortable for no financial benefit. Pre-cooling too late means the building starts the event already working against the load instead of ahead of it. Curtailing the wrong equipment can trip a process interlock instead of trimming a demand peak. Ramping back to normal too fast right after an event can spike demand right back up and erase the savings from the curtailment that just happened. AI-based grid signal integration automates that timing, coordinating pre-cooling, curtailment, and recovery against the actual event schedule instead of a manual response that depends on someone catching the signal in time. See how automated demand response timing changes your utility bill.
The Difference Between a Demand Response Win and a Wasted Event Is Timing
Pre-cooling, curtailment, and recovery each need to happen at the right moment relative to the grid signal. AI coordination automates that timing instead of relying on a manual response.
typical advance notice given before a utility demand response or peak pricing event begins
demand charge reduction achievable through well-timed HVAC curtailment during peak billing periods
the comfort buffer pre-cooling typically needs to build before curtailment can start without triggering complaints
Anatomy of a Demand Response Event
Five stages, each with its own timing window, determine whether an event reduces demand cleanly or creates a rebound spike that erases the savings.
Signal Received
Utility or grid operator sends the event notification, starting the countdown for pre-cooling and curtailment scheduling.
Pre-Cooling Begins
Zone temperatures are driven slightly below normal setpoint, building thermal mass into a buffer the space can coast on during curtailment.
Curtailment Starts
Chiller setpoints reset, fan speeds trim, and non-critical loads shed according to a pre-approved sequence tied to actual comfort tolerance.
Load Shed Monitoring
Zone conditions and demand meter data are tracked continuously to confirm curtailment is holding without tripping a comfort or process threshold.
Gradual Recovery Ramp
Equipment ramps back to normal setpoints gradually rather than all at once, avoiding a rebound demand spike right after the event ends.
Three Curtailment Strategies and When Each One Fits
Not every load should be curtailed the same way. The right mix depends on how much thermal buffer a space has and how sensitive the process behind it is to a temperature or airflow shift.
Pre-Cooling Strategy
Best suited to spaces with meaningful thermal mass, where cooling ahead of the event lets the zone coast through curtailment without an occupant-noticeable temperature swing.
Chiller Reset Strategy
Raising chilled water supply temperature a few degrees during an event trims compressor energy substantially with minimal comfort impact across most building types.
Fan Speed Reduction Strategy
Trimming supply fan speed on VAV systems reduces both fan energy and downstream cooling load, though it requires monitoring to avoid ventilation shortfalls in occupied zones.
Build a Curtailment Sequence That Actually Holds
iFactory reviews your facility's load profile and comfort tolerances to design a curtailment sequence that reduces demand without tripping complaints or process interlocks.
Strategy, Comfort Impact, and Typical Demand Reduction
Each curtailment lever trades off differently between how much demand it actually reduces and how noticeable the change is to occupants or process equipment.
What It Takes to Automate a Demand Response Program
Getting from a manual, occasionally-missed response to a reliably automated one is mostly an integration project, not a hardware overhaul.
Grid signal integration
The building's control system connects directly to the utility's demand response signal or a third-party aggregator feed, removing the dependency on someone manually noticing an email or text alert.
Zone-specific curtailment mapping
Every zone and system gets a pre-approved curtailment sequence and comfort tolerance, so the automated response never has to guess what's safe to trim.
Automated recovery ramping
Post-event recovery follows a gradual ramp schedule rather than an abrupt return to normal setpoints, preventing the rebound spike that undermines an otherwise successful event.
What Changes When Demand Response Is Automated
Figures reflect typical outcomes within the first season after moving from manual demand response participation to automated grid signal integration.
A Process Engineer's View on Automated Demand Response
We used to miss demand response events fairly often simply because whoever was on shift didn't catch the notification in time, and the events we did catch were curtailed manually in a way that occasionally tripped a process alarm we then had to explain. Once the whole sequence was automated against the grid signal directly, we stopped missing events entirely and the curtailment itself became predictable enough that operations stopped worrying about it interfering with production.
The Bottom Line on Demand Response Automation
A demand response program is only as good as its timing, and manual response depends on someone noticing a signal and executing a sequence correctly under time pressure, every single time. AI-based grid signal integration removes that dependency, coordinating pre-cooling, curtailment, and recovery automatically against the actual event schedule. The result is more events captured, deeper demand reduction per event, and none of the comfort disruption that makes a manual program hard to sustain.
Frequently Asked Questions
How much advance notice is typically given before a demand response event?
Notice varies by program and grid operator, ranging from as little as fifteen minutes for fast-response programs to several hours for day-ahead peak pricing events. Automated systems are configured to work within whatever notice window a specific utility program provides, since manual response becomes increasingly unreliable as that window shrinks. Book a review to see how this applies to your utility's specific program.
Will curtailment during an event actually affect production or occupant comfort?
Well-designed curtailment sequences are built around each zone's actual thermal tolerance and each process's actual sensitivity, which is why pre-cooling and gradual chiller resets are used for comfort-sensitive or process-critical spaces while more aggressive curtailment gets reserved for non-critical loads. The goal is demand reduction that occupants and processes don't notice, not comfort sacrifice for its own sake.
What happens if a demand response event runs longer than expected?
Automated systems continuously monitor zone conditions and demand meter data throughout an event, and can extend curtailment intelligently or ease specific loads back if a comfort or process threshold approaches its limit, rather than holding a rigid sequence regardless of how conditions evolve during an extended event.
Does this work with utility incentive and aggregator programs, or only direct utility signals?
Integration typically supports both direct utility demand response signals and third-party aggregator platforms that bundle multiple facilities into a single demand response resource, since the underlying automation need — reliable, well-timed curtailment — is the same regardless of which entity is sending the signal.
How is the recovery ramp designed to avoid a rebound demand spike?
Recovery follows a staggered schedule that brings equipment back online in sequence rather than simultaneously, spreading the return-to-normal demand increase over a longer window instead of concentrating it into a single spike right when the event ends, which is often when grid demand is already elevated from other facilities doing the same thing. Talk to a specialist about tuning this sequence for your facility's specific load profile.
Stop Missing Demand Response Windows
Book a 30-minute assessment. iFactory reviews your facility's load profile and shows exactly what an automated curtailment sequence would look like.