A camera alone tells you a bridge has a crack. A LiDAR scanner alone tells you the bridge has settled three millimetres at midspan. Fusing the two — and running deep learning on the combined data stream — tells you exactly where the crack is, how wide and deep, how much the surrounding plate has lost cross-section, and how the whole structure is moving relative to its design geometry. That fusion is the quiet revolution in bridge structural health monitoring. Modern programmes now mount synchronised LiDAR sensors and high-resolution RGB cameras on UAVs, vehicle rigs, or fixed bridge-end stations, capture co-registered 3D point clouds and 2D imagery in single passes, and run multi-modal neural networks that segment defects at the pixel level while simultaneously quantifying them in millimetres on the point cloud. Published research consistently demonstrates measurable improvements over single-sensor baselines: a point-to-pixel early-fusion approach for steel section-loss detection delivered 15.1% higher IoU than RGB-only, while combined fusion frameworks for viaduct components achieve 94.72% overall segmentation accuracy and BIM reconstruction within 10 mm tolerance. Bridge owners and structural-monitoring engineers that schedule a demo are finding that one combined drone flight now replaces what used to be multiple separate visual, geometric, and ground-survey campaigns. This article walks through how AI-enabled LiDAR + camera fusion actually works on real bridges — the hardware setup, the fusion architecture, the deep-learning models, the realistic accuracy numbers, and the deployment realities every bridge engineering team should plan for.
See Every Crack in 2D. Measure Every Millimetre in 3D.
iFactory fuses synchronised LiDAR point clouds with high-resolution RGB imagery on UAVs and fixed rigs — purpose-built for highway authorities, rail operators, port owners, and structural engineering firms managing ageing bridge portfolios.
1. Why Single-Sensor Bridge Monitoring Is No Longer Enough
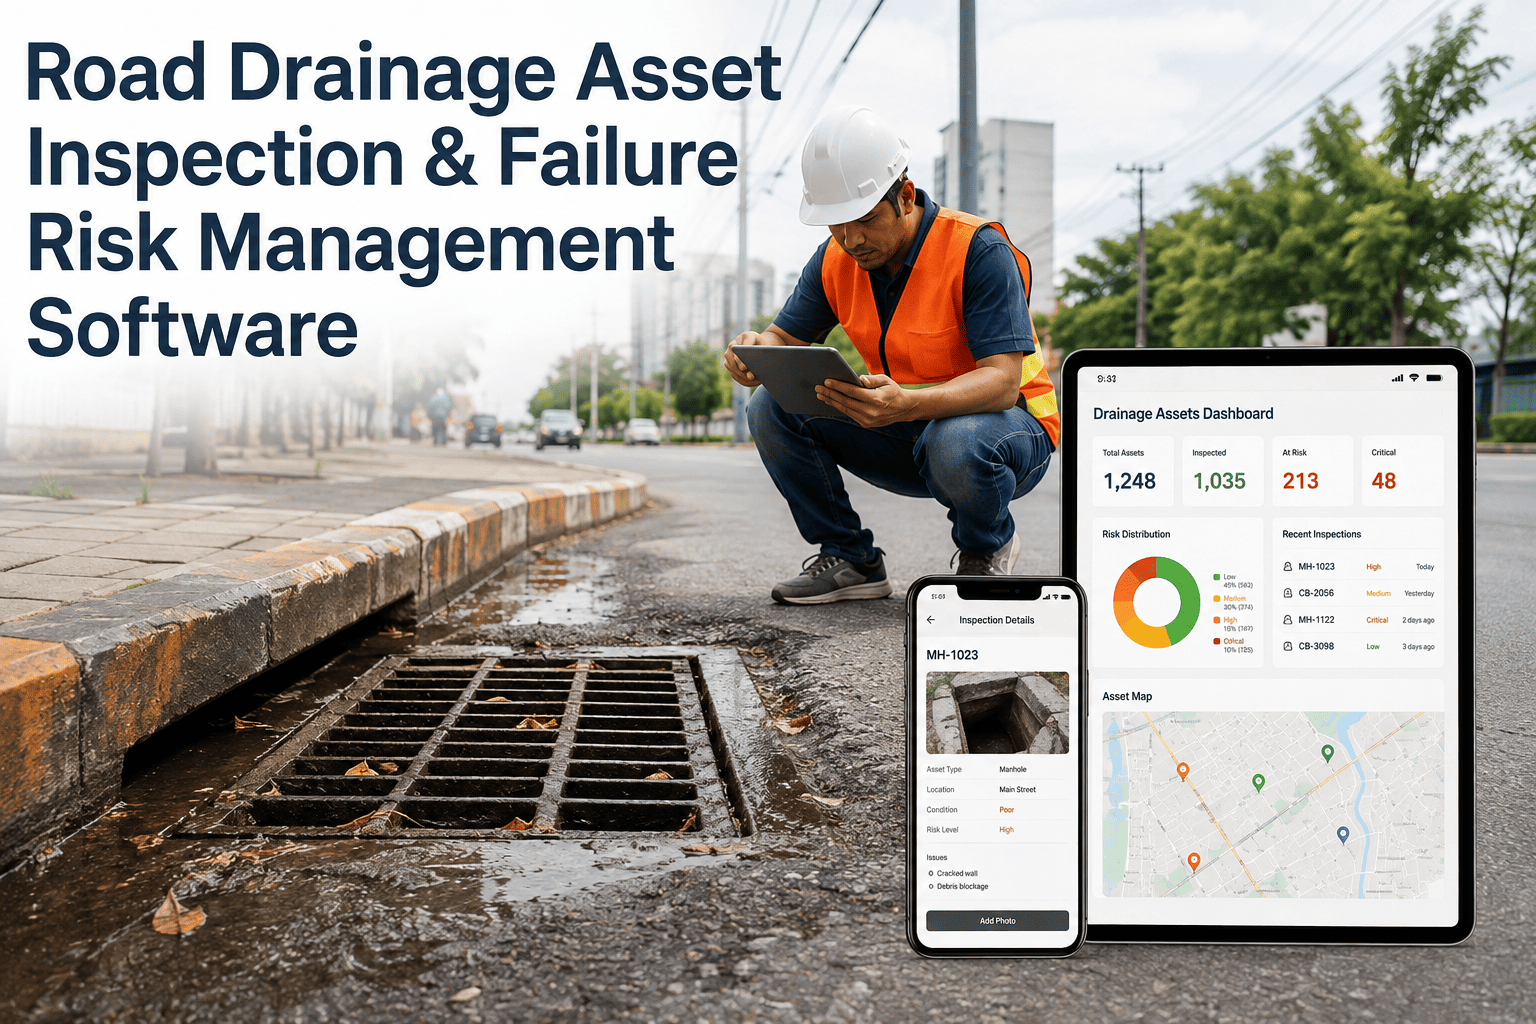
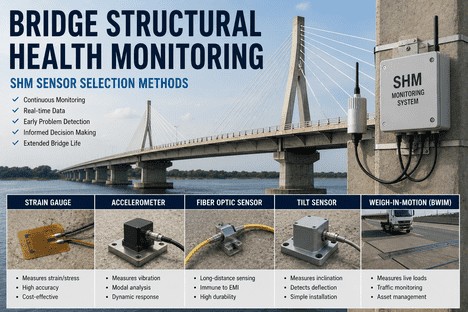
Bridges are inspected three ways and always have been: visual walk-down, geometric survey, and instrumented monitoring. Visual inspection catches cracks, spalls, and coating failure but cannot quantify deformation or section loss. Geometric survey with total stations, GNSS receivers, or terrestrial laser scanning measures displacement with millimetre precision but produces sparse point sampling and tells you nothing about the surface defects driving the movement. Instrumented monitoring with strain gauges and accelerometers tracks dynamic response but only at the discrete locations sensors are installed. Each method covers a blind spot of the others — and bridge engineers have lived with that compromise for decades.
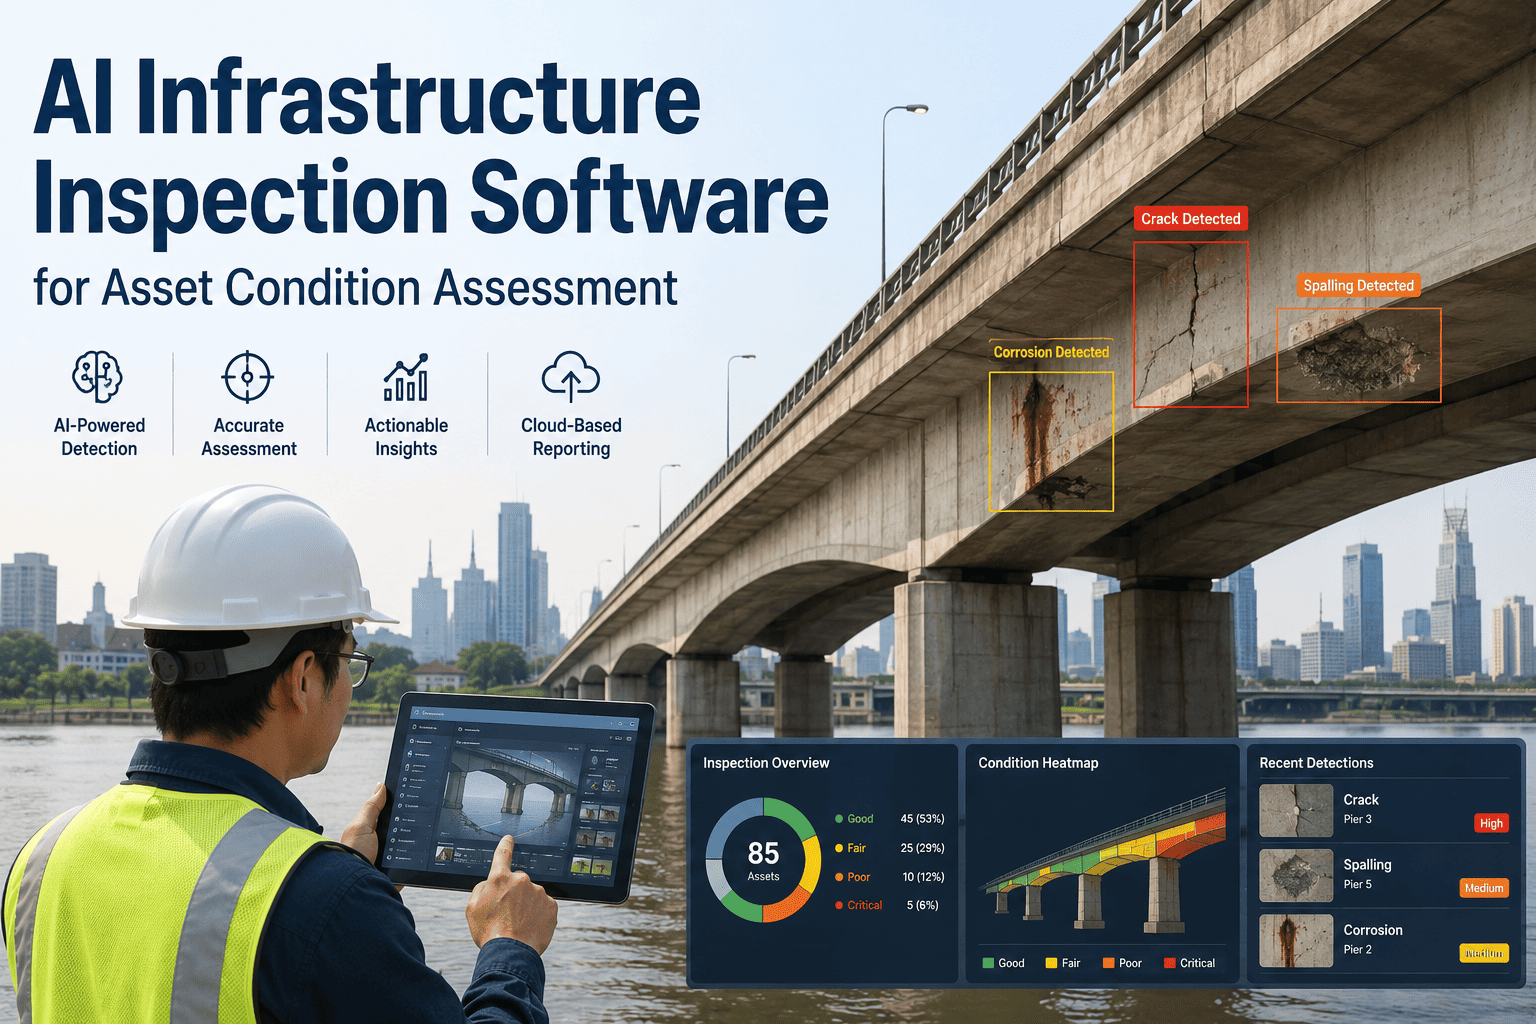
The fusion of LiDAR and camera changes the compromise. A single coordinated capture pass — typically a UAV flight, sometimes a vehicle rig under the bridge — produces a co-registered 3D point cloud and 2D image stack of the entire structure. AI then runs in two directions at once: image-based deep learning detects and classifies surface defects (cracks, spalling, corrosion, coating failure); point-cloud deep learning measures geometry, deformation, and section loss at millimetre resolution. Each modality cross-validates the other — a flagged crack in the image is measured for width and depth on the point cloud, and a deformation hotspot in the point cloud is visually confirmed in the image. Bridge teams that book a demo see this combined output from a single drone flight on their own structures.
2. The Hardware Stack — What's Actually on the Drone or Rig
Production LiDAR + camera fusion runs on a tightly synchronised hardware stack. Each component carries a defined role; the system fails when any one is out of synchronisation with the others.
| Component | Function | Typical Specification | Critical Parameter |
|---|---|---|---|
| LiDAR Scanner | 3D point cloud capture | 500k–2M points/sec, mm-level | Point density & range accuracy |
| High-Resolution RGB Camera | Surface defect imagery | 20–60 MP, sub-mm GSD at 5 m | Resolution & lens calibration |
| IMU (Inertial Measurement Unit) | Platform attitude tracking | 200 Hz update, sub-degree accuracy | Sample rate & drift profile |
| GNSS with RTK Correction | Absolute platform position | Cm-level RTK accuracy | Positional drift over flight |
| Synchronisation Microprocessor | Time-aligns all sensor streams | Sub-millisecond timestamp accuracy | Inter-sensor latency |
| UAV or Fixed Platform | Carries the integrated payload | 4–10 kg payload, 30+ min endurance | Stability under wind load |
3. How the AI Fuses LiDAR Points With Camera Pixels
Fusion can happen at three different levels in the deep-learning pipeline — and the choice matters. Early fusion combines raw LiDAR points with image pixels at the input stage, projecting each 3D point onto the 2D image and feeding the concatenated tensor into a single network. The point-to-pixel early-fusion approach for steel section-loss detection delivered 15.1% higher mean IoU than RGB-only segmentation, with automated damage size and depth estimation. Late fusion runs separate networks on each modality, then merges decisions at the output — easier to train but loses cross-modal context. Hybrid mid-fusion shares features between the two streams at intermediate layers — the current research frontier.
The state-of-the-art workflow combines visual-inertial odometry (VIO) and LiDAR-inertial odometry (LIO) in a multi-sensor fusion mapping pipeline, then applies semantic segmentation jointly to images and point clouds. A reported 2-second total processing time per fused frame (image + 100ms LiDAR integration) gives near-real-time output as the UAV traverses the structure. Image deep learning identifies the defect; point cloud deep learning measures it; the fused output is a defect log with both visual confidence and millimetre-resolution geometry attached. Bridge engineering teams that book a strategy session see the full fusion stack running on their own bridge data in under an hour.
4. From UAV Take-Off to Engineering Report — The Six-Stage Pipeline
Bridge LiDAR + camera fusion runs as a six-stage automated chain. The structural engineer enters only at the report-validation and recommendation step — every prior stage runs autonomously, with the system producing the geometric and visual evidence needed for an engineering judgement.
5. What the Fused System Actually Measures on a Bridge
A single fused LiDAR + camera capture pass on a typical highway or rail bridge produces six distinct categories of structural intelligence — each one previously requiring its own survey campaign. Visual defects are caught and classified from the imagery; geometric measurements are extracted from the point cloud; the two are cross-linked through the calibrated fusion. Multi-temporal differential analysis compares the current scan against earlier baselines, flagging changes the human eye would never see.
6. Realistic Accuracy & Performance Benchmarks
Published structural health monitoring research consistently reports the following ranges. Performance depends heavily on capture geometry, point density, lighting, and the chosen fusion architecture.
| Measurement Task | Approach | Metric | Real-World Range |
|---|---|---|---|
| Steel section-loss segmentation | Point-to-pixel early fusion | IoU vs RGB-only baseline | +15.1% |
| Viaduct component segmentation | 2D–3D fusion + weak supervision | Overall accuracy | 94.72% |
| Multi-class component mIoU | Fused segmentation framework | Mean IoU | 90.51% |
| BIM model vs point cloud | 3D reconstruction tolerance | Geometric agreement | < 10 mm |
| Bridge deformation tracking | Multi-temporal point cloud diff | Vertical precision | 1–3 mm |
| Real-time fused inference | VIO + LIO mapping + segmentation | Per-frame processing | ~ 2 sec |
7. Five Deployment Realities Bridge Teams Hit on Day One
AI LiDAR + Camera Fusion for Bridge Deformation — Frequently Asked Questions
Tap any question to reveal the answer.
Why fuse LiDAR with cameras instead of using either alone?+
How accurate is the deformation measurement, in millimetres?+
What defects and conditions can the fused system catch on a bridge?+
Do we need UAVs, or will fixed platforms work?+
How does this compare to InSAR satellite monitoring or instrumented SHM?+
How does iFactory's fused-monitoring platform integrate with our BIM and EAM?+
Replace Three Survey Campaigns With One Drone Flight.
iFactory orchestrates synchronised LiDAR and camera capture, multi-modal deep learning, and BIM-grade defect reporting into a single periodic bridge intelligence service. Built for engineering teams that need geometric precision without sacrificing visual detail.