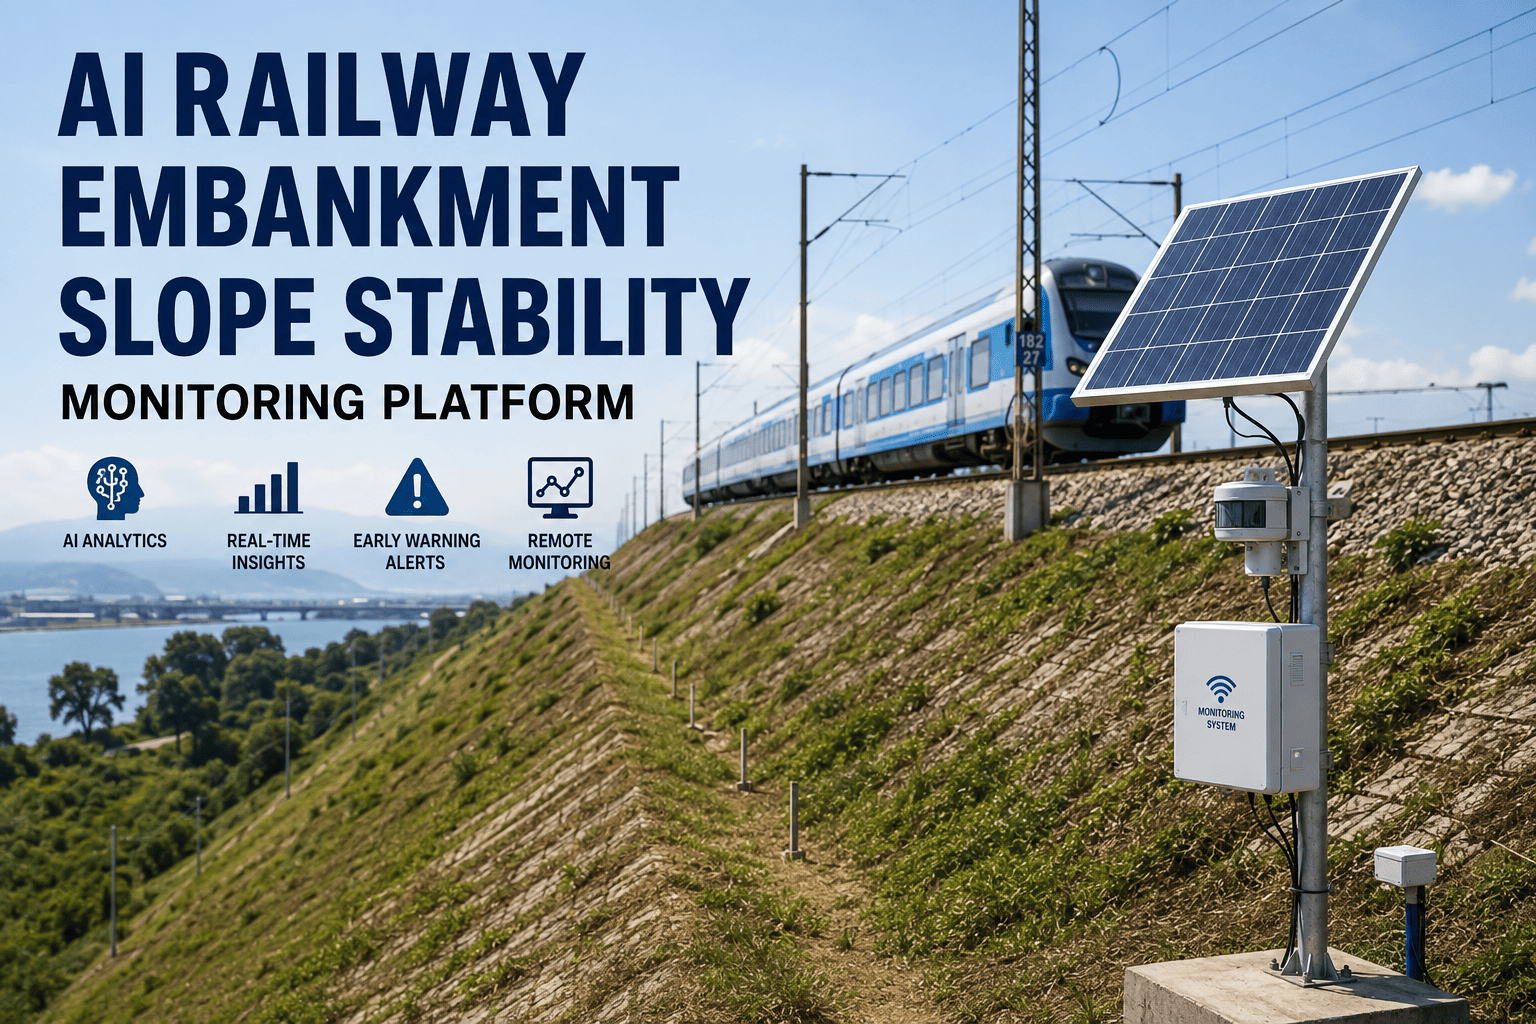
A railway embankment can look completely stable for years and still be moving, a few millimeters at a time, long before that movement ever becomes visible to a track walker or shows up on a routine visual inspection. Slope failures rarely happen without warning; they happen without anyone watching the right signal at the right time, since ground movement, rising pore water pressure, and rainfall saturation all build gradually before a slip surface actually gives way. A single heavy rainfall event on an already-saturated slope can turn weeks of slow creep into a sudden failure within hours, often on a stretch of corridor that sits far from the nearest depot and gets a physical walkover only once every few months. AI-based embankment and slope stability monitoring closes that visibility gap by combining ground sensors, rainfall data, and geospatial inputs into a continuously updated risk model for every monitored section of the corridor. Rail infrastructure and geotechnical teams evaluating what continuous slope monitoring looks like for their own network can start by reaching out to the iFactory support team.
Embankments Move Long Before They Fail. Most Networks Only Find Out After.
iFactory's slope stability platform combines tiltmeters, piezometers, extensometers, and rainfall data into one continuously updated risk model per embankment section, so ground movement gets flagged as a trend, not discovered as a slip.
Why Slope Failure Is the Hardest Geohazard to Catch in Time
Embankments and cuttings do not fail on a predictable schedule, and the terrain that makes a section risky in the first place is often the same terrain that makes it hard to inspect. A handful of structural factors combine to make slope instability one of the most difficult failure modes for a maintenance program to catch early using visual inspection alone.
Every Slope Behaves Differently
Soil composition, groundwater conditions, and slope angle vary section by section, so a movement rate that is normal on one embankment can signal real trouble on another.
Rainfall Is the Trigger, Not the Cause
A slope can weaken gradually over months, but the actual failure is often triggered suddenly by a single rainfall event that pushes an already-saturated slope past its threshold.
The Riskiest Sections Are the Hardest to Reach
Remote cuttings and embankments in difficult terrain often get the least frequent physical inspection, which is the opposite of what their actual risk level calls for.
Visual Inspection Misses Subsurface Movement
A slip surface can be actively developing well below ground level while the surface still looks completely undisturbed to a walking inspector.
Geohazard Indicators and What Each One Reveals
A reliable slope stability program does not rely on a single sensor type. Different indicators reveal different stages of a developing failure, and combining them is what turns isolated readings into an actionable risk model for a specific section.
| Indicator | What It Reveals | Typical Warning Window | Sensor or Data Source |
|---|---|---|---|
| Surface and Subsurface Movement | Creep rate and acceleration toward a slip threshold | 1-4 weeks | Tiltmeters, inclinometers, extensometers |
| Pore Water Pressure | Saturation building inside the slope after rainfall | 3-10 days | Piezometers at multiple depths |
| Rainfall Intensity and Accumulation | Conditions likely to trigger a rapid failure on a weakened slope | Hours to days | Rain gauges, weather data feeds |
| Ground Deformation Patterns | Wide-area settlement or heave trends across a corridor | Weeks to months | Satellite InSAR, periodic survey data |
| Surface Cracking and Vegetation Stress | Visible confirmation of a slip surface already forming | Days | Imagery review, field verification |
From Silent Movement to a Declared Risk Level
A slope rarely jumps straight from stable to failed. Movement typically escalates through recognizable stages, and knowing which stage a section is in determines whether the right response is routine monitoring or an immediate possession.
Movement rate within normal seasonal range for the section, no elevated pore pressure, routine monitoring interval applies.
Movement or pore pressure trending upward beyond the section's own baseline, monitoring frequency increases automatically.
Accelerating displacement or sustained saturation with a predicted threshold date, planned inspection and possible speed restriction assessment triggered.
Movement rate consistent with imminent slip risk, immediate field verification and possession planning recommended without delay.
Stop Discovering Slope Movement After the Slip Has Already Started
iFactory turns tiltmeter, piezometer, and rainfall data into a continuously updated risk score for every monitored section, then pushes an escalating risk level directly to your geotechnical and maintenance teams.
What an Undetected Slope Failure Actually Costs a Railway
An embankment or cutting failure rarely stays contained to a single cost category. The impact spreads across safety, operations, and long-term asset condition at once, and the total is almost always larger than the direct repair bill suggests.
Derailment and Safety Exposure
A slope failure under or beside an active line is one of the more severe safety risks a railway manages, with consequences that scale quickly once movement becomes visible.
Emergency Line Closure
An unplanned closure to stabilize a failed slope disrupts the wider timetable and often requires costly diversions or replacement transport for passengers and freight.
Reconstruction and Stabilization Cost
Rebuilding a failed embankment or stabilizing a slipped cutting slope is a major capital expense compared with the cost of a planned monitoring and reinforcement program.
Regulatory and Reputational Impact
A geotechnical failure affecting an operating railway typically triggers formal investigation and reporting obligations, adding further cost and scrutiny beyond the physical repair.
How a Risk Signal Becomes a Scheduled Response
A rising risk score only protects a corridor if it reaches the right team in time to act on it. The platform is built to move a detected trend into a planned response automatically, rather than leaving it sitting in a report.
Continuous Multi-Sensor Ingestion
Tiltmeter, piezometer, extensometer, and rainfall data stream in continuously from every instrumented section of the corridor.
Section-Specific Behavior Baseline
The model learns each section's own normal movement range based on its soil type, geometry, and seasonal rainfall history, rather than one fixed threshold for the network.
Trend and Trigger Detection
Live readings are compared continuously against the baseline, surfacing accelerating movement or rising saturation well before a fixed alarm threshold would fire.
Risk Level Escalation
The model assigns a specific risk level and predicted threshold window to the section, escalating automatically as conditions change.
Automatic Alert and Work Order Routing
An elevated or critical risk level is routed directly to geotechnical and maintenance teams as an alert and, where appropriate, a scheduled inspection or work order.
A Composite Scenario: The Embankment That Held Through Monsoon
A regional rail network had a history of minor slope creep on an aging embankment section, with movement that had previously only been confirmed through periodic manual survey every few months. After the network installed tiltmeters and piezometers on the section and connected them to a continuous risk model, the system flagged an acceleration in movement rate paired with rising pore pressure eleven days ahead of the predicted threshold.
The geotechnical team scheduled a targeted drainage improvement and toe reinforcement during a planned possession, confirmed the movement rate had returned to baseline within two weeks of the work, and avoided what modeling suggested would otherwise have been a likely slip during the upcoming monsoon peak. The section has remained in the stable risk tier through two subsequent monsoon seasons since the reinforcement was completed.
The network has since extended tiltmeter and piezometer coverage to four additional sections identified through the same risk-scoring approach, prioritizing embankments and cuttings with the highest combination of consequence and prior movement history.
Common Mistakes Railways Make With Slope Stability
Relying on Fixed-Interval Manual Surveys Alone
A survey every few months tells you where a slope was on the day of the visit, not how quickly it is moving between visits, which is exactly the information a risk model needs.
Monitoring Movement Without Monitoring Rainfall
Displacement data alone misses the saturation buildup that often determines whether a slow-moving slope is about to accelerate into failure.
Applying One Threshold Across an Entire Network
A movement rate that is alarming on a shallow embankment can be entirely normal on a different soil type, so fixed network-wide thresholds either miss real risk or generate false alarms.
Deprioritizing Remote or Low-Traffic Sections
A slope failure on a lower-traffic line still closes the corridor and carries the same safety exposure, even if it gets less attention during routine planning.
Is Your Corridor Ready for Slope Stability Monitoring
You can name the sections with a history of movement
If your geotechnical and permanent way teams already track which embankments and cuttings have shown prior creep or survey discrepancies, that list is the right starting scope.
You have access to rainfall and prior survey data
Historical rainfall records and past inspection or survey results accelerate baseline modeling significantly, even though a program can also start from newly installed sensors alone.
Your teams can act on an automated risk alert
An escalating risk level only protects a corridor if a geotechnical or maintenance team has a defined process for responding to it quickly.
Leadership supports proactive reinforcement work
A predictive slope program pays off fastest when a network is willing to fund a planned drainage fix or reinforcement job off an early warning rather than waiting for visible movement.
Frequently Asked Questions
How is this different from periodic manual geotechnical surveys?
A manual survey provides an accurate snapshot of a section's condition on the day it is taken, but it says nothing about how the slope behaves in the weeks between visits, which is exactly when acceleration toward failure typically develops. Continuous sensor monitoring fills that gap by tracking movement, pore pressure, and rainfall response between survey cycles, and the two approaches work best together rather than as a replacement for one another. Teams can see how this combination applies to their own corridor by contacting iFactory support.
What sensors are typically installed on a monitored embankment or cutting?
Most deployments combine tiltmeters or inclinometers for surface and subsurface movement, piezometers to track pore water pressure at multiple depths, extensometers for crack or joint displacement, and rain gauges or weather data feeds to capture the rainfall conditions that typically trigger acceleration. Satellite InSAR data can supplement ground sensors for wide-area deformation trends across a corridor. The exact combination depends on the specific geohazard risks identified for each section.
How much advance warning does the model typically provide?
Warning windows vary by indicator and failure pattern, ranging from roughly one to four weeks for gradually accelerating movement down to just hours or days once rainfall intensity pushes an already-saturated slope toward a rapid trigger event. The model assigns a specific predicted threshold window per section rather than a single fixed number, since the exact lead time depends on soil conditions, prior movement history, and current weather.
Can this scale across a large network with many at-risk sections?
Yes, the platform tracks every instrumented section individually and is built to scale from a handful of priority embankments up to a full corridor-wide geotechnical monitoring program. Most networks begin with the sections carrying the highest combination of consequence and prior movement history, then expand coverage as the model proves out on that initial scope. Book a demo to see how a phased rollout is typically sequenced for a network your size.
Does an elevated risk alert automatically trigger a speed restriction?
No, the platform assigns and escalates a risk level based on sensor and weather data, but the decision to impose a speed restriction, schedule an inspection, or plan a possession remains with your geotechnical and operations teams. The value of the alert is giving those teams the earliest possible signal and the supporting data trend, so any operational decision is made proactively rather than reactively after a visible movement or failure has already occurred.
Give Every Embankment and Cutting the Early Warning It Needs
iFactory builds slope stability risk models around your corridor's specific sections, turning live movement, pressure, and rainfall data into early warnings before a slip ever reaches the track.