The flotation operator walks the bank at the start of the shift. Froth looks normal — bubble size consistent, colour within range, launder action stable. The shift report from the previous crew shows nothing unusual. Two hours later, the lab result comes back: concentrate grade dropped 1.8% in the last rougher cell. No one saw it happen. The froth appearance changed gradually — a slight darkening, a minor bubble coalescence shift — nothing that would trigger an alert during a periodic walk-by. But the cumulative effect across four cells over ninety minutes pushed the circuit into a sub-optimal state that will take another three hours to correct. This is the defining productivity leak in mining flotation operations: not the dramatic cell failure or the reagent pump outage, but the slow, optically invisible drift in froth characteristics that manual inspection intervals cannot catch, and that laboratory assay delays confirm too late to prevent lost recovery. AI vision inspection for mining flotation changes this.
In-Process Froth Vision · Self-Tuning SPC · Operator Alerting · Recovery Traceability
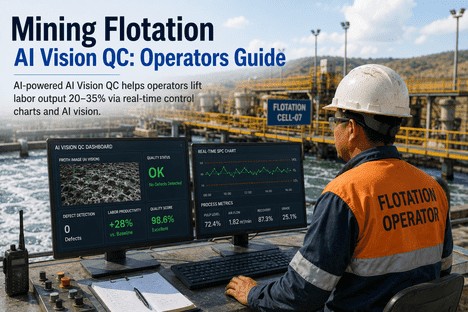
Every Froth Condition the Operator Misses Between Walk-Bys Becomes Lost Recovery. AI Vision Stops It at the Cell.
iFactory's AI vision inspection platform monitors froth characteristics, reagent response, and cell condition in real time — with self-tuning SPC limits, operator-grade control charts, and shift-to-shift traceability built into every production record.
What Manual Inspection Costs in a Flotation Circuit — and How AI Vision Recovers It
Manual Froth Walk-By
Operator inspects froth surface once or twice per shift. Visual assessment is subjective — depends on lighting, operator experience, and fatigue level. Reagent adjustments based on estimate, not measurement. Condition changes between walk-bys go undetected. Average detection lag: 45 to 120 minutes from onset of drift.
Recovery impact: 1.5–3.5% grade loss per undetected drift event, compounding across cells
AI Vision Continuous Monitoring
Camera captures froth surface at 10–30 second intervals. AI model classifies bubble size distribution, froth velocity, stability, and colour. Real-time trend line updates on operator dashboard. Alert fires when any parameter deviates from SPC control limits. Detection lag: under 60 seconds from onset of drift.
Recovery impact: Drift corrected within 3–5 minutes, grade variability reduced 40–60%
Labor Productivity Per Operator
Operator spends 35–50% of shift time on manual cell checks, sample collection, and froth assessment. Multiple cells mean each check is compressed. High-value diagnostic time competes with rounds-based inspection obligations.
Effective diagnostic time: 15–20% of shift
Labor Productivity With AI Vision
Operator views all cells from a single dashboard. AI prioritises cells needing attention. Manual rounds reduced to exception-based interventions. Operator time redirected to process optimisation, reagent tuning, and downstream coordination.
Effective diagnostic time: 50–65% of shift — 20–35% labour productivity gain
20–35%
Operator labour productivity gain when AI vision replaces manual froth walk-bys with real-time dashboard monitoring and exception-based intervention
60 sec
Maximum detection lag from froth condition onset to operator alert, versus 45–120 minute lag with periodic manual cell inspection rounds
40–60%
Reduction in concentrate grade variability when AI vision trend data drives real-time reagent and air adjustment decisions at the cell
95%+
Froth condition change detection accuracy versus 55–70% for manual visual assessment across multiple shifts and operator experience levels
Why Manual Froth Inspection Cannot Keep Pace With Flotation Dynamics
Flotation circuits respond to changes in feed mineralogy, particle size distribution, reagent effectiveness, and aeration conditions on a timescale of minutes. The operator who inspects a cell at 08:00 and returns at 10:00 has missed fifteen to twenty condition transitions — any one of which could shift the cell from optimal recovery to a sub-optimal state that propagates through the entire rougher-scavenger-cleaner train. Manual froth assessment is inherently subjective: two experienced operators standing at the same cell will describe the same froth differently, and the same operator will assess the same froth differently under morning light versus afternoon light. This variability is not a training gap — it is a fundamental limitation of human visual inspection for detecting gradual, multi-variable changes in a dynamic surface that does not produce sharp threshold events when it drifts.
The Six Froth Parameters That AI Vision Measures — and What Each One Tells the Operator
Bubble Size Distribution
Mean bubble diameter and distribution width correlate directly with recovery rate. Coarsening bubbles indicate reduced retention time. AI tracks distribution per cell across the bank.
Operator action: Adjust frother dosage or air rate when distribution shifts outside control limits
Froth Velocity and Transport Rate
Froth flow velocity across the launder determines mass pull. Velocity drop signals froth mobility issues — either reagent imbalance or solids loading changes. AI measures optical flow per cell second-by-second.
Operator action: Investigate reagent regime or solids feed rate when froth velocity trend deviates
Froth Colour and Reflectance
Colour shifts indicate changing mineral content or oxidation state. Darkening froth often signals increasing gangue content or decreasing valuable mineral loading. AI quantifies colour across the froth surface, removing lighting dependency.
Operator action: Correlate colour shift with feed grade change; adjust collector addition if needed
Froth Stability and Bubble Half-Life
Bursting rate and froth persistence indicate surface chemistry conditions. Over-stable froth may carry entrained gangue. Under-stable froth collapses before collection. AI analyses burst frequency and stability index continuously.
Operator action: Adjust frother concentration or modify pulp level setpoint to optimise froth residence
Launder Froth Depth
Froth depth at the launder overflow determines whether mineral-laden froth is collected or lost. Shallow froth reduces recovery. AI measures froth depth profile at multiple launder points.
Operator action: Adjust pulp level setpoint to maintain target froth depth across all cells
Bubble Loading Estimation
Ratio of valuable mineral to gangue on bubble surfaces estimated from optical texture analysis. Declining loading indicates selectivity loss before grade assays confirm it.
Operator action: Review reagent selectivity balance; adjust depressant or collector ratio
How Self-Tuning SPC Changes the Flotation Operator's Decision Model
Conventional SPC in mineral processing uses static control limits defined during circuit commissioning or capability studies. These limits represent process variation at a single point in time. As feed ore type changes, reagent batches vary, and seasonal water chemistry shifts, the real process variation changes. Static limits become too narrow for the current ore type — generating nuisance alarms that desensitise operators — or too wide for a favourable feed blend — missing drift until it has already affected recovery. Self-tuning SPC eliminates this by recalculating limits dynamically against the current process baseline, distinguishing common-cause variation from events that require operator action, and logging every limit adjustment for metallurgical review.
Flotation Condition
Static SPC Behaviour
Self-Tuning SPC Behaviour
Feed Ore Type Change
Static limits trigger false alarms on every ore type transition — operator desensitised to alerts, misses real froth drift
Limits adjust to new ore type baseline within 15–25 parts — real drift still detected, nuisance alerts below 5%
Reagent Dosage Drift
Bubble size shifts gradually over 4–6 hours — SPC limits too wide to detect trend, operator relies on periodic lab assay
Self-tuning limit detects bubble size trend against current baseline — alert fires 60–90 minutes before grade impact confirmed by lab
Seasonal Water Chemistry Shift
Static limits drift further from actual process with each seasonal water change — operator works outside documented SPC range
SPC limits track water quality-driven baseline changes — operator inside valid limits year-round with documented adjustments
Metallurgical Audit
Static limit justification requires re-validation when ore body or circuit changes — documentation burden for metallurgist
Self-tuning logic recorded with timestamped limit change events — each adjustment traceable to froth data that drove it
What the Operator Dashboard Shows — and When It Alerts
The operator dashboard is built around a single principle: the operator should never discover a froth condition change from a lab result that describes what happened two hours ago. Every alert fires on current froth data — trend-based, not threshold-based — giving the operator actionable information before recovery impact accumulates.
Dashboard Panel 01
Live Cell Froth Status — All Cells at Once
Every flotation cell displays a live condition status: green (stable froth within SPC limits), amber (parameter trending toward control limit), or red (limit breach requiring immediate attention). The operator sees the entire flotation bank on one screen — not sequential cell checks, but a simultaneous view with priority ranking for intervention. The froth image from the alerting cell is displayed alongside the trend chart, so the operator confirms the condition visually before taking action.
Operator action: Amber — review trend and froth image. Red — adjust reagent or air; log intervention in system.
Dashboard Panel 02
Reagent Response Trend — Before the Lab Confirms
When the operator adjusts collector, frother, or depressant dosage, the dashboard shows the froth response in near real time — bubble size distribution shift, froth velocity change, colour response. The operator validates that the reagent change produced the expected effect within seconds, not hours. This closes the feedback loop that manual lab assays cannot provide at the frequency flotation circuits need for responsive control.
Operator action: Confirm reagent effect within 2–5 minutes of dosage change; re-dose or hold based on froth response.
Dashboard Panel 03
Shift Performance Summary — Grade and Recovery Track
Running concentrate grade estimate and recovery trend updated from AI froth metrics correlated with periodic lab assays. The operator sees whether the shift is on track for production targets without waiting for end-of-shift assay compilation. If the trend diverges from target, the dashboard shows which cell or condition is driving the deviation.
Operator action: Compare shift trend against target; prioritise intervention at highest-impact cell.
Dashboard Panel 04
Operator Intervention Log — Traceable Shift Decisions
Every froth parameter adjustment, reagent change, or air rate modification is logged with a timestamp, cell identifier, before-and-after froth image, and operator ID. The shift handover includes the complete intervention history — eliminating the information loss that occurs when one operator verbally summarises four hours of cell behaviour to the incoming crew. The log is also the documented process record that metallurgical reviews require.
Operator action: Review intervention history at shift handover — no information loss between crews.
"
We run six rougher cells across two flotation lines. Before AI vision, each operator spent about three hours per shift walking cells, estimating bubble size by eye, and waiting for lab assays to confirm what they suspected. That left maybe an hour for actual process tuning. Now the dashboard shows me all six cells at once. I saw a bubble size shift in cell three within thirty seconds of it starting — caught a frother feeder issue that would have cost us two hours of off-grade concentrate under the old system. My labour time on froth assessment dropped by half, and my time on actual optimisation doubled.
— Senior Flotation Operator, Copper Concentrator Operation, South America
Deploying AI Vision on a Flotation Circuit: What the First 90 Days Looks Like
Deployment is structured so the operator team builds confidence in the AI froth assessment through observed accuracy in parallel with existing methods — not through a process change imposed before the system has demonstrated reliability on your specific ore types and cell configuration.
Camera Installation and Froth Baseline Collection
Cameras mounted above flotation cells with lighting configured for consistent froth imaging across day and night operation. AI model pre-trained on general flotation froth characteristics and initialised on site-specific froth images. No production interruption. Operator team briefed on system purpose and parallel-run validation plan.
Shadow Mode Validation
AI froth assessment runs in parallel with existing operator walk-bys and lab assays. Every AI froth parameter reading compared against operator visual assessment and lab grade data. False positive and false negative rates documented. Operator team reviews froth image alerts daily and provides feedback on edge cases. Model retrained on site-specific froth appearances.
Live Dashboard Activation
AI dashboard becomes the operator's primary froth monitoring view. Self-tuning SPC activated on validated froth parameters. Alert thresholds set based on shadow mode performance data. Operator intervention logging activated. Shift handover reports begin including AI froth trend summary.
Optimisation and Correlation Refinement
Froth parameter correlation models refined with 60 days of accumulated data. Tool wear and reagent response patterns identified from trend history. Operator feedback integrated into alert priority logic. Metallurgical team reviews AI froth data — lab assay frequency candidate for reduction on stable froth parameters.
Conclusion
Flotation circuit quality losses are not caused by inattentive operators. They are caused by an inspection model — periodic manual froth walk-bys and delayed laboratory assays — that was never designed to detect the gradual, multi-variable condition shifts that actually drive recovery loss. No operator can economically monitor froth characteristics on every cell at the frequency and consistency that flotation dynamics demand, across multiple shift changes, ore type transitions, and reagent batch variations. AI vision does, with continuous froth measurement on every cell, real-time alerting on every parameter shift, and a complete intervention log that makes every operational decision traceable from detection to outcome.
For the flotation operator, the change is specific: instead of spending the majority of the shift walking cells and waiting for assays, the dashboard shows which cell is trending out of control right now, which froth parameter is driving the deviation, and what the froth response was to the last reagent adjustment. The self-tuning SPC alert arrives while the condition is still reversible — not when the lab assay confirms lost recovery that cannot be recovered. The intervention log eliminates the information gap between shifts. And the operator's time shifts from reactive rounds-based inspection to proactive process optimisation — the work that actually improves metallurgical performance.
iFactory's AI vision inspection platform is built for flotation operators who need to see froth condition changes when they happen, not when the lab result arrives. Book a Demo to see the system operating on a flotation circuit configuration matched to your cell layout and ore types, or talk to an expert about configuring AI vision for your specific flotation bank, froth parameter priorities, and metallurgical reporting requirements.
Frequently Asked Questions
The Froth Condition That Causes the Recovery Loss Is Already Visible in Your Cells. AI Vision Finds It Before the Lab Does.
iFactory's AI vision platform monitors 100% of flotation cells continuously for bubble size, froth velocity, stability, colour, and launder depth — with self-tuning SPC alerts, reagent response tracking, and operator-grade dashboards that give every shift the same consistent froth visibility.