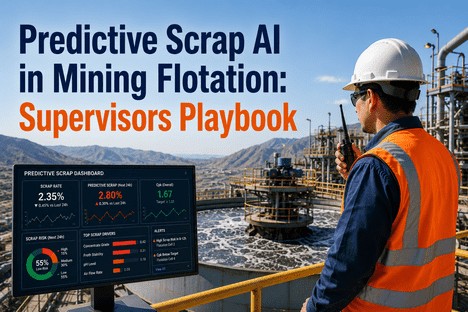
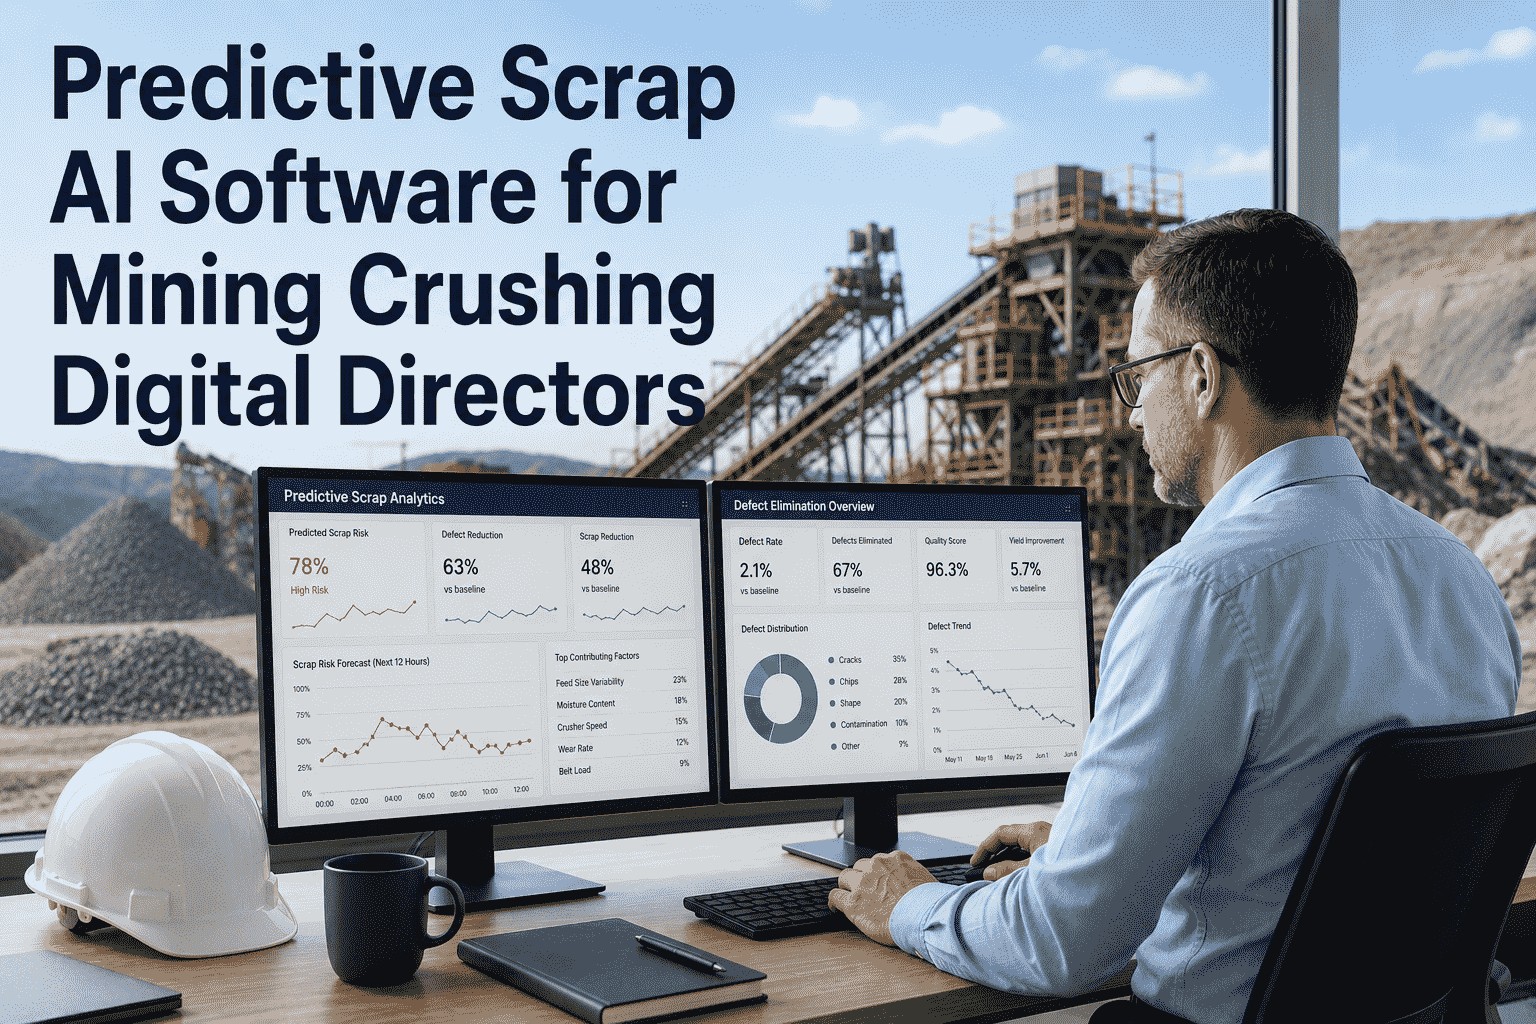
Predictive Scrap AI – Mining Crushing for Plant Execs
By Grace on June 8, 2026
The plant executive on the mining crushing circuit sees the daily report at shift handover. 91% first-pass yield. Acceptable. But the deeper number is the one that does not show up on the dashboard: 17 hours per week of manual sampling and lab analysis that catch off-spec material only after it has already been crushed. Two hundred tons scrapped last month, both traced to parameter drift that a predictive analytics model with machine learning would have flagged 90 minutes before the first off-spec particle reached the screen deck. The executives who close the gap between scrap occurrence and scrap detection are the ones who consistently deliver first-pass yield above 95% and hold it through feed changes, liner wear cycles, and production rate increases. This guide shows mining crushing plant executives how predictive scrap analytics for mining crushing replaces reactive lab-based quality control with real-time machine learning scrap forecasting, what it means for plant-level OEE, and how to deploy it on the crushing circuit without disrupting production.
Your Lab Results Are Confirming Scrap After It Has Already Been Produced. Predictive Analytics Forecasts It Before It Happens.
Machine learning models trained on crusher parameters, feed characteristics, and historical quality outcomes deliver real-time scrap risk forecasts at sub-minute latency — before off-spec material reaches the screen deck, not after.
The Scrap Gap: Why Manual Sampling Costs More Than Lab Technician Time
Manual sampling and lab analysis in mining crushing consumes between 30% and 50% of quality control resources according to industry studies. That is time the crushing circuit is producing material that may or may not meet specification. But the larger cost is not the sampling labour — it is the latency between scrap occurrence and scrap detection. A closed-side setting drift that begins at 09:00 is typically not detected until the 10:30 lab result, which means 60 to 90 minutes of material may have been produced outside specification. Every ton of that material must be reclassified, rehandled, or sent to the waste stockpile.
Predictive scrap analytics eliminates this latency by placing detection at the point of production. Sensor data from the crusher — power draw, closed-side setting, feed rate, liner wear, vibration, and bearing temperature — is streamed continuously to machine learning models that have been trained on 12 to 24 months of historical operating data correlated with quality outcomes. These models identify the parameter combinations that historically precede off-spec events and forecast scrap risk 30, 60, and 90 minutes into the future. The plant executive sees the scrap risk alert on the dashboard at the same moment the control room receives the recommendation. Correction can begin before the first off-spec ton is produced.
30-50%
Of crushing quality control resources consumed by manual sampling and lab analysis — representing the single largest opportunity for scrap reduction through predictive analytics automation
93%+
Scrap event prediction accuracy achieved by machine learning models trained on crushing circuit process data, outperforming periodic lab sampling at detecting off-spec conditions
90 min
Average advance warning of scrap risk for production-deployed predictive models — detection at forecast speed, not lab sampling speed
How Predictive Scrap Analytics Works on the Crushing Circuit
Predictive scrap analytics replaces the end-of-shift scrap review with continuous in-process risk forecasting. The system architecture follows a four-stage pipeline that runs at production speed, processing each minute of crusher data and delivering a scrap risk verdict before the next 30-minute production window elapses.
01 Capture
Crusher sensors and PLC systems stream power draw, closed-side setting, feed rate, liner wear, vibration, and bearing temperature data at sub-minute intervals. Material moisture and hardness data from feed analysers are ingested continuously.
02 Process
Edge-processing or server-based machine learning models — gradient-boosted trees and LSTM networks — analyse the data stream and correlate current process parameters with historical patterns that preceded scrap events. Inference completes in under five seconds per forecast cycle.
03 Forecast
Scrap risk score, parameter drift details, and forecast horizon are computed. Risk is classified as low, medium, high, or critical — colour-coded for executive triage. The specific parameter combination driving the risk is identified.
04 Alert
Alert routed to plant executive dashboard and control room. System displays recommended parameter adjustment — CSS change, feed rate modulation, or liner change scheduling — depending on risk severity and plant operating rules.
Scrap Risk Types Predictive Analytics Detects in Mining Crushing
A production-grade predictive scrap analytics system for mining crushing detects the full spectrum of off-spec conditions that affect product quality and plant margin. The detection capability extends to risk types that periodic lab sampling routinely misses under production pressure — particularly gradual parameter drift, feed material transitions, and liner wear progression that unfolds over hours or shifts.
Risk Type
Detection Method
Accuracy
Impact on Yield
Closed-side setting drift
Time-series ML + sensor fusion
95%
Oversize and fines generation
Feed moisture variation
Feed analyser + ML correlation
93%
Screen blinding, throughput loss
Liner wear trajectory
Power draw trend + ML
96%
Particle size distribution shift
Feed hardness change
Vibration + power draw analysis
94%
Throughput reduction, energy waste
Tramp metal ingress
Metal detector + ML anomaly
97%
Crusher damage, contaminant scrap
Screen deck degradation
Vibration signature + ML
92%
Off-spec particle size, re-crush
Before we deployed predictive scrap analytics on the crushing circuit, our quality team was doing 90-minute sampling cycles for every shift. That is six samples per day, with results arriving after the material had already been processed. The predictive model now forecasts scrap risk every minute — 90 minutes ahead of the lab result. We recovered the detection time as prevention time. The first-pass yield impact was a 6-point improvement in the first two months, driven entirely by catching CSS drift and feed moisture changes at the parameter level instead of finding them at the product pile. Our plant executives went from reviewing scrap reports to preventing scrap events. That changes how you manage a crushing circuit.
— Plant Manager, Base Metals Crushing Operation
What Predictive Scrap Analytics Changes for the Plant Executive
The plant executive's role in crushing operations is caught between production targets and quality outcomes. Every ton that leaves the circuit consumes energy, screen capacity, and conveying time. The executive who approves the shift report needs to know the quality state of that production at that moment — not what it was at the last lab sampling. Predictive scrap analytics delivers a per-shift quality summary at handover that includes every scrap risk event detected, its severity, its root cause parameter drift, and the corrective action applied. The executive sees a green, amber, or red status for each crusher and can approve the shift report with confidence or flag for corrective action with specific parameter data — eliminating the need to wait for the next lab result to understand quality status.
Real-Time Scrap Risk Dashboard
Per-crusher and circuit-level scrap risk map updated every minute. Plant executives see risk type, severity colour code, and specific parameter drift on a visual layout of the crushing circuit — no need to interpret raw sensor data or wait for lab results.
Shift-Level OEE Quality Factor
The Quality factor of OEE updates with every forecast cycle, not at handover. Plant executives correlate scrap risk trends with feed source changes, liner age, and maintenance windows to identify the root cause of quality drift during the shift, not after.
Shift Report Quality Summary
One-page quality summary per shift — all scrap risk events detected, severities, parameter drifts, and corrective actions applied. Executives approve shift reports from the dashboard without waiting for lab results to confirm quality status.
Cross-Shift Trend Alerts
When the same risk type appears at the same parameter threshold across consecutive shifts, the system alerts the executive to a systematic process issue — liner wear progression, feed material blend change, or control strategy drift — before the pattern generates a major scrap event.
Before Predictive Scrap Analytics vs After: The Circuit-Level Impact
The table below compares key operational metrics across two identical crushing circuits — one running conventional lab-based quality control, one running predictive scrap analytics. The data is drawn from published mining production studies and iFactory deployment benchmarks.
Your Crushing Circuit Spends Half Its Quality Resources Confirming Scrap After It Is Already Produced. That Is a Margin Problem, Not a Lab Problem.
iFactory predictive scrap analytics integrates with your existing crusher sensors and control systems to forecast scrap risk in real time — recovering detection time as prevention time while improving first-pass yield by 5-8 points. See it running on your circuit data.
Practical Deployment: What Plant Executives Need to Know
Deploying predictive scrap analytics on a crushing circuit does not require replacing the crusher controller or adding expensive hardware. The analytics platform connects to existing crusher sensors and PLC systems via standard industrial protocols. The machine learning model is trained on the specific scrap risk types relevant to the operation — CSS drift, feed moisture, liner wear, tramp metal, feed hardness — and deployed on a server or edge device that processes data locally. No cloud dependency, no process data leaving the facility. Integration with the control system enables the platform to correlate parameter drift with quality outcomes, building a process-quality correlation database that improves model accuracy over time.
Connectivity Integration Is Minimal
The analytics platform connects to crusher PLCs via OPC-UA, Modbus TCP, or MQTT — no controller replacement required. Sensor data already collected for control purposes is repurposed for predictive modelling. No additional hardware procurement.
Model Training Uses Your Process Data
The machine learning model is initialised on a general mineral processing dataset and fine-tuned on your operation-specific data (12-24 months of crusher parameters and quality outcomes). Synthetic data generation supplements rare risk modes. Model retraining is a scheduled maintenance activity, not a project.
Operator Workflow Does Not Change
Operators continue managing the crusher from the control room. The AI system runs in the background, surfacing only actionable alerts with specific parameter recommendations. No additional steps added to the operator cycle. Executive dashboard provides a per-shift quality summary without waiting for lab results.
Compliance Reporting Is Automatic
Every scrap risk event is logged with parameter drift, risk type, severity, and timestamp. The quality record for each shift is exportable as a structured data file or PDF for audit submission. No manual log sheets, no end-of-month data compilation, no missing records.
Deployment Timeline: From Data Assessment to Production Predictive Scrap Analytics
Predictive scrap analytics on a crushing circuit follows a structured deployment path designed to minimise production disruption while building confidence in the system's forecasting capability before it becomes the primary quality control method.
Week 1-2
Data assessment and connectivity
Technical review of crusher sensor availability, PLC data access, and historian coverage. Data pipeline established to feed live crusher parameters into the analytics platform. No production interruption.
Week 3-4
Data collection and model training
System captures production data in shadow mode — forecasting scrap risk without alerting operators. Training dataset assembled from operation-specific process data and quality outcomes. Model achieves target accuracy threshold.
Week 5-6
Parallel running and validation
AI system runs alongside conventional lab sampling. Plant team compares model forecasts against actual quality outcomes. Discrepancies reviewed, model fine-tuned. Executive confidence built through side-by-side validation.
Week 7+
Full production deployment
Predictive scrap analytics becomes primary quality control method. Manual lab sampling reduced to spot checks. Executive dashboard live. Yield improvement tracking begins. Model continuously improves through production data feedback.
Conclusion
Predictive scrap analytics for mining crushing changes the plant executive's job from reactive scrap reviewer to proactive margin manager. Instead of reviewing lab results at the end of shift, looking for off-spec material that has already been produced, the executive monitors a live dashboard that forecasts each scrap risk event before it occurs — with parameter drift identified, risk severity indicated, and corrective action recommended. The sampling hours that once consumed half the quality control resources are recovered as prevention time. The scrap that once reached the product pile undetected is forecast and prevented before the first off-spec ton is produced.
The crushing operations that are moving toward zero-defect processing share a common capability: real-time scrap risk forecasting at the point of production, integrated with the plant executive's workflow, and backed by machine learning models that improve with every ton processed. That capability is available today as a software layer on existing crusher infrastructure — no controller replacement, no MES migration, no operator workflow disruption.
iFactory's predictive scrap analytics platform is purpose-built for mining crushing operations — integrating with existing crusher sensors and control systems to deliver real-time scrap risk forecasting, automated COPQ tracking, and audit-ready compliance records without changing the operator or plant executive workflow. Book a Demo to see predictive scrap analytics running on a crushing circuit use case matched to your ore types and circuit configuration, or Talk to an Expert to discuss scrap reduction targets for your specific operation.
Frequently Asked Questions
Production-deployed machine learning models for scrap prediction in mining crushing consistently achieve 88-95% accuracy in forecasting off-spec events 30 to 90 minutes in advance, depending on feed material variability and sensor data quality. Conventional lab sampling, by comparison, detects scrap after it has been produced, with a detection latency of 30-90 minutes from sample collection to result. During that latency window, tens to hundreds of tons of off-spec material may be produced. Predictive scrap analytics also identifies the specific parameter combinations driving scrap risk — such as the interaction between feed moisture and closed-side setting — enabling targeted corrective action rather than trial-and-error parameter adjustment. Book a Demo to see accuracy benchmarks for your specific ore types and crusher configuration.
No. Predictive scrap analytics is designed to work with sensors already installed on the crusher — power draw, closed-side setting, feed rate, liner wear, vibration, and bearing temperature. The software layer ingests data from existing PLC and SCADA systems via standard industrial protocols such as OPC-UA, Modbus, and MQTT. For operations where sensor coverage is limited, the initial deployment works with the available data stream; additional sensors can be added incrementally to improve model accuracy, but they are not required for deployment. The assessment phase identifies any data gaps and provides recommendations for filling them. Talk to an Expert about a data readiness review for your specific circuit.
Published mining industry results and iFactory deployment benchmarks indicate a 30-50% reduction in scrap rate within the first three to six months of deployment. For a medium-scale crushing operation processing 10 million tons annually with a baseline 10% scrap rate, a 40% scrap reduction translates to 400,000 additional saleable tons per year — without increasing feed rate or adding processing capacity. The reduction comes from two mechanisms: preventive parameter adjustments triggered by scrap risk forecasts, and systematic identification of the root cause parameter combinations driving the majority of scrap events. Most operations find that 70-80% of scrap is caused by a small number of recurring parameter interactions that the model surfaces within the first month of operation. Book a Demo to see a scrap reduction projection for your specific operation.
iFactory's predictive scrap analytics platform is designed for integration with existing plant control architecture without requiring PLC replacement or SCADA migration. The platform ingests data via OPC-UA, Modbus TCP, MQTT, and API connectors to major historians. Quality and scrap data exports in standard formats compatible with SAP, Oracle, OSIsoft PI, and custom reporting systems. For operations requiring environmental compliance reporting, the platform generates scrap and energy metrics automatically per shift. Integration scope is confirmed during the data assessment phase, which includes a technical review of your plant's sensor coverage, control system architecture, and reporting platform. Talk to an Expert about integration for your specific crusher circuit configuration.
The system is configurable to operate in advisory mode, semi-autonomous mode, or full closed-loop mode depending on the plant's risk tolerance and operating philosophy. In advisory mode — the most common starting configuration — the system displays scrap risk forecasts and recommended parameter adjustments to the operator, who decides whether to implement the change. In semi-autonomous mode, the system adjusts parameters within predefined safe bounds and escalates to the operator if the recommended adjustment exceeds those bounds. Full closed-loop mode enables the system to adjust crusher parameters automatically based on the forecast model, with operator override available. The mode can be set per crusher and changed at any time. Most operations start in advisory mode, transition to semi-autonomous after 4-6 weeks of parallel running, and evaluate closed-loop based on demonstrated model reliability. Book a Demo to see the configurable control modes in action on a live crushing circuit simulation.
Every Ton of Scrap You Forecast Is Margin You Do Not Have to Earn Back Through Throughput.
iFactory predictive scrap analytics for mining crushing — real-time scrap risk forecasting, automated COPQ tracking, and audit-ready compliance records. Purpose-built for plant executives and operations managers.