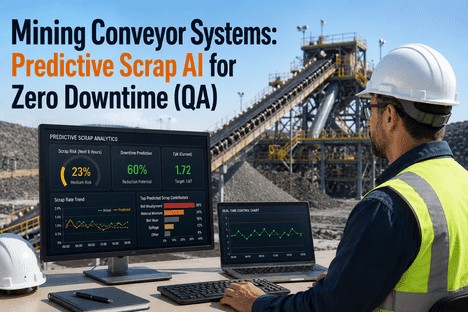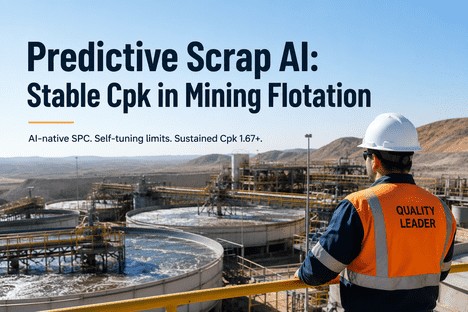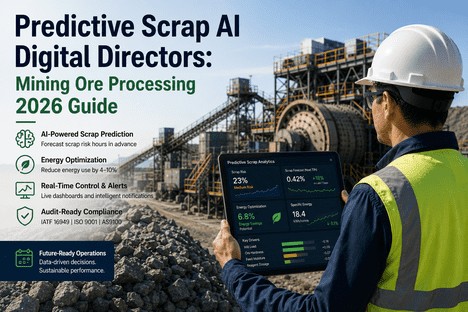
Every shift, ore processing operators make dozens of decisions without a complete picture — adjusting feed rates, watching crusher loads, eyeballing concentrate grades — while upstream variability silently erodes recovery and pushes scrap toward the end of the line. By the time a quality alarm fires, the loss has already happened. The ore is gone, the energy is spent, and the throughput gap is on the shift report. Predictive scrap analytics changes that sequence entirely: machine-learning models watch your process parameters continuously and flag scrap risk hours before it materialises, giving operators time to act rather than time to explain.
The Scrap Problem in Ore Processing Is Not Random — It Is Predictable
Ore processing scrap does not appear without warning. It arrives after a sequence of process signals that, individually, look like normal variation — a slight shift in feed moisture, a gradual climb in mill power draw, a Cpk trending toward 1.0 before crossing it. Operators on the floor see fragments of this picture. They watch one screen, manage one section of the line, and make reactive calls. The problem is systemic: the data exists, but no single operator can hold all of it simultaneously and calculate what it means for yield over the next four hours.
Predictive scrap analytics solves this by doing what no human operator can do alone — monitoring every relevant parameter simultaneously, detecting the pattern that precedes a scrap event, and surfacing a risk score and recommended action before the window closes. The machine sees the whole process. The operator gets the intervention point.
What Continuous Cpk Tracking Actually Tells an Operator
Cpk is the number that tells you whether your process is actually capable of staying inside spec — not just whether it's in control at this moment, but whether it has the precision and centring to consistently produce acceptable output. In ore processing, the relevant Cpk targets differ by circuit: flotation recovery, grind size distribution, reagent consumption, and concentrate grade all have their own specification windows. Tracking all of them manually on a shift basis means you are always looking at history, not trend.
The shift from shift-end Cpk reporting to continuous Cpk tracking is not cosmetic. When AI platforms recalculate capability as each new data point arrives, a declining Cpk trend becomes visible hours before it crosses the critical threshold — giving operators the intervention window that end-of-shift reports never provide.
How Predictive Scrap AI Works on the Ore Processing Shop Floor
Predictive scrap analytics is not a black box that replaces operator judgment. It is a structured layer that processes more signals than any individual can hold simultaneously and converts that information into actionable risk scores the operator can act on. The workflow has four connected stages:
The Four Ore Processing Circuits Where Scrap Risk Is Highest
Scrap in ore processing is not evenly distributed. Four circuits account for the majority of recoverable yield loss — and each has a distinct predictive signature that AI models can learn to detect early.
Grinding circuit performance is the first domino. When feed hardness increases unexpectedly — a common occurrence when ore blending is less controlled — the mill overloads, particle size coarsens, and downstream recovery falls. Operators typically detect this through power draw alarms or manual sieve checks. Predictive models detect it through the combination of feed tonnage rate, power draw trend, and particle size sensor data hours earlier — before the circuit is already out of spec. Cpk tracking on P80 grind size gives continuous visibility into whether the grinding circuit is producing feed that the flotation cell can recover.
Flotation is the highest-value recovery circuit in most sulphide ore operations and the most sensitive to parameter drift. Reagent dosing, pH, pulp density, air flow rates, and froth characteristics all interact in ways that create non-linear outcomes for recovery and concentrate grade. A slight overdose of depressant combined with marginal pH drift can drop copper recovery by several percentage points in under an hour. ML models trained on flotation data can identify these multi-variable pre-failure patterns and alert operators before concentrate grade declines past the off-spec threshold — the intervention window that separates a corrective adjustment from a scrap event.
Thickener and filter performance directly affects final product moisture specification — a quality parameter that is easy to miss until the product is weighed and sampled. When underflow density drifts outside the optimal band, filtration throughput drops and moisture content of the final concentrate rises above spec. The downstream impact — product rejection, rework, delayed shipment — is larger than the process signal that caused it. Continuous monitoring of underflow density, flocculant dosing, and bed level gives predictive models the input they need to flag moisture risk before the filter cake fails specification.
Final assay is the last line of defence — but relying on it as the primary quality control mechanism means every off-spec result is already a confirmed loss. Online analysers and XRF sensors integrated with predictive models allow continuous grade estimation between assay intervals. When the predicted grade trajectory based on current process parameters shows a declining trend toward spec boundary, the alert fires before the assay confirms the problem. AI-based grade prediction in mining has been documented to improve resource recovery by up to 20% versus manual sampling approaches — the same principle applies to concentrate quality management at the processing plant level.
What 15–25% Throughput Increase Actually Looks Like in Practice
The 15–25% throughput uplift documented in predictive analytics deployments does not come from running the plant faster. It comes from running it more consistently — eliminating the time lost to reactive downtime, off-spec rework, grade investigation, and process recovery after a scrap event. Each of those losses consumes capacity that the plant already has but cannot access because the process is not stable enough to use it reliably.
Predictive maintenance and analytics-driven control delivers documented improvements of 30–50% in unplanned downtime reduction and 18–40% cuts in maintenance costs across documented mining deployments. The patterns are consistent: early detection compresses the gap between signal and intervention — and that compression is where throughput is recovered.
— Predictive Analytics in Mining: Industry Analysis, 2026What iFactory Delivers for Ore Processing Operators
iFactory is not a separate quality system that creates more dashboards for operators to manage. It is a connected platform that integrates predictive scrap analytics, continuous Cpk tracking, and maintenance management into a single workflow — so that when a process parameter drifts, the quality alert and the maintenance check happen in the same system, not two different apps.
Frequently Asked Questions
Standard SPC monitors individual process parameters against control limits and fires an alarm when a limit is breached — by definition, after the process has already gone out of control. Predictive scrap analytics goes further: machine learning models trained on historical process data learn the multi-variable patterns that precede a scrap event and score current conditions against those patterns continuously. The result is a risk score that rises hours before any individual SPC alarm would fire, giving operators an intervention window that reactive SPC cannot provide. In ore processing, where the combination of feed variability, reagent dynamics, and recovery kinetics creates complex multi-parameter scrap signatures, predictive models provide meaningfully earlier warning than any single-parameter chart. Get In Touch to see how iFactory's predictive scrap layer integrates with continuous SPC tracking.
Throughput improvement in ore processing comes from eliminating the time lost to reactive scrap events — process recovery, rework, investigation, and downtime after an off-spec outcome. Continuous Cpk tracking makes declining process capability visible while it is still a trend rather than a confirmed loss, giving operators the information to correct parameters before spec is breached. A process consistently maintained at Cpk above 1.33 runs more throughput per shift than one oscillating between 1.0 and 1.5 because it eliminates the recovery cycles. Documented deployments of AI-driven process analytics in mining and mineral processing operations have recorded throughput increases of 15–25% — not from faster machines, but from more consistent processes that eliminate the hidden capacity losses. Book a Demo to see a live walkthrough of Cpk tracking across ore processing circuits.
Most ore processing operations already have the sensor infrastructure that predictive models require — process historians logging mill power draw, particle size, reagent flow, pulp density, and grade analyser data are standard in modern concentrators. The requirement is not more sensors: it is connecting existing data to an analytics layer that can score it continuously. iFactory ingests process data from standard industrial historians, integrates with common SCADA outputs, and requires a minimum of six to twelve months of historical quality and process data to train the initial predictive scrap models. The first risk forecasts are typically live within weeks of data connection. Get In Touch to start the data assessment for your facility.
Mining ore processing operations face increasing compliance documentation requirements across environmental monitoring, concentrate quality certification, and process safety standards. iFactory stores every quality alert, operator response, process parameter log, Cpk record, and quality outcome automatically in structured format — timestamped, attributed, and exportable in standard report formats on demand. Compliance reports covering scrap event history, intervention rates, Cpk trends by circuit, and operator response times are generated without manual assembly. For operations running regular internal or external audits, this eliminates the preparation burden and removes the documentation gaps that generate corrective action notices. Book a Demo to review the compliance report formats iFactory produces for mining quality audits.
Conclusion
The ore processing operations that will consistently deliver 15–25% throughput improvements over the next three years are not the ones with the newest mills or the biggest reagent budgets. They are the ones whose operators receive scrap risk warnings hours before the loss occurs — and whose quality records document every intervention automatically. The AI in mining market is growing at 41.9% annually because the performance gap between operations that use predictive analytics and those that do not is measurable, documented, and widening.
iFactory's predictive scrap analytics platform connects continuous Cpk tracking, ML-driven scrap forecasting, SPC control charts, and audit-ready documentation into one system built for ore processing operators. The intervention window exists — the question is whether your platform is showing it to you. Book a Live SPC Walkthrough to see how iFactory works across your specific process circuits, or Get In Touch to start building the predictive quality foundation your ore processing operation needs.