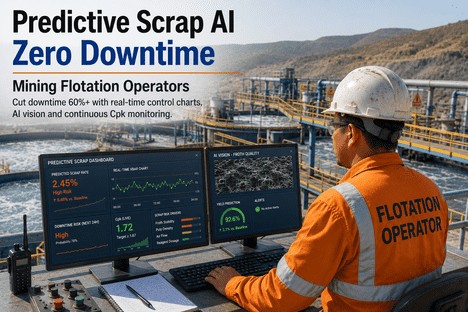
Industry 4.0 Predictive Scrap AI for Mining Pelletizing
By Grace on June 10, 2026
The night shift operator on the pelletizing line sees it coming before the lab does. The disc is producing a wider size spread than it did at shift start. The green belt shows a rising crack count. The discharge conveyor carrying fired pellets has a darker colour band running through it — a signature of under-firing that the operator has seen before but cannot quantify until the compressive strength result arrives at 06:00. By then, 1,800 tonnes of marginal pellets have been produced — some will pass, some will be re-screened, and some will be downgraded to a lower-value stockpile. The throughput for the shift is 4% below plan. The operator's report attributes it to a quality excursion. The real cause is that the scrap risk was visible in the process data three hours before the first marginal pellet emerged — but no alert system existed to connect the visual cues to the throughput impact in time for a pre-emptive adjustment. This is the throughput tax that reactive quality management levies on every pellet plant: the capacity lost to scrap events that could have been prevented if the warning signs had been read together rather than in isolation.
Scrap Risk Exists in Your Pellet Data Hours Before the First Off-Spec Pellet Falls. Predictive Analytics Recovers the Throughput Before It Is Lost.
iFactory's predictive scrap analytics engine ingests 40+ pelletizing process variables in real time — disc parameters, moisture, binder feed, kiln temperature profiles, and visual quality data — forecasting scrap risk hours ahead and alerting operators before off-spec production consumes capacity. Documented throughput increases of 15-25% across mineral processing deployments.
Throughput increase documented when predictive scrap analytics is deployed in mineral processing operations — driven by eliminating reactive downtime, rework, and process recovery cycles after scrap events
2-6 hrs
Lead time that predictive scrap analytics provides before a quality failure — the intervention window that determines whether the shift meets plan or falls short by hundreds of tonnes
40+
Process variables in a pelletizing line that drive scrap risk — disc speed, moisture, binder rate, kiln temperature, bed height, and more — correlated simultaneously by the ML model
8-12%
Typical scrap rate in pellet plants without predictive analytics — reduced to 3-5% when operators receive forecast-based alerts with ranked intervention recommendations
Why Scrap Is the Hidden Throughput Killer in Pelletizing
Throughput loss in a pelletizing plant is rarely caused by a single dramatic equipment failure. It is caused by the cumulative effect of quality excursions that force the operation into sub-optimal modes: slowing the disc feed rate to manage an oversize problem, diverting marginal product to the re-screening loop, reducing the kiln throughput to recover from a temperature profile drift, or stopping the line to clear a build-up caused by out-of-spec green pellets. Each event individually costs 15 to 60 minutes of lost production. Collectively across a quarter, these events consume 8 to 12% of the plant's available capacity — capacity that is already fully staffed and powered, producing no revenue during the recovery interval. Predictive scrap analytics eliminates these losses by detecting the conditions that produce each type of scrap event before the event occurs — giving the operator time to make a small adjustment that prevents the large throughput loss.
The Three Scrap Types That Steal Throughput — and How the ML Model Predicts Each One
Scrap Type 1
Size Distribution Drift on the Disc
Size drift is the most common throughput thief in pelletizing. When the disc feed rate, moisture content, or binder dosage shifts away from the optimal range, the proportion of oversize and undersize pellets rises. The operator's response is to reduce feed rate to regain control — sacrificing throughput to stabilise quality. Predictive scrap analytics detects the leading indicators of size drift: moisture sensor deviation from setpoint, binder flow variation beyond 3% of target, and disc power draw trending away from the baseline. The model issues an alert 30 to 90 minutes before the PSD would breach the spec limits — giving the operator time to adjust water or binder rather than reduce the feed rate.
Moisture and binder deviation detection
Disc power trend and growth rate analysis
PSD forecast with throughput impact estimate
Scrap Type 2
Induration Furnace Temperature Excursions
Furnace temperature profile drift is the highest-impact scrap event because it affects every pellet in the kiln simultaneously. A burner imbalance, a change in green pellet bed permeability, or a fuel gas composition shift can push the firing zone outside the optimal range within 20 to 40 minutes. The result is under-fired pellets that fail compressive strength testing or over-fired pellets with degraded metallurgical properties. The throughput impact is severe: the furnace must be slowed to recover the temperature profile, losing 30 to 90 minutes of production at full capacity. The ML model tracks windbox temperature profiles, burner pressure, fuel flow rate, and bed permeability simultaneously — detecting the early pattern of a developing excursion before the temperature deviation exceeds the firing window.
Windbox temperature profile correlation
Burner drift and fuel flow anomaly detection
Bed permeability change and firing impact model
Scrap Type 3
Binder and Feed Chemistry Variability
Changes in iron ore concentrate chemistry — silica content, Blaine fineness, and moisture variability — alter the binder demand and the green pellet formation characteristics. When the feed chemistry shifts, the fixed binder dosage schedule becomes either insufficient (producing weak pellets that crack and generate fines) or excessive (increasing cost without quality benefit). The throughput impact is indirect but measurable: weak green pellets generate breakage and fines in the furnace bed, reducing bed permeability and forcing a feed rate reduction to maintain airflow. The predictive model correlates feed chemistry data from upstream concentrators with green pellet strength and crack rate, alerting the operator to adjust binder dosage before the green pellet quality degrades.
The Scrap Event That Cost Last Shift 50 Minutes of Production Was Predicted by the Process Data 90 Minutes Earlier. Predictive Analytics Closes That Gap.
iFactory's ML model correlates 40+ pelletizing variables simultaneously — producing a ranked scrap risk forecast that tells the operator which parameter is drifting, by how much, and what to adjust before throughput is affected.
How Predictive Scrap Analytics Delivers Throughput in a Pelletizing Line
The system operates as a continuous analytical layer over the pelletizing line — ingesting DCS data, camera feeds, and laboratory results in real time, and producing a scrap risk forecast that updates every few minutes. The output is a single, ranked finding that tells the operator the top risk driver, the forecast throughput impact, and the specific adjustment that prevents the loss.
Layer
Data Fusion
Unified View of Disc, Furnace, and Feed Variables
Disc pelletizer parameters (rotation speed, pan angle, scraper position, power draw), green belt camera data (PSD, crack count, moisture sheen), induration furnace tags (windbox temperatures, fuel flow, grate speed, bed height), and feed chemistry data (silica, Blaine, moisture from upstream concentrator) are all ingested into a single time-series database. The ML model maintains a rolling feature window across all variables simultaneously — typically 60 to 180 minutes of history. This is the same data that operators and quality leaders review retrospectively after a scrap event. Predictive analytics reads it at the moment the pattern begins to form, not after the event is confirmed.
Layer
Scrap Forecast
Predicted Scrap Risk and Throughput Impact — 2 to 6 Hours Ahead
The ML model produces a scrap probability score and an estimated throughput loss for the next 2 to 6 hours based on the current trajectory of all process variables. The forecast includes three outputs: a scrap risk category (low, medium, high, critical), the primary process variable driving the risk, and the estimated tonnes of throughput at risk if no intervention is made. This forecast updates every 5 to 10 minutes. When the scrap risk crosses the medium threshold, the system issues a pre-emptive alert — giving the operator time to decide whether to adjust a parameter, change a setpoint, or call for a feed blend adjustment before the throughput loss materialises.
Layer
Ranked Alert
Actionable Intelligence — Not a Dashboard of Raw Data
When scrap risk exceeds the configured threshold, the operator receives a ranked alert on the control screen. The alert format is designed for immediate action: it states the forecast risk level, the primary driver and its deviation from optimal, the recommended adjustment, and the expected throughput recovery if the adjustment is made. The operator sees: "High scrap risk forecast in 2 hours. Primary driver: moisture content 1.8% above optimal for current binder rate. Recommended: reduce disc water spray by 12% or increase binder feed by 4%. Estimated throughput at risk: 180 tonnes if no action taken within 45 minutes." The intervention is specific, quantified, and time-bound.
Layer
Yield Tracking
Real-Time Throughput and Yield — Measured Against Plan, Not Against History
Throughput and yield are displayed in real time on the operator dashboard — actual tonnes produced, on-spec percentage, cumulative scrap tonnes for the shift, and forecast end-of-shift throughput vs plan. Every alert event is linked to its throughput impact: the system records how many tonnes were at risk, what intervention was taken, and whether the scrap event was prevented or occurred despite the alert. Over time, this data builds a throughput improvement record that quantifies the value of predictive analytics in terms that the plant manager and the operations director understand: additional tonnes produced per shift, per week, per quarter — not abstract quality scores.
The Operator Playbook: Four Actions That Turn Scrap Risk Into Throughput Gain
Operators who use predictive scrap analytics do not work harder — they work differently. The scrap forecast changes the sequence and timing of their decisions, shifting from reactive mode (respond to the alarm, investigate the cause, report the loss) to proactive mode (see the forecast, make the adjustment, confirm the recovery). Here are the four actions that define the new operating model.
1
Read the Scrap Forecast Before the Shift Starts
The incoming operator's first action on the control room floor is to review the scrap risk forecast for the next 4 hours. The forecast shows which parameters are trending toward out-of-spec conditions and the estimated tonnes at risk if no action is taken. If the model flags a rising oversize fraction on disc 3 and a moisture deviation on the same line, the operator knows before the first visual check that the disc needs a water adjustment within the next 30 minutes. The shift handover conversation changes from "we had a size excursion at 03:00, reduced feed rate by 10%" to "the model is showing a size drift risk on disc 3 in 2 hours — moisture has been trending up for the last 40 minutes, and the forecast says we have 30 minutes to correct it before throughput is affected."
Before: Review what went wrong on the last shift. After: Review what is about to go wrong on this shift — and prevent it.
2
Respond to the Forecast, Not the Alarm
Conventional alarms trigger after a variable has already exceeded its control limit — the oversize fraction is already above 12%, the furnace temperature is already outside the firing window. At that point, the operator's only options are corrective actions that reduce throughput: slow the disc, reduce the feed rate, or cut kiln production to recover the temperature profile. Predictive scrap analytics alerts the operator when the variable is trending toward the limit — the oversize fraction is at 8% but rising at 0.5% per 10 minutes, and the model predicts it will reach the 12% limit in 45 minutes. The operator makes a small adjustment to moisture or binder while the condition is still manageable, avoiding the throughput-reducing corrective action that a limit breach would require.
Before: React after the limit is breached — corrective actions cost throughput. After: Adjust while the trend is still developing — no throughput loss.
3
Use the Ranked Alert to Prioritise — Not All Deviations Are Equal
A pelletizing line generates dozens of process variables that fluctuate continuously. Without predictive analytics, every deviation above or below setpoint demands operator attention — creating alarm fatigue and causing operators to prioritise by recency rather than by impact. The predictive scrap model ranks each deviation by its correlation with forecast throughput loss. A 2% moisture deviation that the model correlates with a high risk of oversize production and a forecast throughput loss of 200 tonnes is surfaced as a high-priority alert. A 3% burner pressure deviation that the model correlates with a low scrap risk and no significant throughput impact is logged but not alerted. The operator's attention is directed to the adjustments that protect throughput, not to the fluctuations that the process can absorb without consequence.
Before: Every deviation is an alarm — operator fatigue and misprioritisation. After: Ranked alerts show only the deviations that threaten throughput.
4
Close the Loop — Every Alert Builds the Model
Every scrap risk alert — regardless of whether the operator intervenes or the event occurs — creates a labelled data point for the ML model. When the operator makes a recommended adjustment and the scrap risk resolves without throughput loss, the model records the action and the outcome as a positive reinforcement example. When the model issues an alert, the operator intervenes, and the scrap event still occurs (because the feed chemistry changed faster than the model's training data had seen), that event is recorded as a model improvement opportunity. Over 8 to 12 weeks of operation, the model's accuracy improves continuously as it learns which parameter combinations, intervention timings, and adjustment magnitudes produce the best throughput outcomes for the specific pelletizing line, ore blend, and operating regime.
Before: Scrap events produce incident reports that are filed and forgotten. After: Every scrap event and near-miss improves the model's forecast accuracy.
"
We deployed predictive scrap analytics on our pelletizing line in March. The first thing the model did was flag a moisture deviation on disc 2 that our operators had been compensating for manually for months — they were adjusting feed rate every 20 minutes to manage the size distribution, effectively running the disc at 88% of capacity to stay within spec. The model identified the root cause: a worn spray nozzle on the moisture addition system that was delivering inconsistent droplet size. We replaced the nozzle. The moisture deviation dropped by 60%. The disc feed rate went to 97% of capacity. Throughput on that line increased by 9% from a single nozzle replacement that the model identified in its first week of operation. The operator who had been managing that disc for a year said the system caught something he had learned to live with.
— Pellet Plant Production Superintendent, Straight-Grate Operation, 4.2 Mtpa
Predictive Scrap Analytics vs. Reactive Quality Control: The Throughput Impact Across a Year
The difference between predictive and reactive quality management is not visible in a single shift comparison — it accumulates as prevented scrap events compound into sustained throughput that would otherwise be lost to recovery cycles. The table below shows the cumulative difference across the five dimensions that define pellet plant throughput performance.
Performance Dimension
Reactive Quality Control
Predictive Scrap Analytics
Throughput utilisation
78-85% of nameplate — scrap events consume 8-12% of capacity; recovery cycles consume additional 5-8%
92-98% of nameplate — scrap events prevented before they affect production; recovery time eliminated
Scrap rate
8-12% of production — detected at lab result, 2-4 hours after defect onset; off-spec tonnes already committed
3-5% of production — forecast alerts enable intervention before scrap is produced; near-miss events logged
Operator response time
30-120 minutes from defect onset — limited by patrol intervals, visual inspection capacity, and lab cycles
2-10 seconds from risk detection — alert appears on control screen with ranked recommendation
0-10 minutes — small pre-emptive adjustment made during trend phase eliminates need for recovery
Model accuracy
Not applicable — scrap detection is retrospective; no forecast capability exists
90%+ forecast accuracy within 8 weeks of live deployment; improves continuously through active learning
Conclusion
Every tonne of off-spec pellet that a pelletizing plant produces has already consumed feed material, grinding energy, binder reagent, fuel gas, and labour before it is downgraded or discarded. The throughput that the plant reports at the end of each shift is not simply a function of how fast the line ran — it is a function of how consistently the line ran within specification. Every quality excursion that forces a feed rate reduction, every marginal batch that must be re-screened, every temperature recovery cycle that slows the kiln, represents capacity that the plant possesses but cannot access because reactive quality management discovers scrap events after the fact.
Predictive scrap analytics changes this by reading the same process data that quality investigations review in retrospect — but reading it in real time, correlating 40+ variables simultaneously, detecting the pattern that precedes a scrap event while the operator still has time to act. The result is not a marginal improvement in quality scores. It is a structural increase in the throughput the plant can deliver from the same equipment, the same crew, and the same feed material — because the capacity that was previously lost to scrap recovery cycles is now available for productive operation.
iFactory's predictive scrap analytics platform is purpose-built for pellet plant operators and production leaders — delivering ML-driven scrap risk forecasts, real-time throughput tracking, self-tuning SPC on all key quality characteristics, automated audit documentation, and the ranked intelligence that enables operators to prevent scrap before it consumes capacity. Book a Demo to see the platform running on a pelletizing use case matched to your line configuration, or talk to an expert about a free throughput opportunity assessment for your operation.
Frequently Asked Questions
Throughput increase is measured as the change in on-spec tonnes produced per unit of operating time, comparing a rolling 30-day average after deployment against the pre-deployment baseline. The metric captures both the direct effect of reduced scrap (fewer tonnes diverted to off-spec stockpile) and the indirect effect of reduced recovery time (the operating time that was previously spent returning the process to stable conditions after a scrap event, now available for production). iFactory establishes the baseline during the first two weeks of deployment, during which the system runs in shadow mode — recording scrap risk forecasts and estimated throughput impact without affecting operator decisions. After go-live, throughput is tracked on a per-shift basis and aggregated into weekly and monthly reports. The 15-25% range represents documented results across mineral processing operations with varying baseline automation levels. A detailed site-specific estimate is prepared during the connect-and-calibrate phase using your plant's historical production data. Talk to an expert about a throughput opportunity assessment for your specific pelletizing line configuration.
Pellet plants routinely switch between acid pellets, fluxed pellets, and DR-grade pellets — each with different process parameter targets. The predictive scrap model accommodates grade transitions through two mechanisms. First, the model is trained on historical data that includes all grades the plant produces, so it recognises the different process signatures associated with each grade. Second, when an operator selects a new grade target, the model updates its baseline reference for all correlated variables — the target moisture range for acid pellets is not the same as for fluxed pellets, and the model adjusts its scrap risk thresholds accordingly. The same applies to ore blend changes: when the feed chemistry shifts (silica content, Blaine fineness, moisture), the model detects the change within 20 to 40 minutes of data and updates its correlations between feed characteristics, process parameters, and scrap risk. The self-tuning SPC baseline ensures that control limits are appropriate for the current operating regime rather than producing false alarms during transitions. Book a Demo to see grade transition handling demonstrated with your plant's typical production schedule.
Deployment on a typical pelletizing line takes 8 to 12 weeks from kick-off to live operation. The timeline breaks down into four phases: connect and calibrate (weeks 1-2) — iFactory engineers connect to the plant's DCS, PLC, and historian data sources, establish data flow for 40+ process variables, and calibrate data quality and sampling rates; model training (weeks 3-5) — the ML model is trained on 12 to 24 months of historical process data paired with quality outcomes, producing the initial scrap risk model; shadow mode (weeks 6-8) — the model runs alongside existing operations without affecting decisions, generating scrap risk forecasts that operators and quality leaders can review and validate against actual outcomes; go-live (weeks 9-12) — after validation, the model's alerts are enabled for operator response. The system produces scrap risk forecasts from week 6 onward (shadow mode), and operators receive actionable alerts from week 9. Sites with existing data historian infrastructure and clean data quality typically complete the cycle in 8 to 10 weeks. Talk to an expert about a deployment timeline estimate for your specific plant.
The platform ingests data from three primary source categories. Process data from the DCS and PLC historian: disc pelletizer parameters (rotation speed, pan angle, motor power draw, scraper position), green belt and conveyor parameters (speed, bed depth, material flow rate), induration furnace parameters (windbox temperatures at each zone, grate speed, fuel flow rate, burnthrough point, cooler parameters), and screen deck performance data. Feed and quality data from the laboratory information system and upstream concentrator: head feed chemistry (silica, iron, alumina, Blaine fineness, moisture), binder feed rate and type, green pellet quality (drop strength, green pellet size distribution from mechanical or vision-based measurement), fired pellet quality (compressive strength, tumbler index, abrasion index, size distribution). Visual data where available: camera feeds from disc stable area, green belt, and kiln discharge — adding pellet surface and colour features to the model feature set. The platform connects to existing plant data infrastructure via OPC-UA, Modbus, MQTT, or direct historian API. No new sensors are required for core functionality, though additional cameras can be added to improve model accuracy at specific inspection points. Talk to an expert about a data source assessment for your pelletizing line.
Yes — the model architecture is furnace-type agnostic. Straight-grate and grate-kiln induration systems have different temperature profiles, residence times, and cooling configurations, but the underlying scrap risk drivers are the same: temperature profile deviation, bed permeability changes, fuel flow variation, and residence time effects. The model learns the specific relationship between each furnace type's process parameters and the resulting fired pellet quality from the plant's historical data. For straight-grate operations, the model focuses on windbox temperature profile correlation with pellet quality. For grate-kiln operations, the model tracks the rotary kiln temperature profile, burner flame characteristics, and the transfer-chute condition indicators. The platform supports plants that operate both furnace types within the same instance, with separate model baselines for each production line. The scrap risk forecast and throughput tracking are displayed on a unified dashboard with line-level granularity. Book a Demo to see the platform configured for both furnace types with live data from a multi-line pelletizing operation.
The Scrap That Dragged Down Last Quarter's Throughput Was Forecastable. Every Tonne Lost to a Preventable Quality Excursion Is Capacity Your Plant Already Has. Get a Free Throughput Assessment.
iFactory's predictive scrap analytics platform forecasts scrap risk 2-6 hours ahead on any pelletizing line configuration, delivers 15-25% throughput increase by eliminating reactive scrap recovery cycles, and generates the audit-ready quality records that ISO 9001 and customer assessors require — all without adding inspection headcount or requiring new sensors.