Yield is the single biggest lever on the cost of an EV battery cell, more decisive than any single raw material price swing, and it is also the metric that behaves the least predictably during a production ramp. A process that delivers 95 percent yield in a lab or pilot line routinely falls to 40 percent during the first months of full-volume production, not because of one dramatic failure but because dozens of small variations compound once line speed increases by ten to a hundred times. A single coating defect in one electrode sheet out of every ten thousand can cascade into a quarter of finished packs being scrapped once that sheet is multiplied across cells and packs. Plant managers trying to close that gap between lab yield and ramp-up reality can book a demo to see how AI-driven quality analytics catch yield-killing defects at the stage where they start, not the stage where they finally show up.
Close the Gap Between Lab Yield and Gigafactory Reality
iFactory AI monitors electrode coating, cell assembly, formation cycling, and aging in one connected quality view — catching the small process drifts that compound into scrapped packs before they ever reach final test.
Why Battery Cell Yield Falls Off a Cliff During Ramp-Up
Battery cell manufacturing has more sequential process steps than almost any other high-volume product, and each step has its own tolerance window. Electrode coating thickness, calendering density, winding alignment, tab weld quality, electrolyte fill volume, and formation cycling parameters all have to land within narrow specification simultaneously for a cell to reach its rated capacity and cycle life. The industry's semiconductor cousins operate at 96 to 98 percent yield in steady state; battery manufacturing, even among established producers, typically sits closer to 90 percent, and new lines ramping to full volume commonly see quality defect rates of 12 to 15 percent — several times higher than the 2 to 3 percent typical of a mature internal combustion engine plant.
The reason a small defect rate turns into a large scrap problem is compounding. If an electrode line produces one defective sheet per ten thousand, and each cell uses roughly a hundred sheets, and each pack uses around thirty cells, that single upstream defect rate cascades into a pack scrap rate that can approach a quarter of finished output. Traditional post-formation sampling, which typically inspects only one to two percent of cells, was never designed to catch that kind of compounding effect before it reaches finished packs. Contamination adds another layer to the problem: metal particles shed from equipment wear surfaces, dust introduced during electrode handling, and moisture ingress during electrolyte fill each create failure modes that only show up statistically across thousands of cells, which is exactly the pattern continuous monitoring is built to catch and manual sampling is built to miss.
Where Yield Is Actually Lost Across the Cell Manufacturing Process
Yield loss is rarely one catastrophic event — it is a small percentage shaved off at every stage of the process, compounding by the time a cell reaches final test. The funnel below shows a representative ramp-up scenario with and without continuous AI-driven quality monitoring across each stage. Notice how the gap between the two scenarios widens rather than staying constant as cells move downstream — that widening gap is the compounding effect at work, and it is exactly why a quality strategy focused only on final inspection arrives too late to save most of the yield that was already lost upstream.
Four Stages Where AI Quality Monitoring Changes the Yield Outcome
Each of the four stages below has a different failure signature, a different detection method, and a different cost if a defect slips through, which is why a single inspection strategy applied uniformly across the whole line tends to under-perform four stage-specific approaches working together.
Electrode Coating and Calendering
Continuous vision and thickness sensing catches coating pinholes, streaks, and density variation as small as a few microns, before a defective sheet is built into a hundred cells.
Cell Assembly and Winding
Winding alignment, tab weld imaging, and electrolyte fill volume are checked at line speed, catching the misalignment and weld defects that account for the majority of cell-level scrap.
Formation Cycling
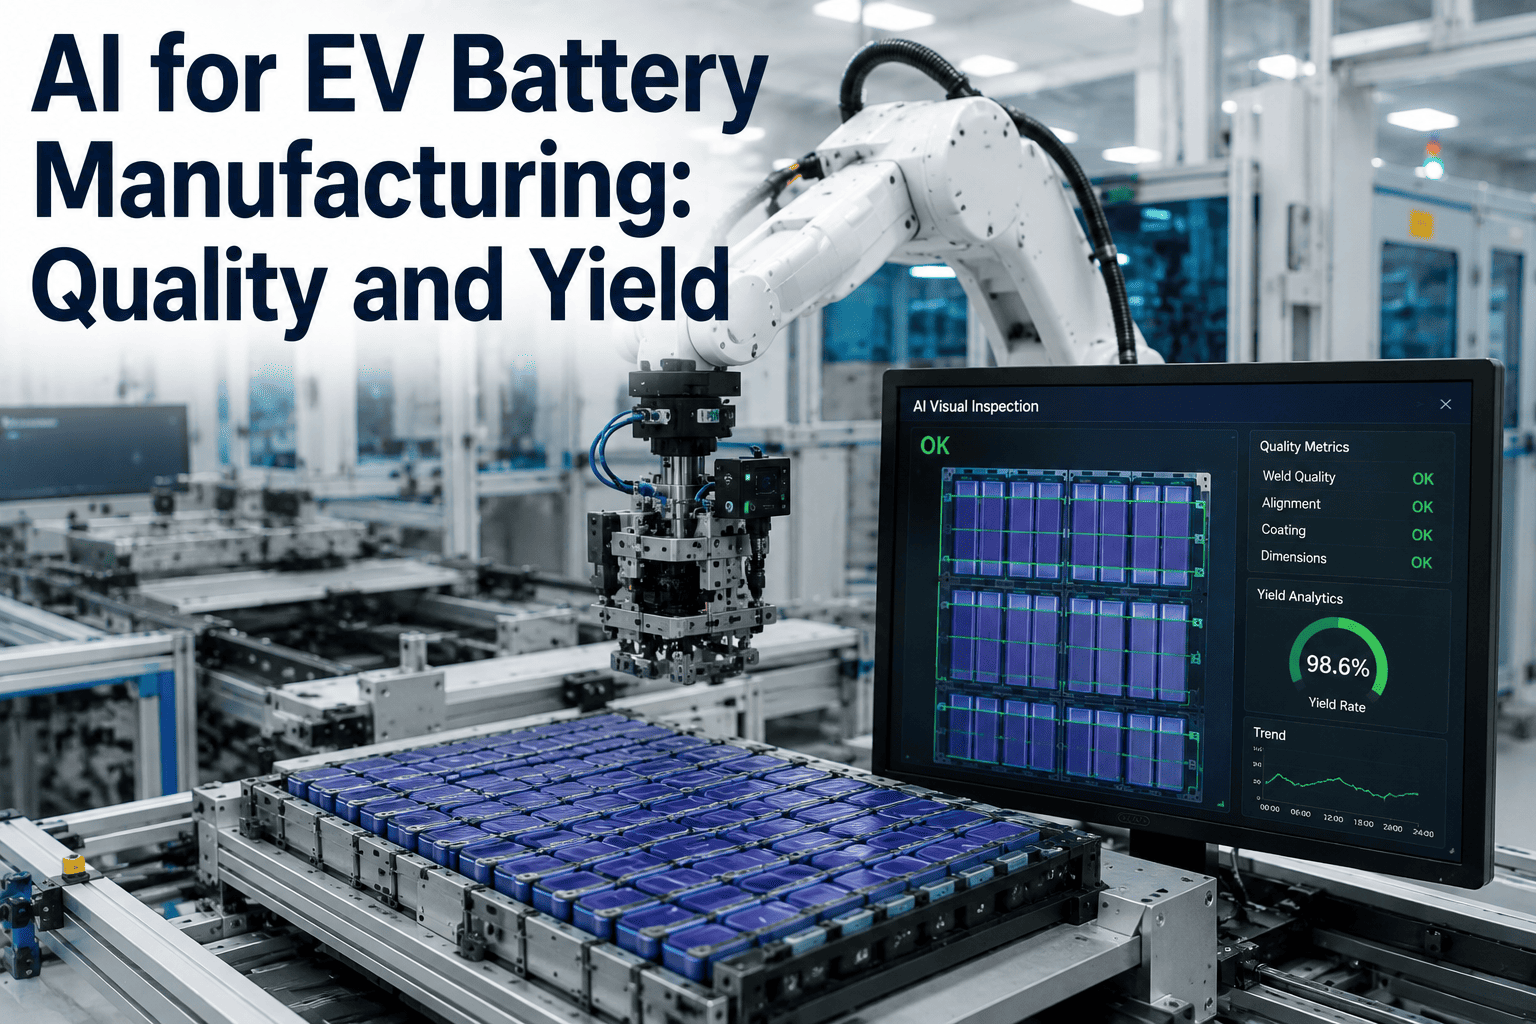
AI analysis of voltage curves, impedance, and thermal signatures during first charge and discharge reveals internal flaws long before a simple pass or fail test would catch them.
Aging and End-of-Line Test
Statistical outlier detection across capacity fade and self-discharge data flags marginal cells that would otherwise pass a binary specification check and reach a pack.
Battery Defect Types, Detection Method, and Cost Impact by Stage
Not every defect carries the same cost, and knowing where a given defect type is cheapest to catch is the foundation of any yield improvement plan. As a general rule, the cost of a defect roughly multiplies at every stage it survives, which is why the same coating pinhole that costs almost nothing to catch at the coating station can trigger a multi-thousand-dollar rework once it is discovered at final pack test, and an order of magnitude more if it ever reaches a vehicle in the field. The reference table below reflects the general pattern iFactory's battery manufacturing analytics team sees across gigafactory deployments.
| Process Stage | Common Defect Type | Detection Method | Relative Cost if Missed |
|---|---|---|---|
| Electrode Coating | Pinholes, thickness variation | Continuous vision plus thickness gauge | Lowest cost stage to catch |
| Cell Assembly | Winding misalignment, weld defects | Vision imaging plus weld signal analysis | Moderate, compounds per cell |
| Formation Cycling | Voltage, impedance, thermal anomalies | AI signal analysis of formation curves | High, cell nearly complete |
| Aging & EOL Test | Capacity fade, self-discharge drift | Statistical outlier detection | Higher, near pack assembly |
| Field / In-Vehicle | Thermal runaway, capacity loss | Warranty claim, recall investigation | Highest, roughly 1,000x factory cost |
What Plant Managers See After Moving From Sampling to Continuous Quality Monitoring
Plant managers who have lived through a gigafactory ramp describe the same turning point: the shift from finding out about a yield problem in a weekly quality report to seeing it the same shift it started, while there is still time to adjust the process instead of scrapping a week of output.
During our first six months of full-volume production, our formation area was sampling roughly two percent of cells, and our escape rate into pack assembly was high enough that we were pulling completed packs back apart on a near-weekly basis. It took us nearly three weeks to trace one recurring capacity issue back to a coating thickness drift on one specific slot-die lane, and by the time we found it we had already built and scrapped several days of downstream cells. Since we moved to continuous AI monitoring across coating, winding, and formation, that same category of drift now surfaces as an alert within a shift, tied to the specific line, lane, and shift responsible, instead of a mystery our quality engineers had to reconstruct after the fact from incomplete batch records. Our first-pass yield has climbed meaningfully since the transition, and just as importantly, our quality team spends its time acting on root cause instead of chasing which batch a defect came from.
AI for EV Battery Manufacturing Quality and Yield — Frequently Asked Questions
Why does EV battery yield drop so sharply during production ramp-up?
A battery cell manufacturing process that hits 95 percent yield in a lab environment often falls to around 40 percent during the first months of full-volume production, because dozens of small tolerances that were manageable at low speed start compounding once line speed increases by ten to a hundred times. The effect is multiplicative rather than additive: a single electrode defect rate of one in ten thousand sheets can cascade into a pack scrap rate approaching a quarter of output once multiplied across the sheets in a cell and the cells in a pack. Plant teams can book a demo to see how continuous monitoring narrows that ramp-up gap and shortens the time it takes a new line to reach steady-state yield.
Where in the battery manufacturing process does AI have the biggest impact on yield?
Coating defects and winding misalignment together account for over half of all cell defects in gigafactories, which makes electrode coating and cell assembly the highest-leverage stages for AI-driven inspection. Formation cycling is a close second in importance, since voltage, impedance, and thermal signal analysis during first charge catches internal flaws that a simple pass or fail voltage check would miss entirely. Teams unsure where to prioritize can contact support for a stage-by-stage review of their own defect Pareto.
How does AI catch battery cell defects that traditional sampling misses?
Traditional post-formation testing typically samples only one to two percent of manufactured cells, which means the vast majority of formation data collected during the critical first charge and discharge cycles is never actually analyzed for defect signals. AI models trained on voltage curve shape, impedance readings, and thermal signatures analyze every cell rather than a sample, catching defect escape rates that traditional approaches leave at 1 to 1.5 percent and pushing them down toward a few hundredths of a percent. Reach out to book a demo to see full-coverage formation analysis running on representative cell data.
What is the realistic ROI timeline for AI quality and yield systems in battery manufacturing?
Most gigafactory deployments see measurable OEE improvement within six to twelve weeks of go-live, driven by defect escape reduction, faster root-cause identification, and fewer downstream line stops caused by cascading scrap. The largest single value driver is usually the difference between catching a defect at formation versus discovering it after vehicle delivery, since the cost ratio between those two points can approach a thousand to one. Contact support for a payback estimate based on your current production volume and defect rate.
How does iFactory AI fit alongside existing MES, SCADA, and vision inspection systems in a gigafactory?
iFactory AI connects to existing MES, SCADA, and vision inspection infrastructure rather than replacing it, pulling coating, winding, formation, and aging data into one connected yield and quality view across lines, shifts, and product variants. This matters because gigafactories typically run equipment and inspection systems from multiple vendors that were never designed to share data, leaving root-cause analysis stuck at individual process boundaries. Plant managers can book a demo to see this integration mapped against their current systems.
Turn Your Ramp-Up Yield Curve Into a Managed Process, Not a Guessing Game
From electrode coating through formation cycling and aging, iFactory AI connects every stage of battery cell quality into one view — so plant managers catch yield-killing drift while it is still cheap to fix.