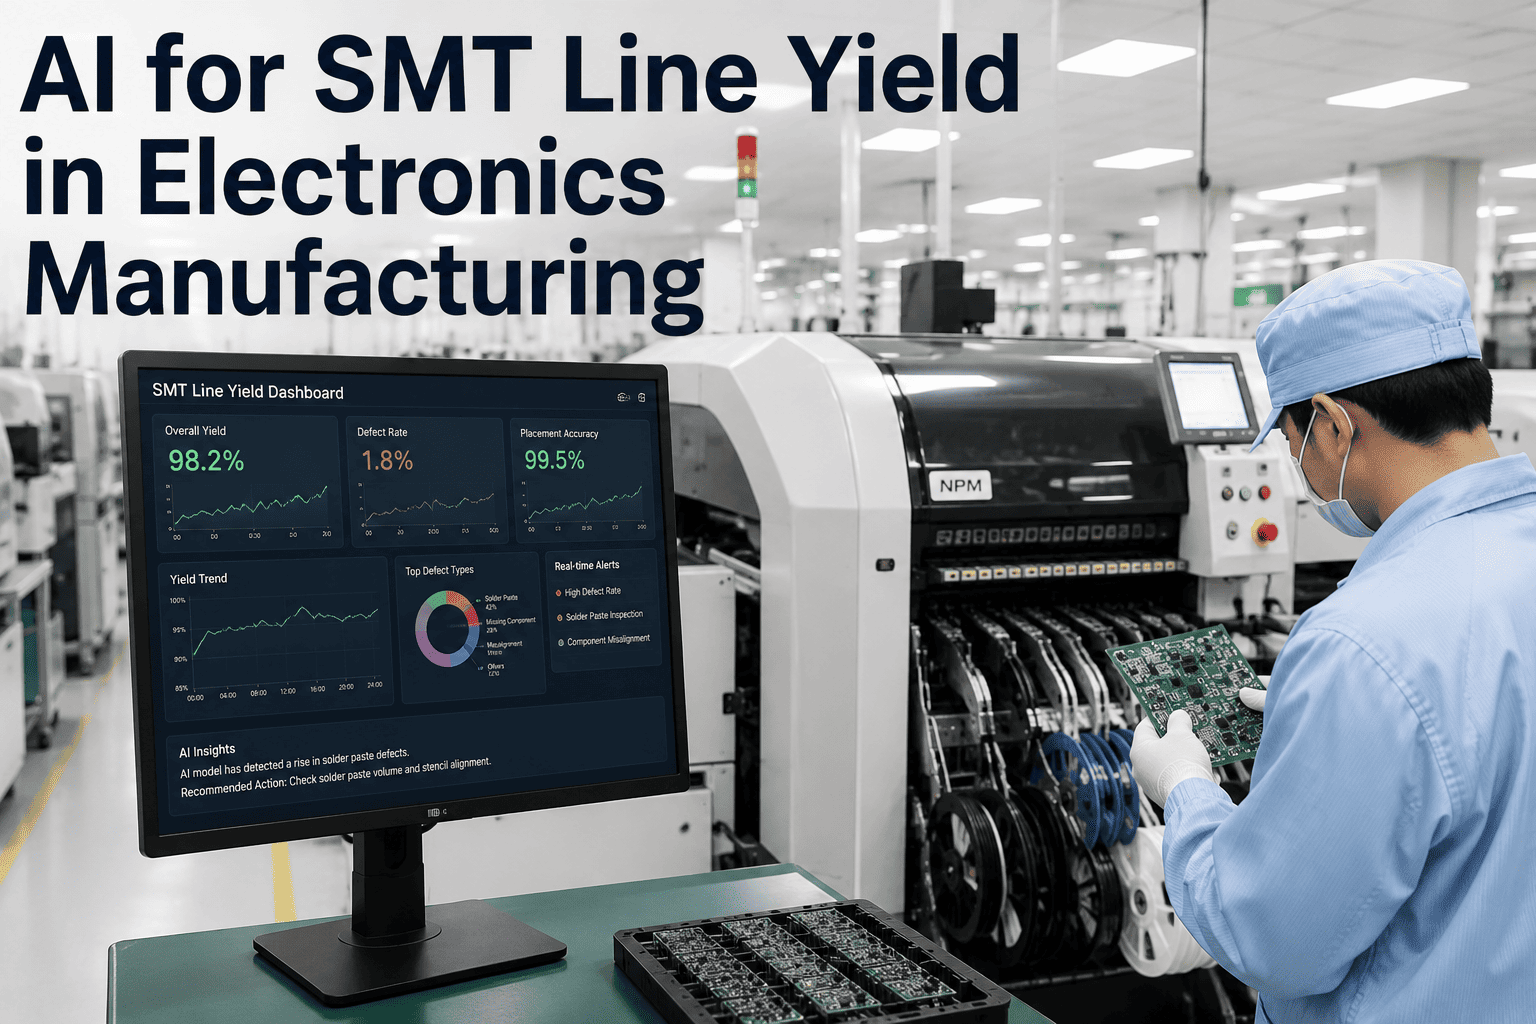
SMT lines generate more process data per minute than most plants analyze in a week. Between solder paste inspection, placement machine logs, reflow thermal profiles, and post-reflow AOI, the signals that explain every defect are already being captured, but they live in separate systems that never talk to each other. A solder paste issue detected at SPI shows up as a placement offset two machines later and a solder joint defect after reflow, yet most plants treat each station as an independent problem. iFactory's SMT yield module connects these signals in real time and predicts downstream defects before the board leaves the line.
Your SMT line knows why boards fail before your AOI does
iFactory correlates solder paste, placement, and reflow data across the entire line to catch defects at the source instead of discovering them at the end, lifting first-pass yield by catching what station-level systems miss.
How defects multiply across a single SMT line
Most plants measure yield at the end of the line, which means they see the final defect count but not where those defects were created or how they compounded through subsequent processes. The cascade below shows how a single root cause at the printer can generate multiple failure modes by the time the board reaches final inspection, and why fixing problems at the AOI stage is always more expensive than catching them at the source.
Where high-mix SMT lines actually lose first-pass yield
When you trace every board that fails first-pass yield back through the line and correlate the failure mode with the process data from each station, a clear pattern emerges. The chart below represents the typical yield loss breakdown for a high-mix EMS plant running 0201 and 01005 components with frequent changeovers, based on data from multiple facility assessments.
How AI connects what your stations already know
Each machine on your SMT line generates valuable process data, but today that data stays inside the machine controller or its proprietary software. The AI value is not in collecting more data but in connecting the data you already have across machines so that a prediction at SPI can trigger a correction at the printer before the next board is printed. The signal chain below shows the data flow and where AI intervention happens at each link.
Solder Paste Printer
Squeegee pressure, print speed, snap-off distance, stencil aperture fill rate
SPI System
Paste volume, height, area, alignment per pad, bridge detection flags
Chip Shooter and Fine Pitch
Placement coordinates, nozzle force, vision alignment offset, pickup success rate
Reflow Oven
Zone temperatures, belt speed, board-level thermal profile, actual vs. target delta
Post-Reflow AOI
Solder joint images, component presence and alignment, defect classification and location
Why miniaturization breaks traditional SPC limits
As component packages shrink from 0603 to 0201 and 01005, the process window for every parameter gets narrower while the variation sources stay the same or increase. The table below maps how defect risk shifts across component sizes and explains why the AI approach becomes essential rather than optional as you move to smaller packages.
| Component Size | Paste Volume Tolerance | Primary Defect Mode | SPC Detection Rate | AI Detection Rate | Yield Gap Closed |
|---|---|---|---|---|---|
| 0603 / 0805 | Plus or minus 20% | Tombstoning and insufficient solder | 85 to 90% | 94 to 97% | 4 to 7 points |
| 0402 | Plus or minus 15% | Bridging on fine pitch and voiding | 75 to 82% | 91 to 95% | 9 to 13 points |
| 0201 | Plus or minus 10% | Non-wet open and micro-bridging | 60 to 70% | 88 to 93% | 18 to 23 points |
| 01005 | Plus or minus 7% | Head-in-pillow and grainy joints | 40 to 55% | 84 to 90% | 29 to 35 points |
| 0.4mm BGA / CSP | Plus or minus 12% | Voiding under ball and coplanarity fail | 55 to 65% | 87 to 92% | 22 to 27 points |
| 0.3mm QFN | Plus or minus 8% | Toe fillet void and pad lift | 45 to 58% | 85 to 91% | 27 to 33 points |
Why one thermal profile per product is no longer sufficient
Most plants define a single reflow profile per PCB part number and run that profile regardless of variations in actual board loading, component reel changes, or oven zone drift over a production run. The reality is that the thermal mass on a board changes with every component placement, and the oven itself drifts as zones cycle and conveyors wear. AI reflow intelligence addresses this by building a dynamic profile that adapts to actual conditions rather than running a fixed recipe against a moving target.
Board density variation within a part number
The same PCB part number can have different component population options that change thermal mass by 15 to 25 percent. A profile optimized for the fully populated version will overheat the sparsely populated version, and vice versa. AI calculates the expected thermal mass from the actual bill of materials for each batch and adjusts zone setpoints accordingly before the first board enters the oven.
Oven zone drift during long production runs
Reflow ovens do not hold a perfectly stable temperature across an 8-hour shift. Zone temperatures can drift 2 to 5 degrees as heating elements age and airflow patterns shift with filter loading. AI monitors the actual zone temperatures against the target profile and recommends micro-adjustments during the run rather than waiting for the next profile validation cycle that may be weeks away.
Component mix changes from alternate BOM substitutions
When alternate components are substituted due to availability, the thermal characteristics of the board change even if the substitution is electrically equivalent. A resistor in a larger package or a capacitor with different dielectric material absorbs heat differently, and the fixed profile does not account for this. AI detects the substitution from placement machine data and adjusts the profile for the thermal properties of what is actually being placed.
Conveyor speed optimization for throughput and quality
Conveyor speed is typically set conservatively to ensure even the heaviest board reaches full reflow, meaning lighter boards spend more time at peak temperature than necessary. AI calculates the minimum conveyor speed that achieves proper reflow for the actual board in the oven right now, recovering 5 to 15 percent of cycle time without sacrificing joint quality on any component on that specific board.
Find out what your SPI data is predicting that you are not acting on
iFactory connects to your SPI, placement, and AOI systems and shows you the defect patterns that cross machine boundaries. Book a demo and we will walk through it on your own line data.
What EMS plants measure after 90 days of AI-guided SMT optimization
These results come from pilot programs across multiple EMS facilities running consumer electronics, automotive electronics, and industrial control boards. Every metric is measured against the same line's own baseline from the 90 days before iFactory was connected, not against theoretical models or industry survey data.
SMT is the highest-value AI starting point in electronics manufacturing
Of all the process areas an EMS plant could target for a first AI initiative, SMT line yield delivers the clearest and fastest return for a fundamental reason: the data infrastructure already exists and the cost of inaction is directly measurable. Every board that fails post-reflow AOI requires manual rework, which means direct labor cost, extended cycle time, and a quality risk that your customer never wants to hear about. Unlike upstream inventory optimization or downstream test engineering where savings are distributed and indirect, every percentage point of first-pass yield improvement on an SMT line shows up as a reduction in rework hours that your production manager can see on the daily schedule.
The integration path is also more straightforward than most plants expect. Your SPI system, placement machines, reflow oven, and AOI systems are already generating structured data on every board. That data flows through your MES or directly from machine controllers, and iFactory connects to those existing data streams without requiring new hardware, new sensors, or changes to your line configuration. The model begins learning from historical data during the first two weeks of shadow mode, and most plants see the first actionable predictions emerge within the first three weeks of the pilot without any operator workflow changes.
There is also a strategic dimension that makes SMT yield a compelling first use case. As automotive and medical electronics customers push toward zero-defect delivery with contractual DPMO penalties, the ability to demonstrate a systematic, data-driven approach to yield improvement becomes a competitive differentiator in new business reviews. An EMS plant that can show a customer how AI correlates process data across the SMT line to prevent defects has a stronger positioning argument than one that relies solely on end-of-line inspection and manual rework to hit quality targets. Many of our pilot customers use their SMT yield results as the opening slide in customer quality reviews within the first quarter after deployment.
What connecting AI to your SMT line actually looks like
Connects to your existing SPI, placement, and AOI systems
Works with Koh Young, Mirtec, Yamaha, Fuji, Samsung, and other major SMT equipment through standard data interfaces already available on your floor.
Calibrates to your actual board mix and component sizes
Model learns the behavior of your specific PCB designs, stencil configurations, and component package types without requiring any product or process changes.
Runs in shadow mode for the first two to three weeks
Predictions are generated and logged but not displayed to operators, so your team can validate accuracy against actual AOI outcomes with zero production risk.
Measures against your real yield baseline
Pilot success is defined against your actual FPY, DPMO, and false call rate from the 90 days before start, not against industry benchmarks or vendor claims.
On-premise deployment with no cloud dependency
Runs on an NVIDIA appliance inside your plant network, keeping your PCB design data and customer quality data on site behind your existing security controls.
Line-by-line expansion after validated results
Start with your highest-volume or most problematic line and expand to additional lines as the model proves out, with no disruption to lines not yet in scope.
What SMT operations managers ask before starting
Your SMT line is already generating the data to fix your yield problem
iFactory connects to your existing SPI, placement, and AOI systems and shows you the defect patterns that are invisible when each station is analyzed in isolation. Book a demo and we will show you what your line data reveals.