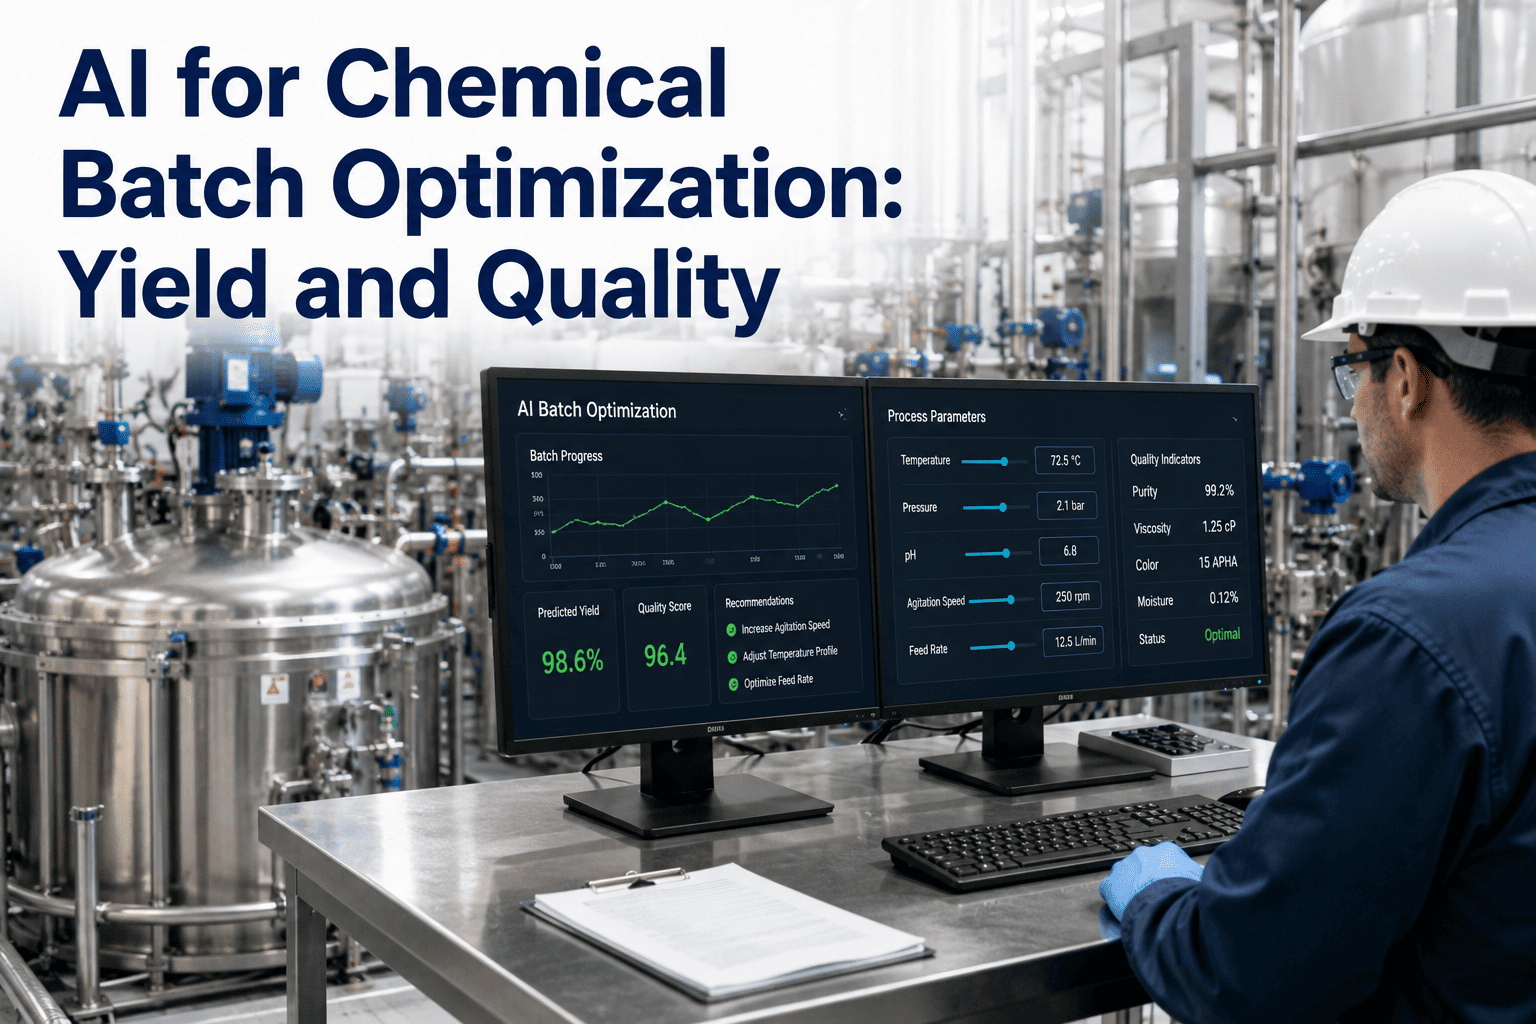
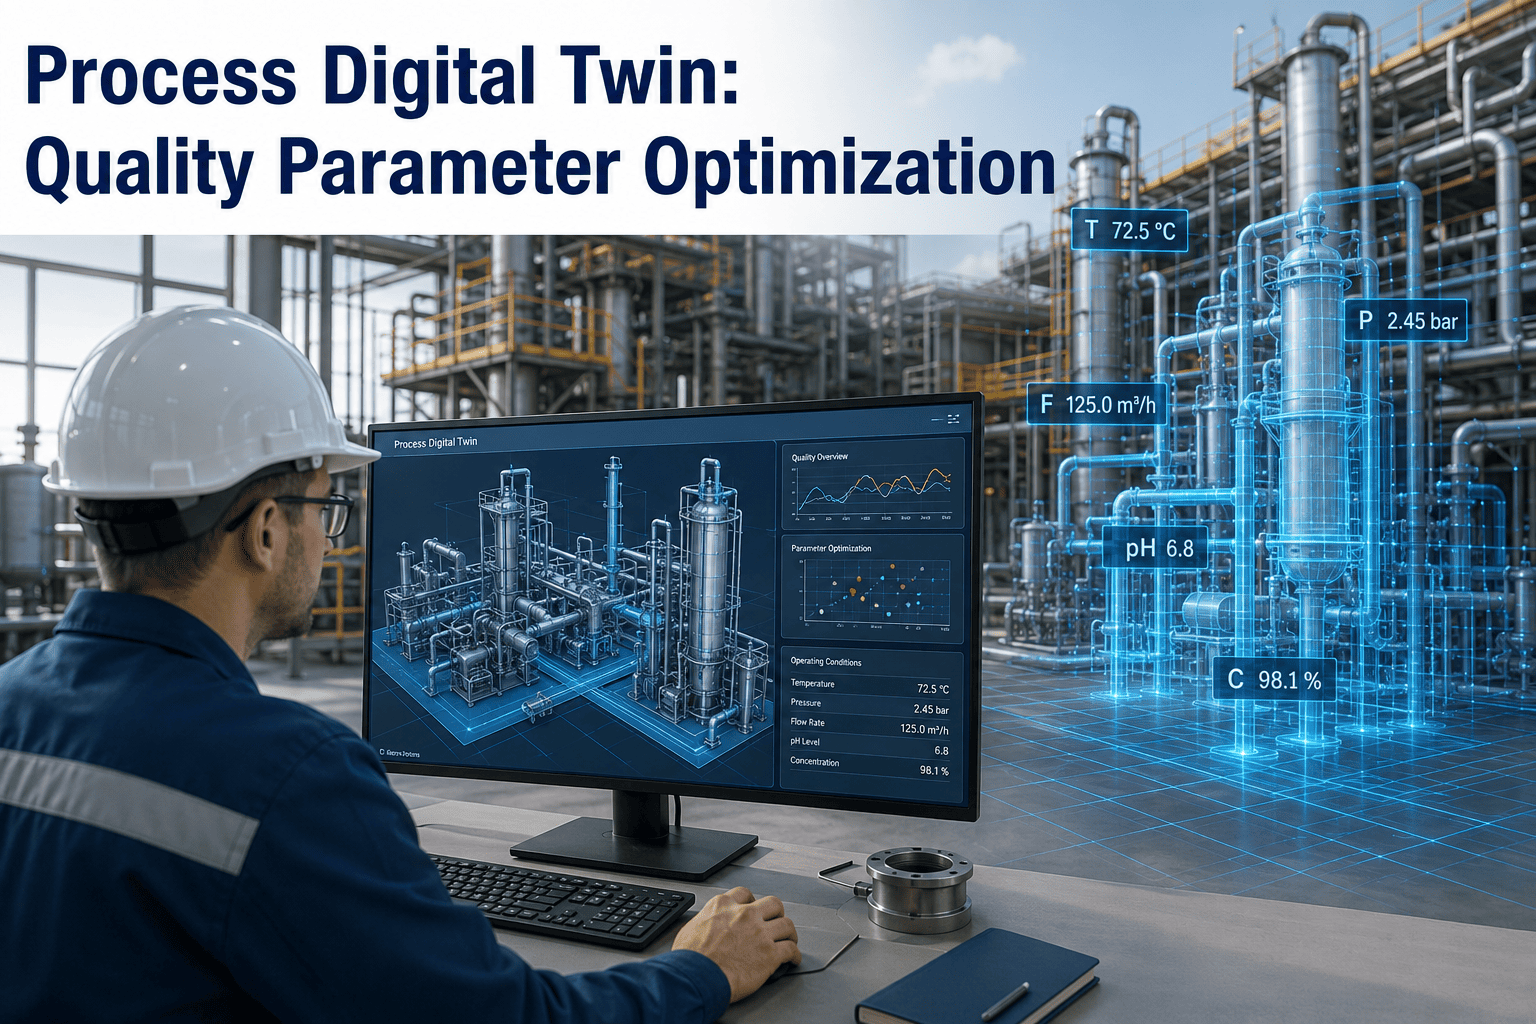
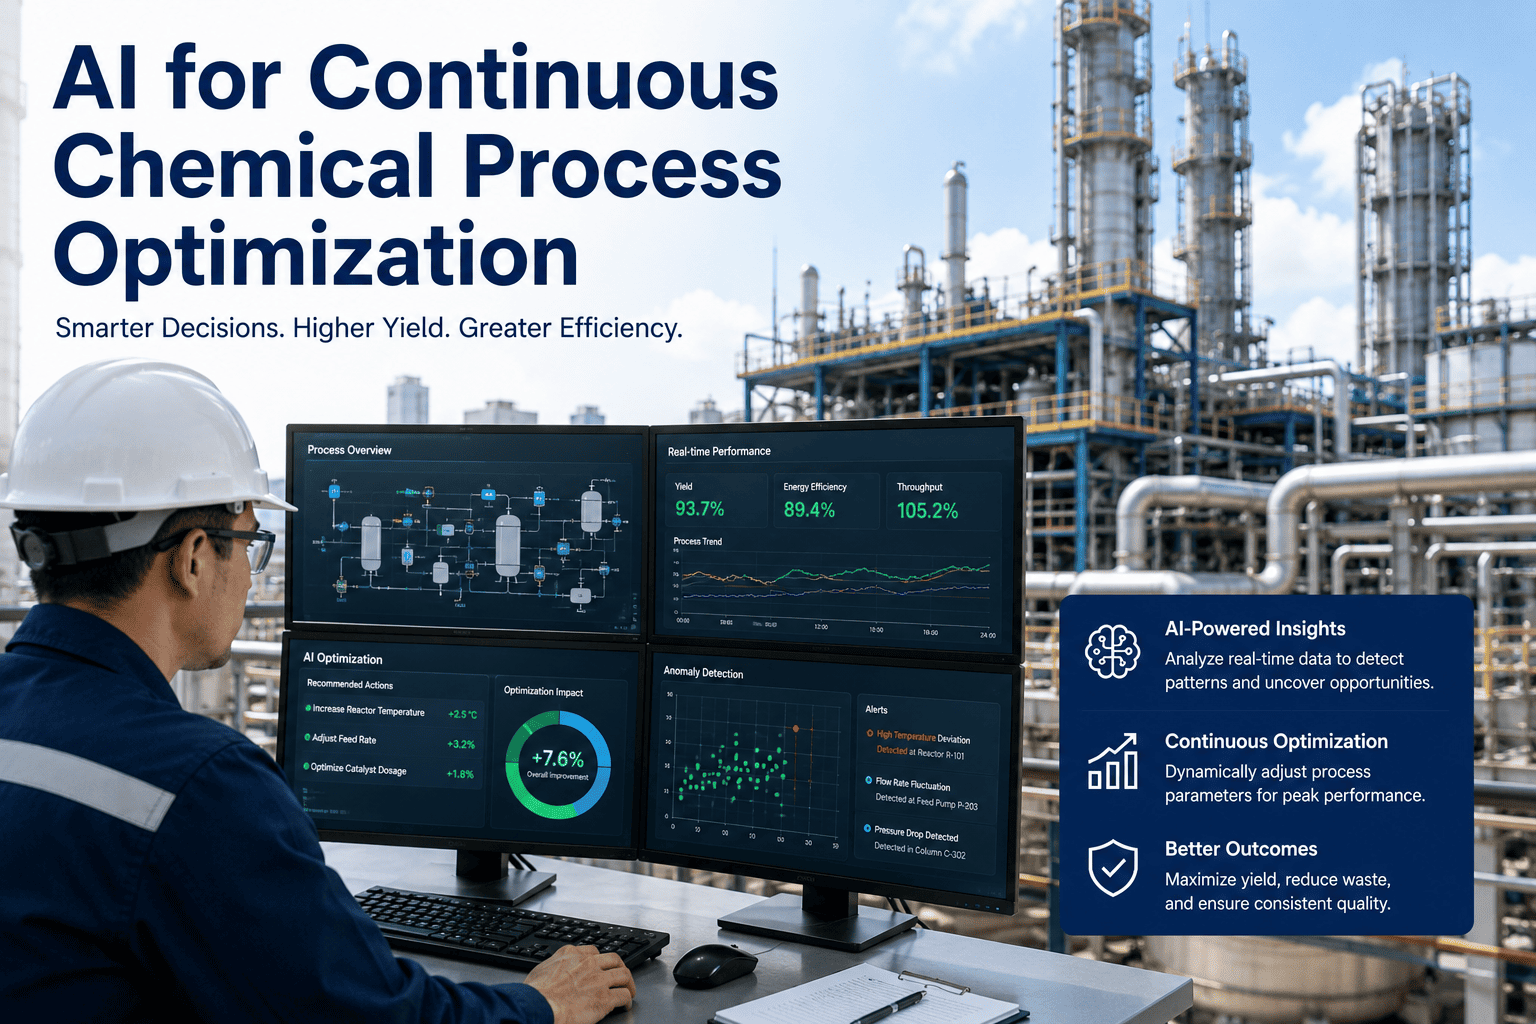
Two operators can run the exact same recipe on the exact same reactor, with the same catalyst lot and the same standard operating procedure, and still walk away with batches that differ in yield by five to eight percent. It isn't operator error and it isn't a broken recipe. It's dozens of small variables — feedstock moisture, catalyst age, ambient temperature drift, and the precise moment someone nudges a setpoint — quietly compounding across a six to twelve hour batch cycle. Most plants only discover something went wrong when the lab flags an out-of-spec result, usually two or three batches after the deviation actually began. Chemical manufacturers report losing an average of 13 to 29 percent of batch efficiency every year to exactly this kind of invisible variability. The rest of this page walks through where that loss actually comes from and what it takes to catch it early — or you can jump straight to a free batch data review and see it against your own reactors.
Chemical Manufacturing · AI Process Control
Same Recipe, Different Batch: What AI Sees That Your Batch Sheet Doesn't
Identical SOPs still produce batches that vary 3 to 8 percent in yield. AI models trained on your process history catch the drift while the batch is still running — not after the lab result comes back.
13-29%
Annual batch efficiency lost to undetected variability
6-18 hrs
Earlier warning before quality impact becomes measurable
3-8%
Typical yield improvement once drift is caught in time
Where the Missing Yield Actually Goes
Ask most plant managers why batches vary and they'll point to raw materials. That's part of it, but rarely the whole picture. Across biotech, specialty chemical and fine chemical batch reactors, the loss splits across four recurring sources — and no single one of them shows up clearly on a standard batch record, which is exactly why it survives review after review. A biotech chemical facility that reviewed its own historian data found four to six small, persistent fermentation inefficiencies rotating across a ten-batch train, none of them large enough on their own to trigger an alarm, together costing over half a million dollars a year. That's the pattern across most plants: the loss isn't one dramatic failure, it's a handful of quiet ones happening in parallel, every single batch.
Feedstock variability — moisture, purity, particle size shifting batch to batch (35%)
Catalyst age and degradation across a production campaign (25%)
Temperature and pressure drift inside the reactor envelope (22%)
Operator setpoint timing, judgment calls made under time pressure (18%)
Five Places Variability Hides in a Batch Cycle
01
The first thirty minutes
Heat-up rate and initial mixing set the trajectory for the entire batch. A reactor that heats 4% faster than the historical average rarely trips an alarm, but it shifts the reaction's endpoint hours later.
02
Catalyst mid-life
Fresh catalyst and end-of-life catalyst both get flagged. It's the middle of the campaign, when activity has quietly dropped 6 to 10%, that most conversion loss actually accumulates unnoticed, batch after batch, until a scheduled catalyst change finally resets the baseline.
03
Feed tank switchovers
Every time a feed tank changes, moisture and purity shift slightly with it. Static setpoints assume the incoming material is identical to the last batch. It rarely is.
04
Endpoint determination
Manual endpoint calls, made from periodic sampling, tend to run long as a safety margin. That margin costs cycle time and energy on every single batch, all year.
05
Shift-to-shift handoff
Different operators make different micro-adjustments under the same SOP. None of them are wrong, but the sum of small judgment calls is a major source of run-to-run spread.
How AI Closes the Gap
Traditional process control reacts to a setpoint being out of range. AI batch optimization works differently — it learns what a healthy batch trajectory looks like from hundreds of historical runs, then flags the moment a live batch starts drifting away from that pattern, long before any single variable crosses an alarm threshold.
1
Historian ingestion
Twelve-plus months of timestamped temperature, pressure, flow and composition data pulled from your existing PI or PHD historian, no rip-and-replace required.
→
2
Pattern modeling
Models learn the relationship between feedstock, catalyst state, and final yield across hundreds of past batches, including the ones that quietly underperformed.
→
3
Live deviation detection
Every running batch is scored against its expected trajectory in real time, catching multivariate drift 6 to 18 hours before it becomes a lab-confirmed deviation.
→
4
Recommended correction
Findings route to the DCS or batch management system as a specific setpoint adjustment, ranked by confidence, not a generic alarm the operator has to interpret.
Curious What's Hiding in Your Own Batch Records?
Our team can run a free read-only review of your historian data and show you exactly where your batch-to-batch variability is concentrated, before you commit to anything.
What Realistic Gains Look Like
The numbers below reflect what chemical manufacturers typically report after AI process optimization reaches steady state, drawn from plants running 12,000-liter batch reactors and continuous specialty lines alike. Results vary by process, but the direction is consistent across nearly every deployment.
Catalyst life extension
15-30%
Off-spec batch reduction
40-60%
Getting From Pilot to Production
Most chemical plants don't need to touch their DCS or batch management system to get started. A typical rollout runs in three stages, usually complete within eight weeks from kickoff to full deployment across a production train.
Weeks 1-2
Historian connection and baseline
Read-only connection to your existing historian. Models trained against your last 12 months of batch history to establish what a healthy run actually looks like on your specific process.
Weeks 3-5
Shadow mode validation
The model scores live batches alongside your current process without changing anything, so your team can compare its flags against actual lab results before trusting it.
Weeks 6-8
Live deployment
Recommendations route into the DCS or batch management system as actionable setpoint guidance, with a full audit trail for quality and regulatory review. Most plants keep an operator in the approval loop for the first several weeks before allowing fully automated adjustment.
It's Not Only a Yield Problem
Yield gets the attention because it's the easiest number to put in front of a board, but the same undetected variability that eats into yield is also what drives most out-of-spec investigations, rework, and the slow erosion of catalyst life that shows up as a rising cost line nobody can quite explain. When a model flags a fermentation or reaction trajectory drifting away from its historical norm six to eighteen hours before the lab would catch it, that early warning does three things at once: it protects yield, it prevents a batch from reaching out-of-spec status in the first place, and it gives quality and compliance teams a documented, timestamped audit trail instead of a retrospective deviation report written after the fact. Plants that treat this as a quality initiative rather than purely a cost initiative tend to see faster internal buy-in, because the reduction in formal investigations is something operations, quality, and finance can all agree on. Catalyst life extension follows the same logic — when the model can tell you a catalyst bed is degrading two weeks before conversion visibly drops, you replace it on a planned schedule instead of reacting to a yield problem that's already cost you several batches.
Where the Gains Are Biggest Across Batch Chemistry
Batch variability shows up differently depending on what's actually being made, and the size of the opportunity tends to track with how sensitive the chemistry is to small process shifts. These are the sub-sectors where plants most consistently report meaningful gains once AI batch optimization reaches steady state.
A
Specialty and fine chemicals
Small production volumes and tight purity specs mean a single underperforming batch is a much bigger percentage hit to the campaign, making early drift detection especially valuable here.
B
Biotech and fermentation
Living systems are inherently more variable than pure chemistry. Nutrient ratios, temperature profiles and dissolved oxygen all interact in ways that reward continuous pattern learning over static setpoints.
C
Agrochemical intermediates
Seasonal production campaigns mean long gaps between runs of the same product, so operator memory of the last campaign's quirks is often stale by the time the next one starts.
D
Pharmaceutical intermediates
Strict regulatory documentation requirements make the automatic audit trail from AI monitoring almost as valuable as the yield improvement itself, since it reduces the burden of retrospective deviation reports.
Frequently Asked Questions
Does this require replacing our existing DCS or batch management system?
No. AI batch optimization is deployed as an additional layer that reads from your existing historian, DCS, batch management, and LIMS systems rather than replacing any of them. Most chemical plants already have OSIsoft PI or Honeywell PHD historians in place, which is typically enough infrastructure to get started. The common gap is data quality and connectivity rather than missing hardware, and that gap gets addressed during the initial historian connection phase. To find out what your current setup supports,
reach out to our support team with your historian details.
How much historical batch data do we need before this works?
A useful starting point is roughly twelve months of timestamped process data at one-second to one-minute resolution for key variables like temperature, pressure, flow, and composition. That window is usually enough to capture seasonal effects, multiple catalyst campaigns, and a range of feedstock lots, which gives the model a realistic picture of what normal variation actually looks like versus what constitutes real drift.
Does this work for both batch and continuous chemical processes?
Yes, the same underlying approach applies to both, though batch processes tend to see larger relative gains because they exhibit more run-to-run variability than a continuous line running the same setpoints for months at a time. Continuous plants benefit more from real-time multivariable tuning, while batch plants benefit from catching drift within a single run before it reaches the lab. Book a
free consultation to discuss which pattern fits your specific process.
How long until we see a return on this investment?
Deployments in chemical manufacturing typically show ROI within four to seven months, combining yield improvement, energy reduction, and throughput gains from reduced cycle time. The exact timeline depends on your current variability levels, batch size, and how quickly your team moves from shadow-mode validation into live deployment, but most of the value shows up well before the twelve-month mark.
Will this create extra work for our quality and compliance teams?
It's designed to reduce that burden rather than add to it. Every recommendation the model produces comes with a full audit trail showing which variables drove the flag, which is easier for quality teams to review than a stack of retrospective lab deviations. Most teams find that catching drift earlier actually reduces the volume of formal investigations they have to run, since fewer batches reach out-of-spec status in the first place.
Find Out What's Costing You Before the Next Lab Report Does
The variability is already in your historian data. Our team can show you exactly where it's concentrated on your specific reactors, at no cost, before you decide anything.