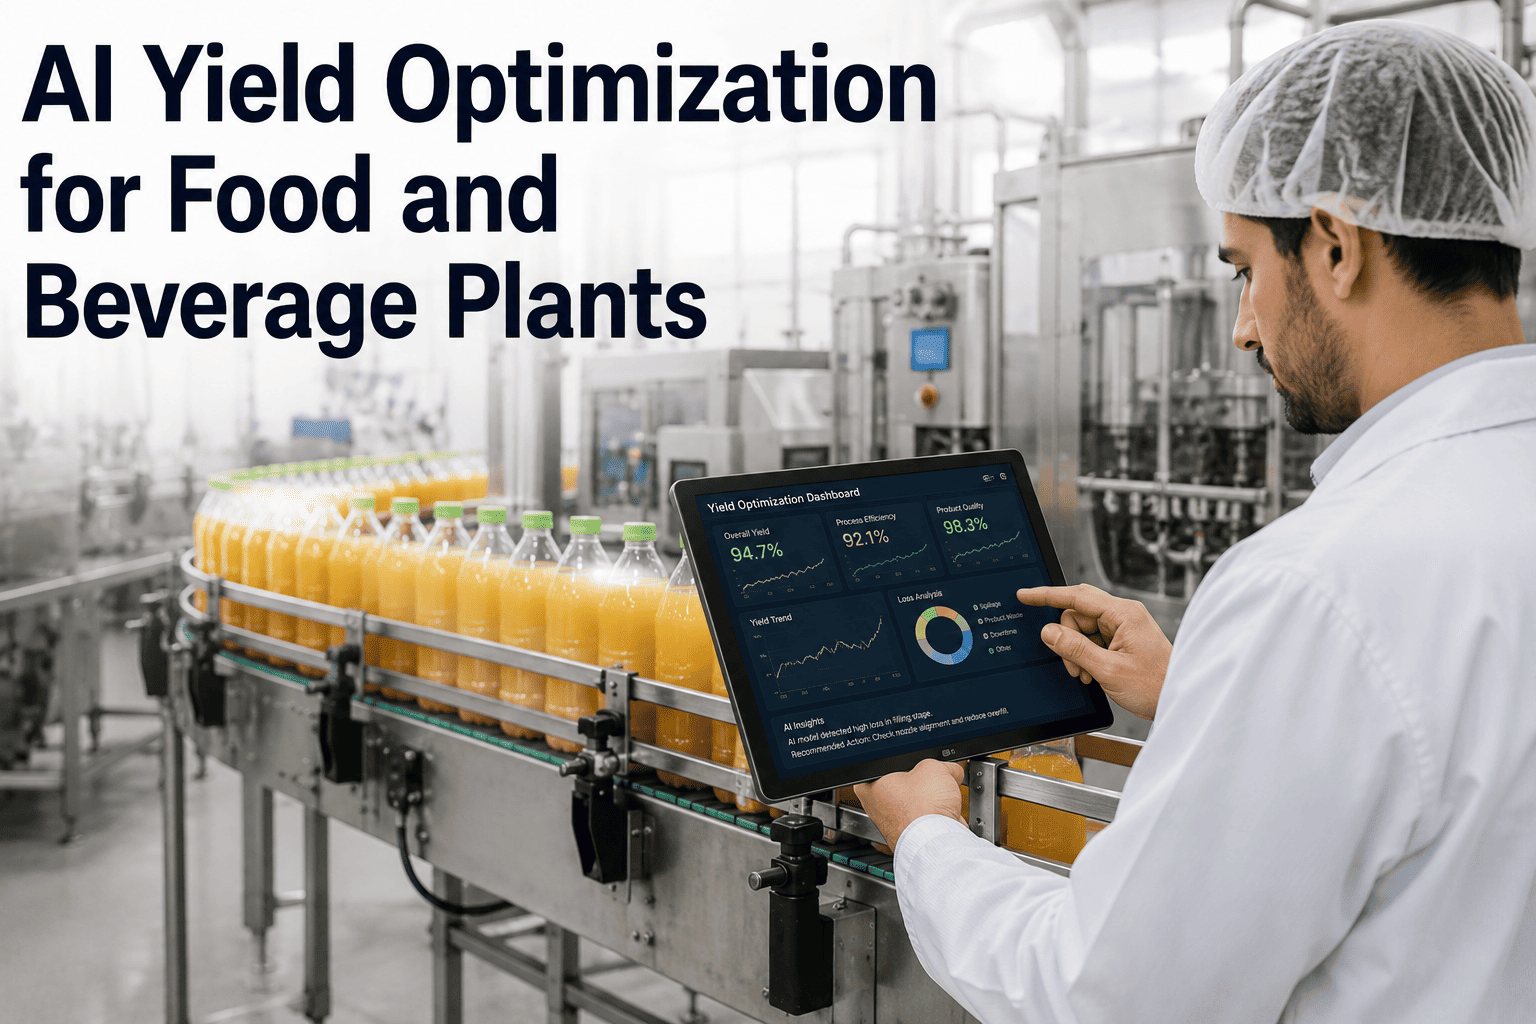
Every food and beverage plant loses between 1 and 3 percent of raw material yield in every batch cycle that operators do not actively tune in real time. Across a mid-size dairy, snack, or beverage operation processing thousands of tons annually, this invisible yield leakage translates to millions of dollars in wasted raw materials, energy, and labor that never appear on any standard variance report. Most F&B operations managers believe their yield is within acceptable limits because batch records show numbers close to target, but those numbers are based on end-of-batch measurements masking the real-time process drift responsible for the majority of yield loss. The gap between what plants think they yield and what AI-optimized processes can deliver is where the next wave of competitive advantage in food manufacturing is being built. To see exactly where your plant is losing yield and how AI recovers it, you can book a demo with our food manufacturing engineering team.
The Scale of Invisible Yield Loss Across F&B Sub-Sectors
Yield loss in food and beverage manufacturing is not a single event — it is a continuous, compounding drain that varies significantly by sub-sector, process complexity, and raw material value. The following benchmark data represents average yield loss ranges observed across F&B operations in 2025-2026, measured as the gap between theoretical optimal yield and actual achieved yield after accounting for known and acceptable process losses. What makes these numbers particularly significant is that 60-80% of this yield gap is recoverable through AI-driven process optimization — meaning the majority of what plants accept as normal loss is actually preventable with the right intelligence layer.
Where Yield Leakage Originates — Stage-by-Stage Process Analysis
Yield loss does not occur at a single point in the production process. It accumulates incrementally across every stage, with each stage contributing a different proportion of the total yield gap depending on the product type and process design. Understanding which stages contribute most to yield loss in your specific operation is the critical first step that determines where AI optimization delivers the highest return. The following breakdown shows typical yield loss contribution by process stage, based on aggregated data from F&B plants that have implemented real-time process monitoring.
Inaccurate weighing, over-portioning of ingredients, and raw material quality variation that goes undetected before processing begins. Pre-processing losses from trimming, cleaning, and sorting that exceed optimal benchmarks.
Inconsistent ingredient ratios due to manual batching errors, temperature drift affecting viscosity and blend uniformity, and over-mixing that degrades product structure. Transfer losses between mixing vessels and downstream equipment.
Moisture loss from over-processing, product degradation from uneven heat distribution, and evaporation losses that exceed recipe specifications. Batch-to-batch temperature profile variation in cooking, pasteurization, and frying operations.
Systematic overfill to maintain weight compliance, product spillage and drip loss during filling head changeovers, container variance that forces conservative fill targets, and product rejection from packaging defects that could have been prevented.
The Four-Stage AI Yield Optimization Cycle
AI yield optimization in food and beverage manufacturing operates as a continuous four-stage cycle that transforms raw sensor data into actionable process adjustments in real time. Unlike traditional control systems that maintain fixed setpoints, this cycle actively searches for the optimal combination of process parameters that maximizes yield while maintaining product quality specifications. Each cycle iteration improves model accuracy, creating a compounding optimization effect that delivers increasing yield improvement over time.
Real-Time Data Ingestion
Sensor data from mixing, heating, filling, and packaging equipment is continuously ingested at sub-second intervals. Temperature, pressure, flow rate, viscosity, weight, and speed parameters are synchronized with batch context data to create a complete process picture for every production cycle.
Process Deviation Detection
AI anomaly detection models compare real-time process parameters against yield-optimal operating ranges to identify deviations that are actively reducing yield. The system distinguishes between normal process variation and yield-impacting drift that requires intervention.
Predictive Setpoint Adjustment
When yield-impacting deviation is detected, the AI model calculates the optimal setpoint adjustment needed to return the process to its yield-maximizing operating range. Recommendations are generated with confidence scores and projected yield impact estimates.
Closed-Loop Optimization
Approved setpoint adjustments are executed automatically or with operator confirmation depending on the configured operating mode. Each adjustment outcome is fed back into the model, continuously improving prediction accuracy and optimization effectiveness.
Yield Recovery Potential by F&B Sub-Sector — 2026 Data
The following table presents yield recovery potential by food and beverage sub-sector, based on aggregated performance data from AI yield optimization deployments. Recovery rates vary by sub-sector due to differences in process complexity, raw material value density, and the degree to which yield loss is driven by optimizable process drift versus structural process limitations. The annual savings estimates assume a mid-size operation processing approximately 10,000 metric tons of raw material annually.
| Sub-Sector | Typical Yield Loss | AI Recovery Rate | Time to First Improvement | Annual Savings Est. (10K Tons) |
|---|---|---|---|---|
| Snack Manufacturing | 2.4 – 3.5% | 45 – 68% | 6 – 8 weeks | $320K – $680K |
| Dairy Processing | 2.1 – 3.2% | 40 – 65% | 7 – 10 weeks | $280K – $620K |
| Meat Processing | 2.0 – 3.0% | 30 – 55% | 8 – 12 weeks | $380K – $740K |
| Bakery Operations | 1.8 – 2.8% | 42 – 67% | 6 – 9 weeks | $200K – $460K |
| Beverage Plants | 1.5 – 2.6% | 50 – 72% | 5 – 8 weeks | $160K – $420K |
| Confectionery | 1.4 – 2.4% | 38 – 62% | 7 – 11 weeks | $240K – $510K |
| Sauce and Condiments | 1.2 – 2.5% | 48 – 70% | 6 – 9 weeks | $110K – $340K |
Traditional Yield Management vs AI-Driven Yield Optimization
The operational difference between traditional yield management and AI-driven optimization is not incremental — it is structural. Traditional approaches are fundamentally limited by their reliance on retrospective data and human-driven analysis cycles that cannot match the speed at which process drift occurs. AI-driven optimization eliminates this latency gap by operating continuously at the process timescale, detecting and correcting yield-impacting deviations in minutes rather than hours or days.
- End-of-batch yield calculated from final weight measurements after production is complete
- Process adjustments based on operator experience, shift notes, and tribal knowledge
- Fixed recipe setpoints changed only during scheduled product changeovers
- Monthly or weekly variance reports reviewed in management meetings after the fact
- Quality corrections made reactively after out-of-spec results are already detected
- Yield improvement driven by periodic Kaizen events with weeks-long analysis cycles
- Real-time yield tracked continuously from raw material input through finished output
- Automatic process adjustments driven by sensor data and validated AI models
- Dynamic setpoints optimized continuously within each batch cycle for maximum yield
- Live yield dashboards visible to operators, supervisors, and management simultaneously
- Predictive quality intervention initiated before out-of-spec conditions develop
- Continuous yield improvement through machine learning model refinement every cycle
Phased Deployment Roadmap for AI Yield Optimization in F&B Plants
Successful AI yield optimization deployment in food and beverage manufacturing follows a phased capability-building approach that delivers measurable ROI at each stage. Plants that attempt to deploy every capability simultaneously consistently underperform those that build sequentially — because each phase generates the data foundation and organizational trust required to unlock the full value of the next phase. The following roadmap reflects deployment patterns validated across F&B operations ranging from single-line facilities to multi-plant global networks.
Data Foundation and Process Mapping
Weeks 1 – 4
Map all yield-critical process parameters across production lines. Deploy sensors on mixing, heating, filling, and packaging equipment. Establish baseline yield measurements with automated data collection. Identify the top process variables with highest yield correlation.
Connected data infrastructure with baseline yield metricsReal-Time Yield Visibility
Weeks 5 – 10
Activate live yield tracking dashboards for each production line. Implement real-time process parameter monitoring against optimal ranges. Deploy automated alerting when process drift exceeds yield impact thresholds. Train operators on real-time yield data interpretation.
Live yield visibility replacing end-of-batch reportingAI Model Deployment and Validation
Weeks 11 – 20
Train AI models on accumulated process and yield data from Phase 2. Deploy predictive yield models on pilot production lines. Validate AI-recommended setpoint adjustments against actual yield outcomes. Refine models based on prediction accuracy and operator feedback.
AI-driven yield optimization active on pilot linesEnterprise Scale-Up
Weeks 21+
Extend validated AI models to all production lines and facilities. Activate cross-facility yield benchmarking and best practice propagation. Integrate yield optimization with maintenance scheduling and quality systems. Establish monthly yield improvement review cycles.
Enterprise-wide AI yield optimization with compounding ROIAI Yield Optimization for Food and Beverage — Common Questions
What causes yield loss in food and beverage manufacturing operations?
Yield loss in F&B manufacturing originates from multiple interconnected sources that compound across the production process. Raw material over-processing during mixing and blending, temperature drift during thermal processing that causes product degradation or evaporation, overfill during packaging to meet weight compliance requirements, and product loss during changeovers and line clearances all contribute to the cumulative 1-3% yield gap. Most of these losses are invisible to standard end-of-batch reporting because they occur as small, continuous deviations rather than discrete failure events. If you want to identify the specific yield loss sources in your operation, book a demo and our team will conduct a focused yield loss analysis for your plant.
How is AI yield optimization different from traditional process control systems like PLC and SCADA?
Traditional PLC and SCADA systems execute fixed control logic — they maintain setpoints that operators define and trigger alarms when parameters exceed hard thresholds, but they do not learn, adapt, or optimize. AI yield optimization sits above these control systems, analyzing the relationship between process parameter variations and actual yield outcomes to identify optimal setpoint combinations that traditional control logic cannot discover. The AI continuously refines its recommendations as more production data accumulates, creating a compounding improvement effect that fixed control systems cannot replicate. To understand how AI layers onto your existing PLC and SCADA infrastructure, book a demo to see the integration architecture in detail.
Which F&B sub-sectors see the fastest and largest yield improvement from AI?
Snack manufacturing and dairy processing typically see the largest absolute yield improvement because their processes involve high-value raw materials and multiple yield-sensitive stages including extrusion, frying, pasteurization, and homogenization. Beverage plants see fast initial improvement because filling accuracy is highly measurable and directly optimizable through AI-driven setpoint adjustment. Meat processing operations see significant value from AI optimization of cutting, grinding, and portioning operations where small weight deviations accumulate rapidly across high-volume production runs. For sub-sector specific yield benchmarks tailored to your product category, contact our support team for a detailed analysis.
How long does it take to deploy AI yield optimization in a food manufacturing plant?
Most food manufacturers achieve real-time yield visibility within 6-10 weeks of project initiation, which itself delivers immediate value by replacing end-of-batch reporting with live yield tracking. AI predictive model deployment typically completes within 16-20 weeks as the system accumulates sufficient labeled process data to train accurate models. Full enterprise-scale deployment across multiple production lines and facilities generally reaches completion within 24-32 weeks, depending on the number of lines, data infrastructure maturity, and organizational readiness for AI-driven operational changes. To get a deployment timeline specific to your operation, book a demo with our implementation engineering team.
Can AI yield optimization work for both continuous and batch manufacturing processes?
AI yield optimization is highly effective for both continuous and batch manufacturing, though the optimization approach differs between the two modes. In continuous processes like beverage filling or dairy pasteurization, AI optimizes steady-state process parameters in real time to minimize deviation from yield-optimal operating ranges throughout the production run. In batch processes like snack frying, sauce cooking, or bakery mixing, AI optimizes the trajectory of process parameters across the entire batch cycle — adjusting heating rates, mixing speeds, and timing to maximize final product yield while maintaining quality specifications. The data infrastructure and AI platform requirements are identical for both process types, making it practical to deploy yield optimization across mixed-mode F&B operations from a single platform. To see how AI handles both process types simultaneously, book a demo and request a mixed-mode demonstration.