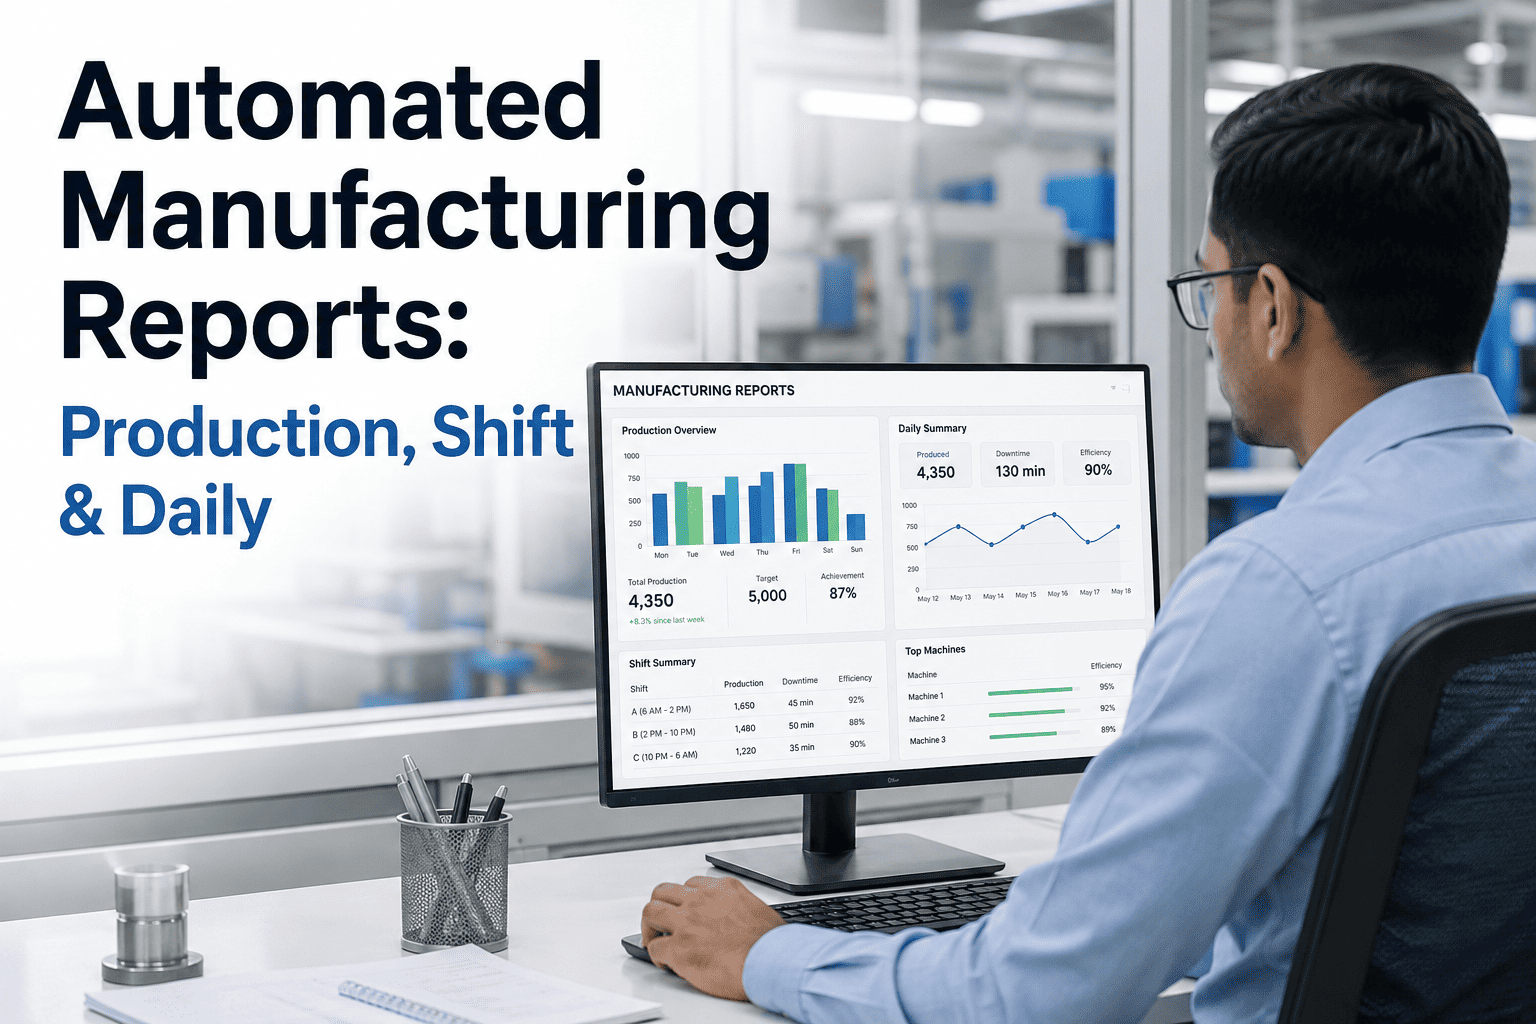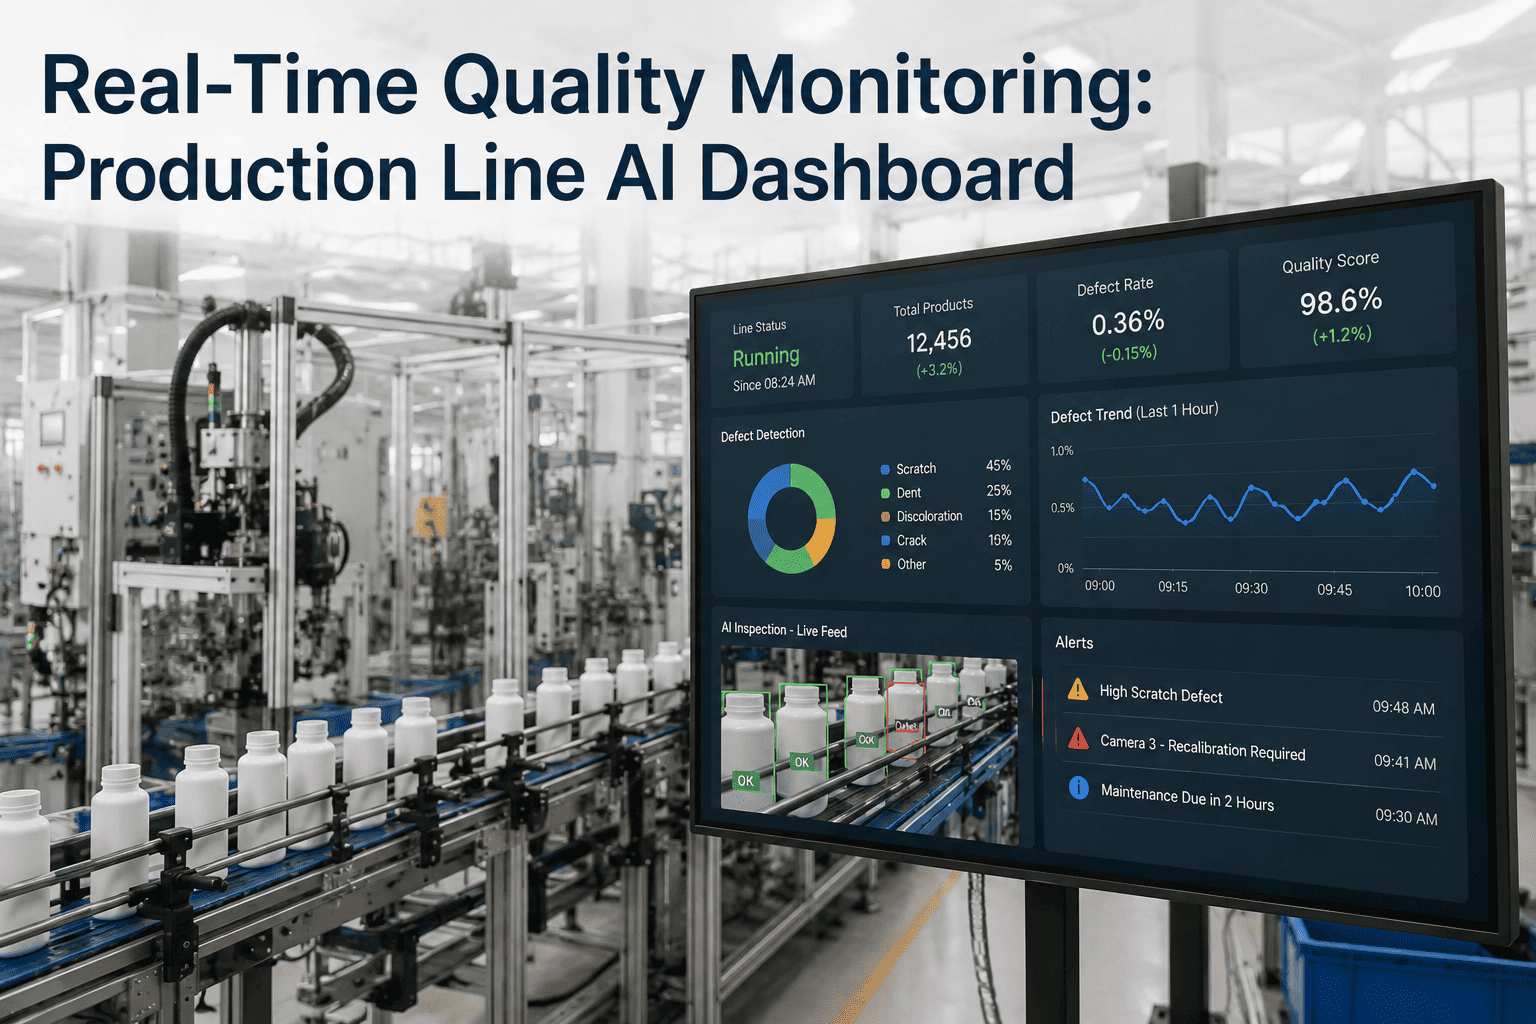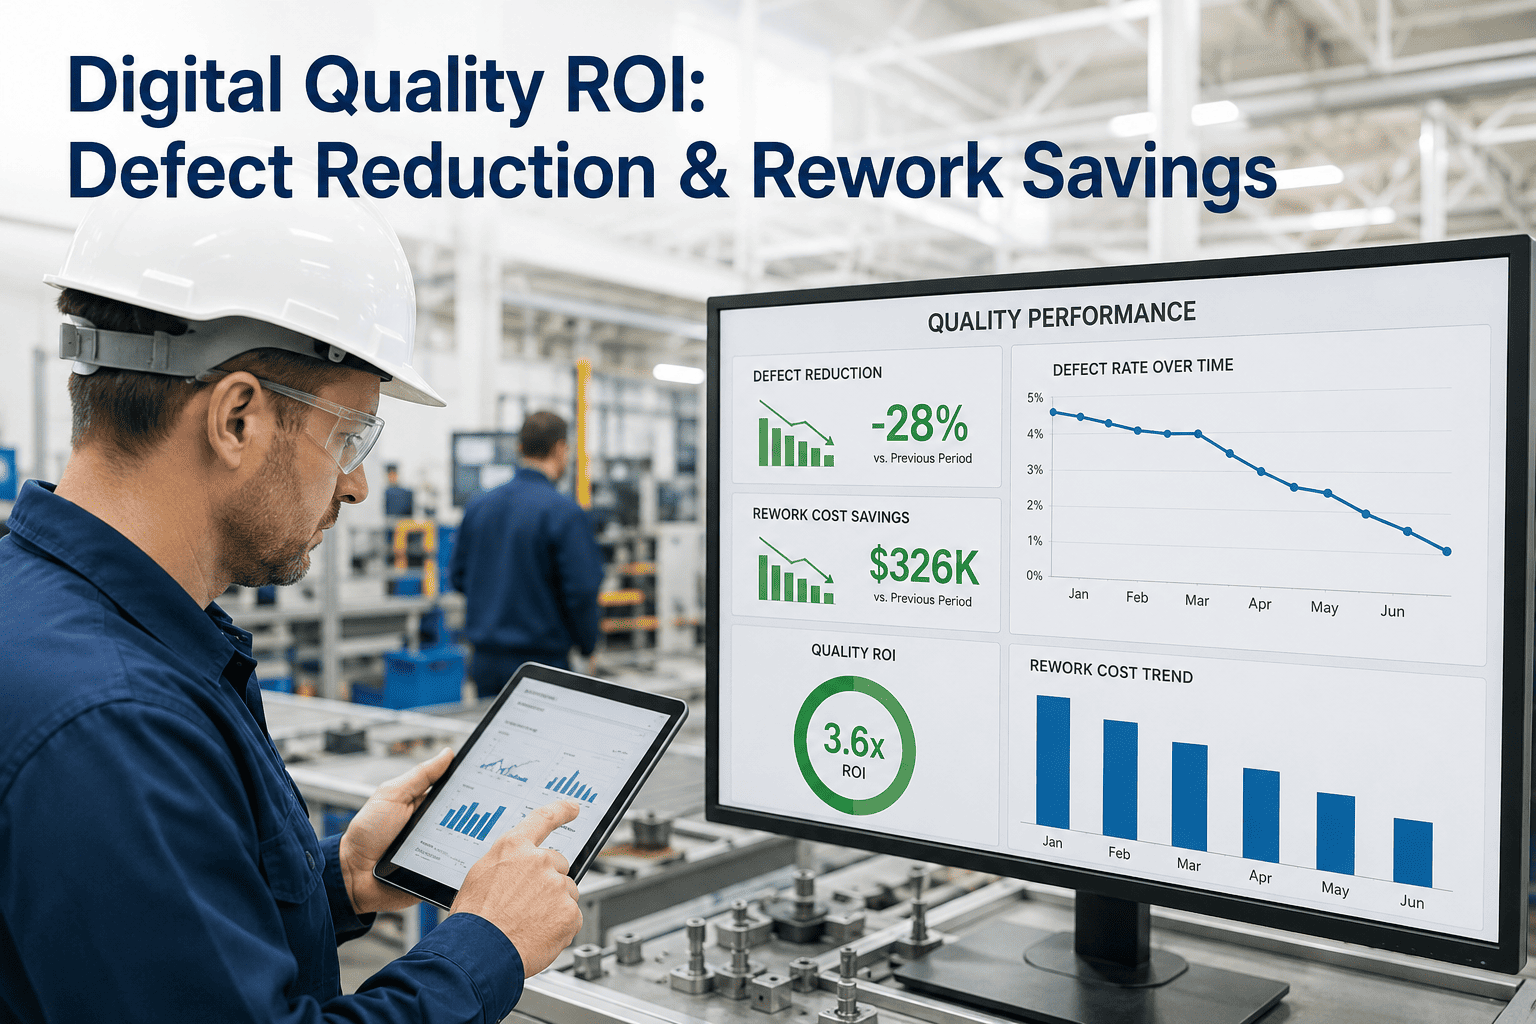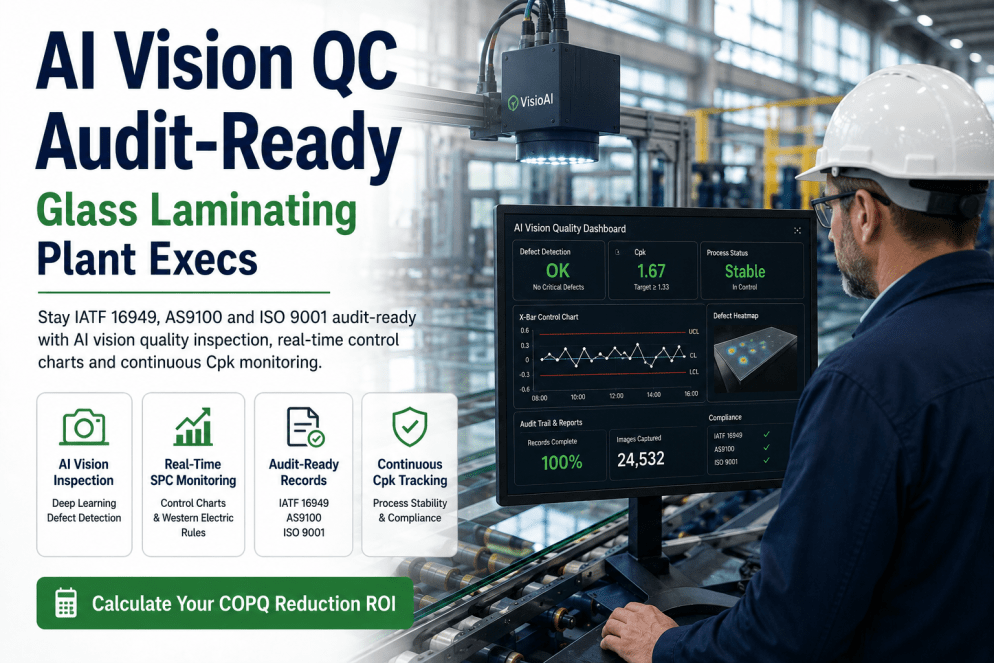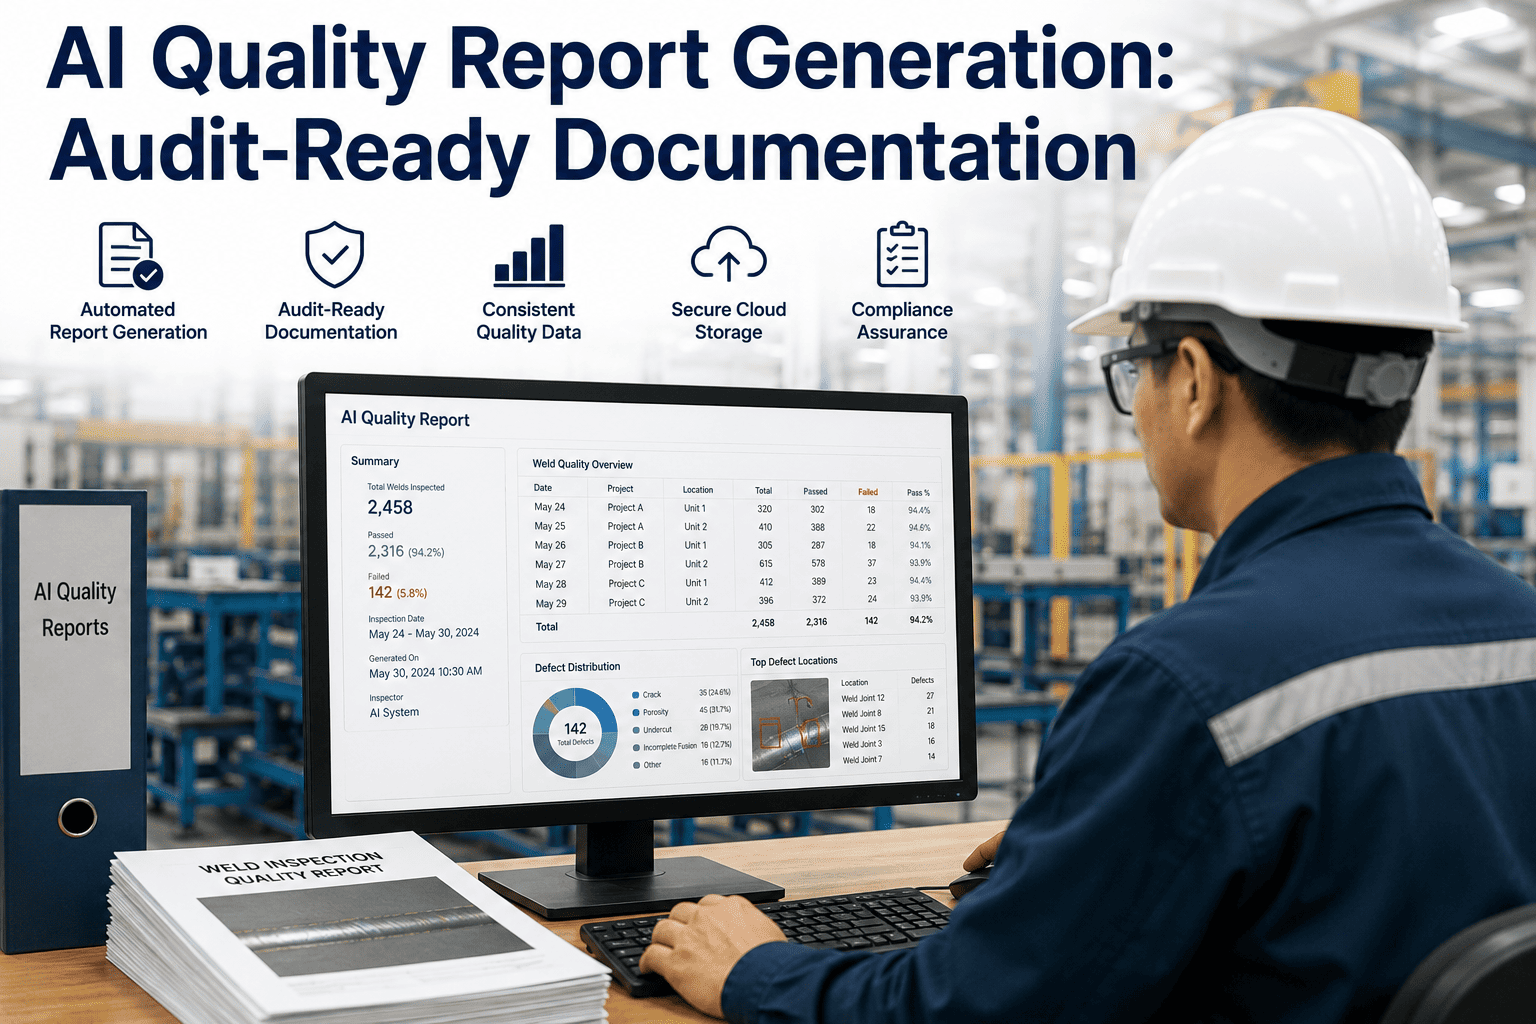
Quality reports are the one document every plant has to produce, and the one document almost no plant wants to build by hand. A typical audit-ready quality package pulls data from inspection records, SPC charts, CAPA logs, nonconformance reports, and supplier certifications, then assembles them into a format an auditor can actually follow. Most plants still do this assembly work in spreadsheets, copying numbers from one system into another, chasing sign-offs through email threads, and discovering missing data the night before an audit. AI quality report generation changes this by connecting directly to the data sources that already exist on your floor and producing audit-ready documentation automatically. More on how this works at iFactory's quality intelligence page.
Stop Building Quality Reports by Hand the Night Before an Audit
AI-powered quality report generation that pulls from inspection data, SPC outputs, and CAPA logs to produce audit-ready documentation without spreadsheet gymnastics.
The Manual Reporting Crisis on Every Quality Manager's Desk
Walk into any manufacturing quality department the week before a customer audit or ISO surveillance visit and you will find the same scene: a quality engineer exporting data from three different systems, pasting it into a spreadsheet template that someone built five years ago, manually calculating Cpk values that the SPC software already computed, and then spending hours formatting everything so it looks consistent. The data itself is not the problem. The problem is that it lives in disconnected silos, and no one has automated the bridge between raw inspection output and a finished, coherent document that an auditor can review without asking clarifying questions.
The consequences of this manual approach go beyond wasted time. When report generation is labor-intensive, plants produce fewer reports. When they produce fewer reports, trends go unnoticed. When trends go unnoticed, corrective actions get delayed, and small process drifts turn into large nonconformance events that show up on the audit anyway, just with more severity and more scrutiny. The audit does not care that you were busy. It cares that you did not have documentation showing you detected and addressed the issue earlier.
What an AI-Generated Quality Report Actually Contains
An audit-ready quality report is not just a data dump. It is a structured narrative that connects what you measured, what you found, what you did about it, and how you verified the fix worked. AI report generation does not invent this narrative. It assembles it from data points your plant is already capturing, but it does so in a way that follows the logical structure auditors expect to see. The difference between a spreadsheet compilation and an AI-generated report is the difference between a pile of lumber and a framed wall. The material is the same. The assembly is what makes it useful.
SPC Reports: From Manual Calculation to Automated Intelligence
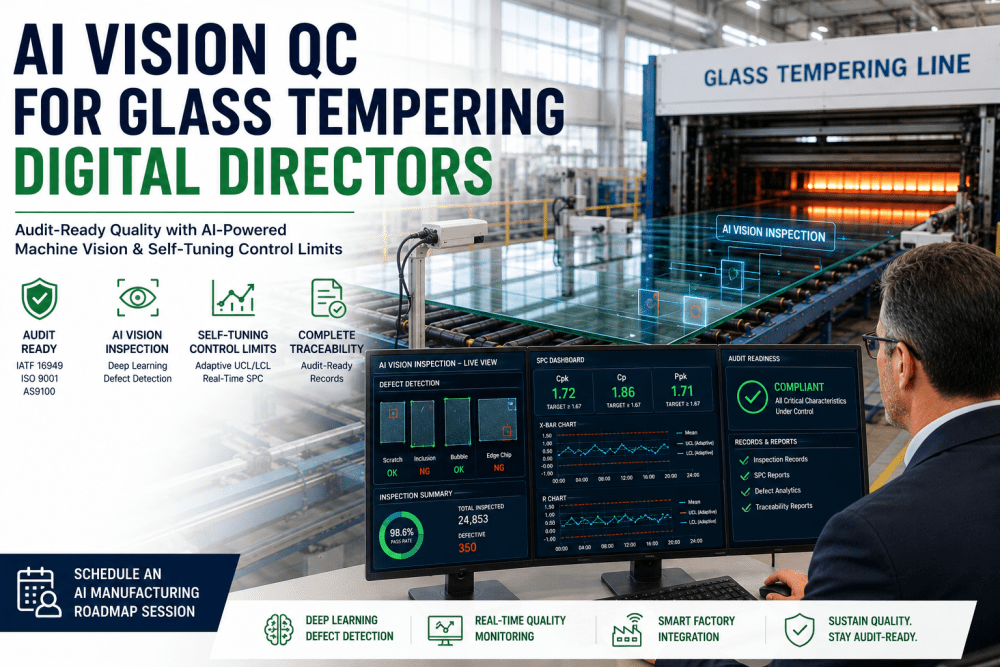
Statistical process control is where most plants feel the pain of manual reporting most acutely. The SPC software generates the charts, but someone still has to select the right data range, export the charts, annotate the out-of-control points, calculate capability indices for the correct subgroup size, and then paste everything into a document that explains what the numbers mean in plain language. That last step, the plain-language explanation, is where most manual reports fall apart because the person building the report is focused on getting the numbers right and does not have time to write analysis.
AI report generation handles the calculation, the chart selection, the annotation, and the narrative. It identifies which characteristics are trending toward out-of-control before they actually cross the limit, flags shifts in process centering that might not trigger a rule violation but indicate something changed on the line, and writes a summary paragraph that a quality engineer can review in thirty seconds instead of spending thirty minutes writing from scratch. The result is an SPC section that an auditor can read and understand without needing the quality engineer in the room to explain it.
CAPA Status Documentation: Closing the Audit Loop
Corrective and preventive action records are the single most audited element in virtually every quality management standard. ISO 9001, IATF 16949, AS9100, and FDA 21 CFR Part 820 all require documented evidence that identified nonconformances were investigated, that root causes were determined, that corrective actions were implemented, and that effectiveness was verified. When this documentation lives in a separate system from your quality reports, the audit becomes a scavenger hunt where the auditor asks for a CAPA and the quality team has to pull up a different application, find the record, and then try to connect it to the nonconformance referenced in the report.
AI quality report generation pulls CAPA status directly into the report structure. Open CAPAs appear with their current age, assigned owner, and last activity date. Closed CAPAs include the verification-of-effectiveness evidence alongside the original nonconformance. The AI also performs an aging analysis that highlights CAPAs approaching or exceeding the plant's own closure timeline targets, which gives the quality manager a pre-audit view of exactly where the auditor is going to focus attention. This does not eliminate the need to actually close the CAPAs, but it eliminates the surprise of discovering during the audit that a CAPA everyone thought was closed is actually missing its verification evidence.
Want to see what your CAPA aging report would look like generated automatically? Book a walkthrough with our quality team.
The Audit-Ready Documentation Framework
Audit readiness is not a single state you achieve the week before a visit. It is a continuous condition that exists when your documentation is always current, always traceable, and always structured in a way that an external reviewer can navigate without guidance. The problem with manual reporting is that it makes audit readiness a periodic event rather than a steady state. Reports get built when an audit is scheduled, which means the documentation only accurately reflects the plant's quality position at specific points in time rather than continuously.
AI report generation shifts this dynamic by producing documentation on a continuous cadence, whether that is daily shift summaries, weekly quality reviews, or monthly management reports. Each report builds on the previous one, creating a documented chain of quality performance that an auditor can follow chronologically without gaps. When the audit date arrives, the quality team is not scrambling to assemble evidence. They are reviewing a body of documentation that has been building itself in the background, and their only task is to verify completeness rather than create it from nothing.
Production Quality Summaries: From Shift Level to Plant Level
One of the most valuable outputs of automated quality reporting is the ability to generate quality summaries at different levels of granularity without extra effort. A shift supervisor needs to see the quality performance of their specific line during their specific shift. A plant manager needs to see how quality is trending across all lines over the past month. A customer quality engineer needs to see how their specific part numbers are performing over the past quarter. With manual reporting, each of these views requires a separate compilation effort. With AI generation, the same underlying data produces all three views with different filters and aggregation levels applied automatically.
The practical impact of this is that quality communication within the plant improves dramatically. Shift handoffs include a quality summary that was generated ten minutes before the handoff rather than one that was assembled at the end of the previous day. Management review meetings start with a current quality dashboard rather than a report that was compiled a week ago and is already stale. Customer quality inquiries can be answered with a part-specific quality summary generated on demand rather than a promise to pull the data and email it later. Each of these improvements sounds small in isolation, but together they change the quality culture from reactive documentation to proactive communication.
Manual vs Automated: What Actually Changes
The easiest way to understand the value of AI report generation is to look at the specific tasks that disappear from a quality engineer's workflow and what replaces them. The data analysis does not change. The standards requirements do not change. What changes is the mechanical labor of moving data from where it lives into a format someone else can read and evaluate. That mechanical labor is where most of the time goes, and it is where most of the errors get introduced.
| Task | Manual Approach | AI-Generated Approach | Time Difference |
|---|---|---|---|
| SPC Chart Assembly | Export from SPC software, resize, paste into document, add annotations | Charts auto-generated with rule violations annotated and capability indices calculated | 45 min to 2 min |
| CAPA Status Compilation | Query CAPA database, filter by date, copy status fields, format into table | CAPA status pulled automatically with aging analysis and closure evidence linked | 60 min to 1 min |
| First-Pass Yield Calculation | Pull inspection counts from MES, calculate yield per line, build comparison table | Yield calculated continuously, trends plotted, exceptions flagged automatically | 30 min to instant |
| Nonconformance Summary | Filter NCR log by date range, categorize by type, copy descriptions into report | NCR summary auto-categorized with Pareto ranking and trend direction indicated | 40 min to 1 min |
| Report Formatting and Layout | Adjust margins, headers, fonts, page breaks, and section ordering manually | Template applied automatically with consistent layout, branding, and section structure | 90 min to instant |
| Review Routing and Approval | Email report as PDF, track responses, follow up on missed reviews | Workflow routing with automatic reminders and digital approval capture | 30 min to 5 min |
Report Types and What Each One Covers
Not every quality report serves the same audience or the same purpose. An internal shift summary has different requirements than a customer-facing quality performance report, and an ISO surveillance audit package has different requirements than both. AI quality report generation handles this by maintaining multiple report templates that draw from the same underlying data but structure it differently based on the intended audience and use case. The quality engineer does not build three separate reports. They select the report type, confirm the date range, and the system assembles the appropriate structure with the right level of detail for each audience.
How Report Generation Works in Practice
Implementing AI quality report generation does not require replacing your existing quality management system or your SPC software. The platform connects to the data sources already in place through standard integrations, reads the inspection results, process data, and quality records as they are produced, and applies a reporting engine that assembles them into structured documents on a scheduled or on-demand basis. The quality team's existing workflows for data entry and investigation do not change. What changes is what happens after the data is entered: instead of sitting in a database until someone decides to build a report, the data flows into a reporting pipeline that produces documentation continuously.
Compliance Coverage by Standard
Different quality management standards have different documentation requirements, and plants operating under multiple standards often have to maintain separate report packages for each. AI quality report generation handles this by understanding which data elements each standard requires and structuring the output accordingly. A single set of underlying quality data can produce an ISO 9001 management review package, an IATF 16949 customer-specific report, and an AS9100 aerospace audit package without tripling the reporting effort.
| Standard | Key Documentation Requirement | How AI Reporting Addresses It |
|---|---|---|
| ISO 9001:2015 | Management review inputs including customer satisfaction, process performance, and audit results | Automated compilation of all management review inputs from connected data sources with trend analysis and comparison against quality objectives |
| IATF 16949:2016 | Customer-specific reporting, PPM delivery performance, and warranty data analysis | Part-number-level quality reports with PPM calculations, warranty claim integration, and customer-specific KPI dashboards generated on schedule |
| AS9100 Rev D | Configuration management documentation, traceability to drawing requirements, and special process records | Traceability matrices linking inspection results to drawing callouts, special process status tracking, and configuration baseline documentation |
| ISO 13485:2016 | Product realization records, risk management file outputs, and post-market surveillance data | Device history records assembled from production and inspection data, risk review summaries, and complaint trend analysis integrated into quality reports |
| 21 CFR Part 820 | DHR completion, device master record accuracy, and CAPA effectiveness verification | Device history reports auto-assembled from production records, DMR verification checklists, and CAPA closure packages with effectiveness evidence |
What Quality Teams Actually See Day to Day
Beyond the reports themselves, the daily operational impact of AI report generation shows up in smaller but cumulative ways. Quality engineers stop spending the first hour of their day exporting data and start their day reviewing a report that was already waiting for them. Shift handoffs become more structured because the outgoing supervisor hands over a quality brief that was generated minutes earlier rather than relying on verbal summaries that may or may not cover the important details. When a customer calls with a quality question, the answer can be pulled from the archive in minutes rather than hours, and the response includes the full supporting data rather than a verbal summary that the customer has to take on faith.
The less obvious benefit is the improvement in data quality over time. When quality engineers know that inspection data is going to flow directly into automated reports, they become more careful about data entry accuracy because errors are no longer buried in a spreadsheet that only gets looked at once a month. The transparency that automated reporting creates has a disciplining effect on the data collection process itself, which means the reports get better as the system runs longer, creating a positive feedback loop that manual reporting can never achieve.
Frequently Asked Questions
See What Your Quality Reports Would Look Like Generated Automatically
Share a sample of your current report output. We will show you the AI-generated version with the same data before you commit to anything.