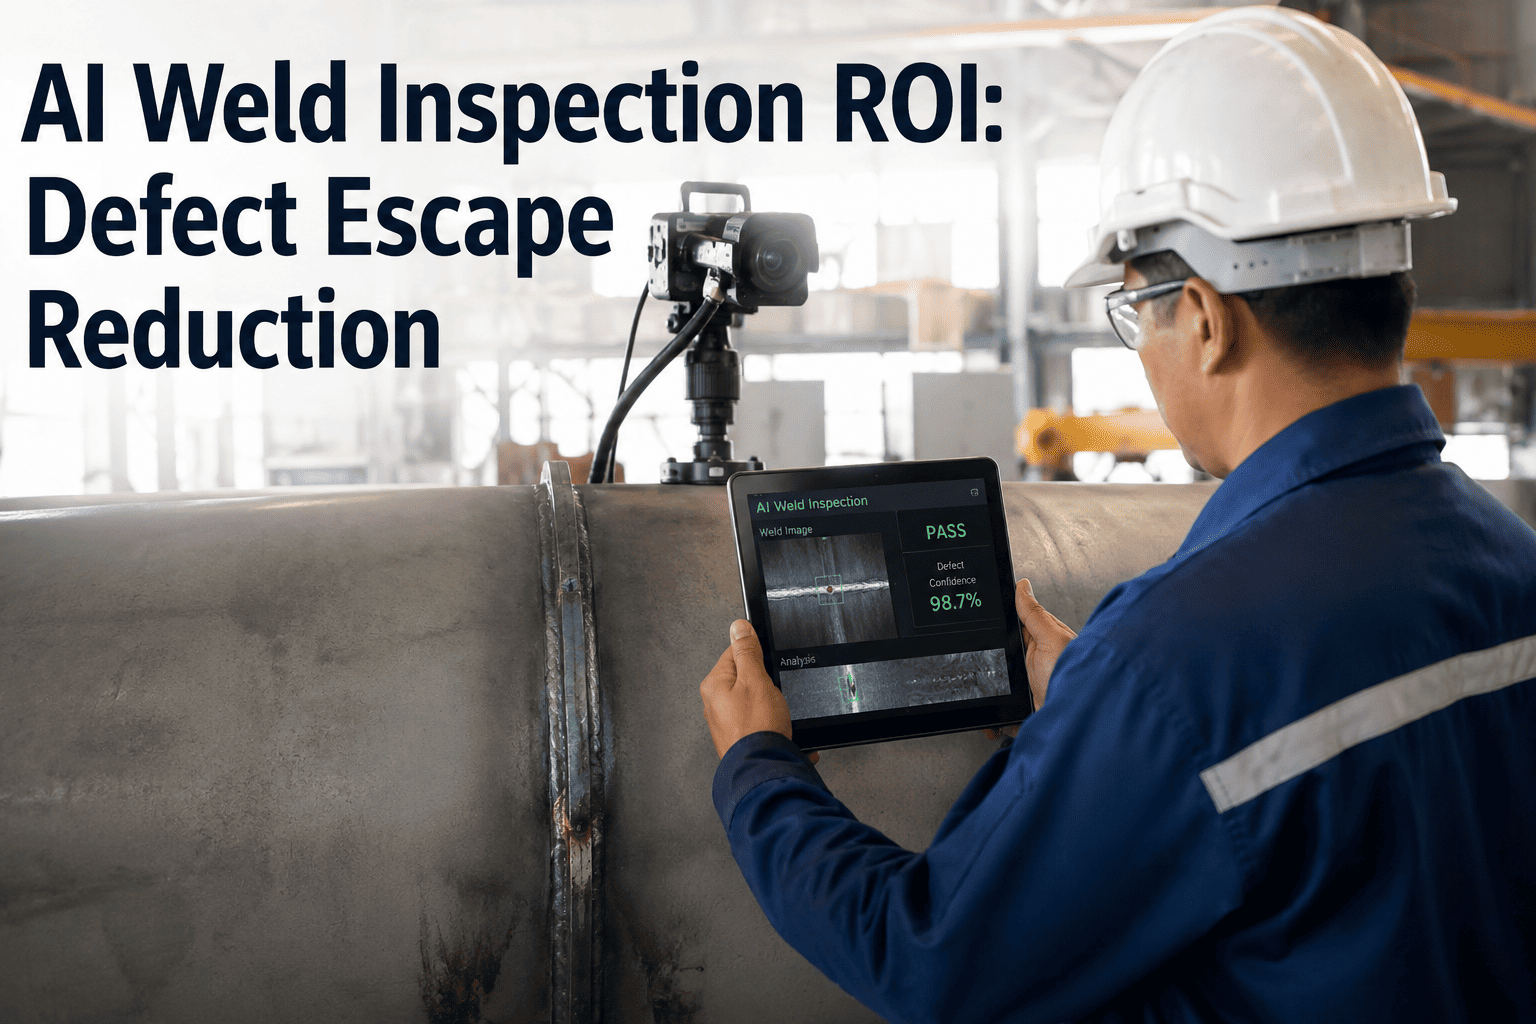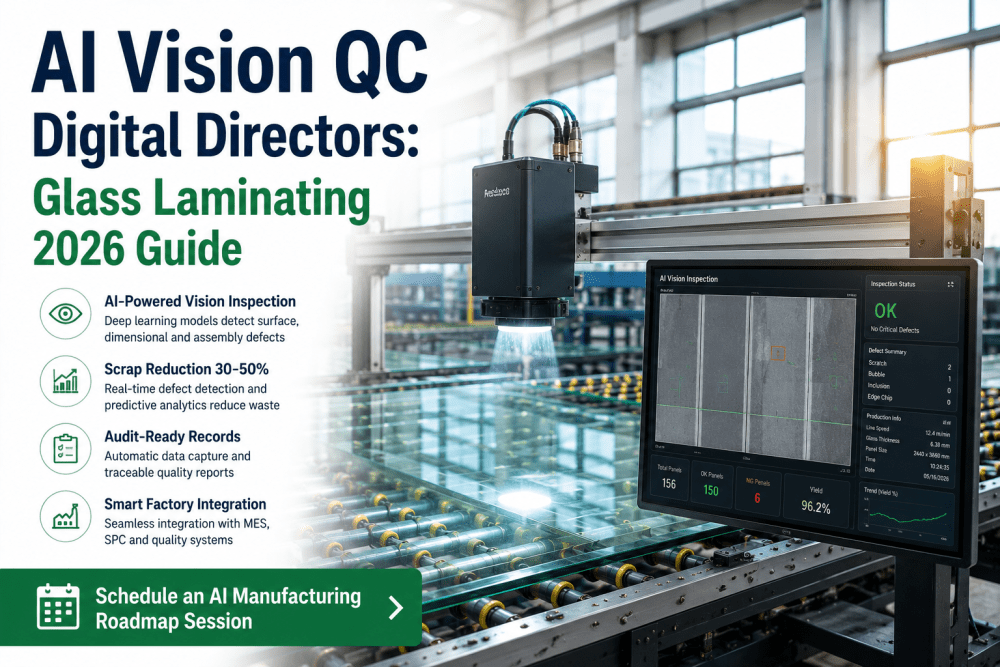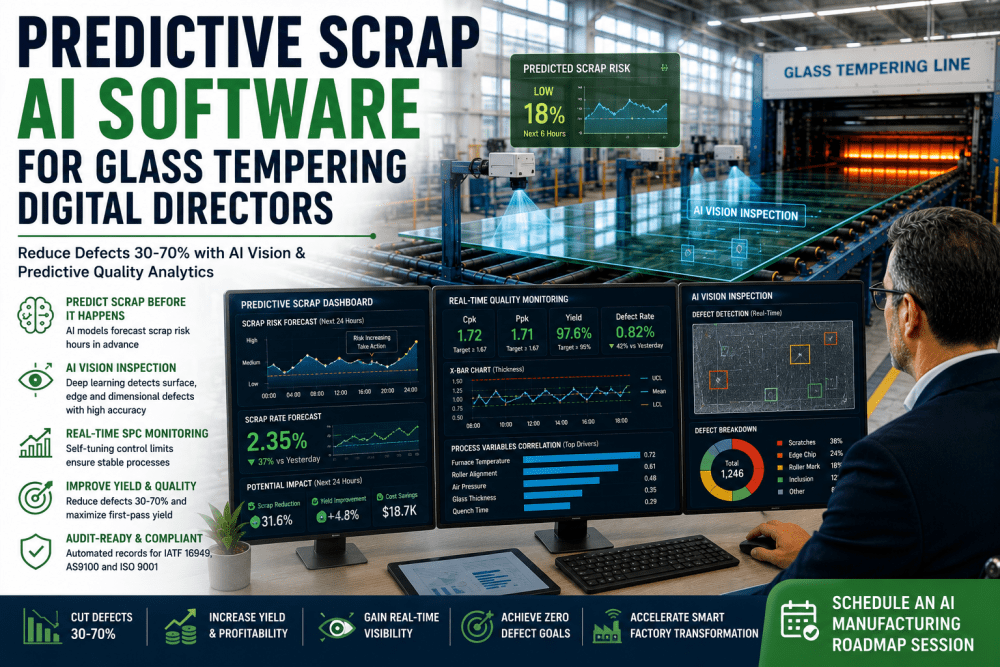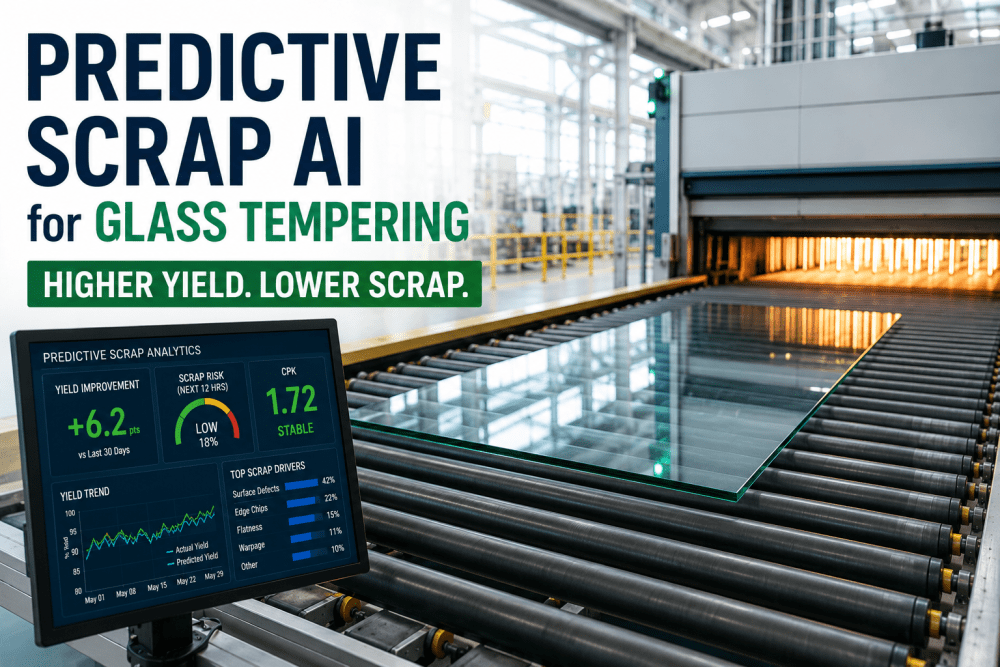
A single missed defect rarely shows up as one line item on a P&L statement, which is exactly why quality costs are so easy for a plant to underestimate for years at a stretch. It shows up as a customer return three weeks later, a line stoppage to sort suspect stock, an overtime shift to rework a pallet that should have shipped clean the first time, and a scrap tag that never gets rolled up into a single number anyone reviews. Reliability and quality leaders who do roll it up are usually surprised by the size of it, which is the whole reason iFactory's digital quality inspection platform exists: to make that hidden cost visible, then shrink it.
The defect you catch on the line costs a fraction of the one your customer finds
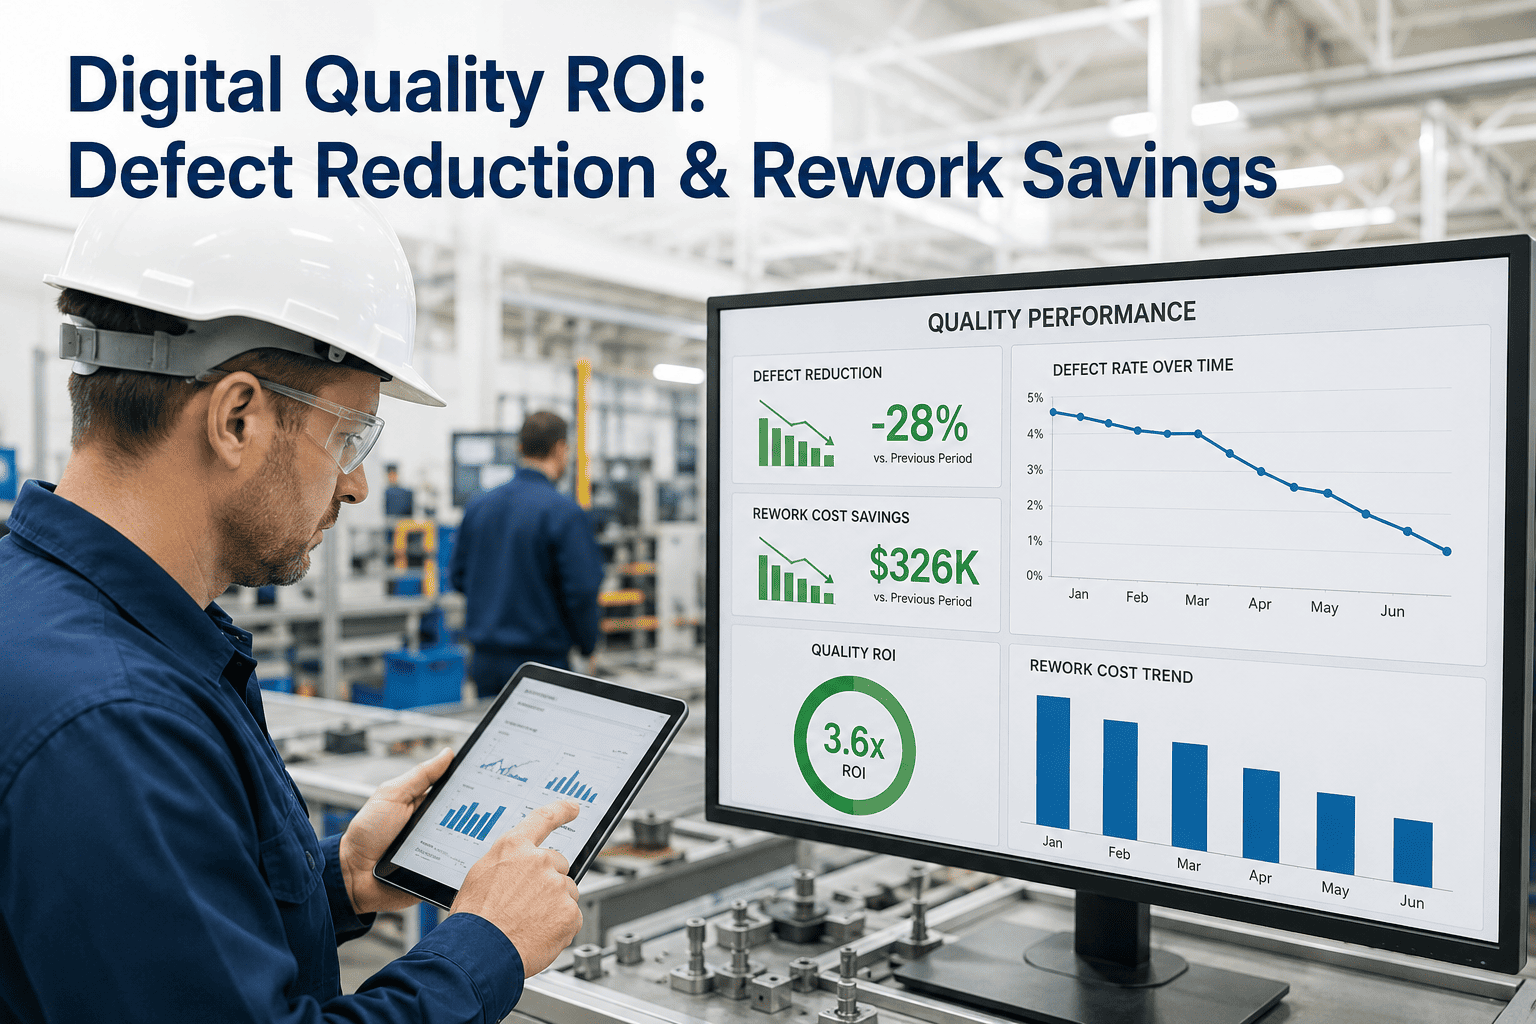
AI vision inspection, automated SPC, and digital inspection records replace subjective spot checks with a consistent, documented standard applied to every single unit, and the ROI shows up in defect rate, rework hours, and scrap within a single quarter.
Quality cost has four faces, and most plants only track one
Ask a plant manager what quality costs, and the answer is almost always scrap weight times material cost, because that number is easy to pull from an ERP report. The larger costs are quieter: the labor spent sorting and reworking marginal product, the premium freight paid to expedite a replacement shipment, the engineering hours spent on a containment investigation, and the slow erosion of a customer relationship after a repeat complaint. Digital inspection systems matter because they attack all four categories at once, not just the material line.
Manual inspection was never built to catch everything
A human inspector working a repetitive visual check loses measurable accuracy after the first twenty minutes of a shift, and that isn't a training problem, it is how attention works. Add line speed increases, lighting variation, and inspector rotation across shifts, and even a well-run manual quality station ends up applying a slightly different standard every few hours. None of this is a criticism of inspectors, who are usually catching what a fatigued human reasonably can. It is a structural limitation that only a consistent, tireless system can close.
| Inspection Approach | Consistency | Coverage | Record Created | Scales With Line Speed |
|---|---|---|---|---|
| Manual visual spot-check | Drifts by shift and fatigue | Sampled, not full lot | Paper or none | No |
| Manual 100% inspection | Drifts by shift and fatigue | Full lot | Paper or spreadsheet | Limited |
| Fixed-rule machine vision | Consistent per rule set | Full lot | Digital, rule-based | Yes |
| AI vision inspection | Consistent, learns edge cases | Full lot | Digital, timestamped, searchable | Yes |
From first camera to documented savings
Baseline the current defect rate
Two to three weeks of historical scrap, rework, and complaint data set the number every future report gets measured against.
Install and calibrate vision stations
Cameras trained on your actual defect library, not a generic model, so the system recognizes your specific failure modes from day one.
Run in shadow mode
The system flags defects alongside your existing process without stopping the line, building operator trust before it takes over the call.
Go live with automated SPC
Control charts update in real time, and any drift toward a defect trend triggers an alert before the lot is fully built.
Most plants have no idea what their real defect escape rate is until they see it measured against every unit instead of a sample. Book a demo and we'll baseline your current line against your own production data.
A defect nobody can trace back is a defect that repeats
When inspection records live on paper checksheets or in a spreadsheet an inspector fills in at the end of a shift, the connection between a specific defect and the exact process conditions that caused it usually gets lost. Digital inspection records timestamp every image, every measurement, and every operator action, which means a quality engineer chasing a root cause can pull up the exact frame where a defect first appeared instead of reconstructing a shift from memory. That traceability is what turns a one-time fix into a permanent one, because the same failure mode stops reappearing three months later under a different work order.
It also changes how customer audits and supplier reviews go. Instead of pulling a binder and hoping the right checksheet is in it, a quality manager can generate a full inspection history for any lot number in minutes, which shortens audit cycles and builds the kind of documented consistency that customers increasingly require before awarding new business.
What plants report after two quarters
Why one inspection station is the right place to start
Quality is one of the easiest digital pilots to justify because the baseline already exists in your scrap, rework, and complaint data, which means the before-and-after comparison writes itself without any new tracking infrastructure. A single high-value inspection station, usually the one right before final pack or right after the most defect-prone process step, is enough to prove the model against your own defect library before any conversation about a plant-wide rollout.
The pilot also tends to pay for the rest of the rollout. Plants that run a focused six to eight week pilot on one station typically use the documented rework and scrap savings from that single station to fund expansion to the next two or three stations, which is a much easier budget conversation than requesting a full capital outlay up front.
What AI vision actually catches on an automotive line
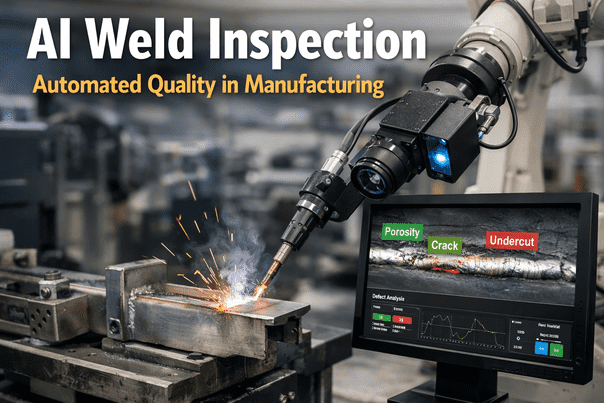
Surface defects like scratches, dents, and paint inconsistencies get most of the attention because they're the easiest to picture, but they're often not the most expensive category of miss. Dimensional variation, missing fasteners, incorrect part orientation, and incomplete weld beads tend to cause the field failures that trigger a full recall investigation rather than a single customer return, which is why a serious inspection deployment covers more than cosmetic checks.
Each of these categories requires a different camera angle, lighting setup, and reference model, which is why a station-by-station calibration process matters more than the number of cameras installed. A plant that tries to cover all four categories with a single generic camera setup usually ends up with strong cosmetic detection and weak dimensional or assembly detection, missing exactly the defect types most likely to become a warranty claim.
Not every inspection point makes an equally strong pilot
The instinct is often to start wherever the most defects are currently being caught by hand, but that's not always the strongest pilot choice. The best first station is usually the one right before a point of no return, meaning the last checkpoint before a part gets painted over, sealed into an assembly, or shipped, because that's where catching a defect saves the most downstream rework and where the ROI case is clearest to leadership.
A second consideration is data availability. A station with a well-documented history of defect types, rework hours, and scrap tickets gives the pilot a clean baseline to measure against, while a station with sparse records makes it harder to prove the before-and-after case even if the underlying defect reduction is real. Combining "last chance before high cost" with "best existing data" is usually how the strongest first station gets chosen.
Digital inspection, explained plainly
See what your current defect rate is actually costing you
iFactory turns scattered scrap and rework data into one clear ROI picture, then shows you exactly where AI inspection would close the gap first.