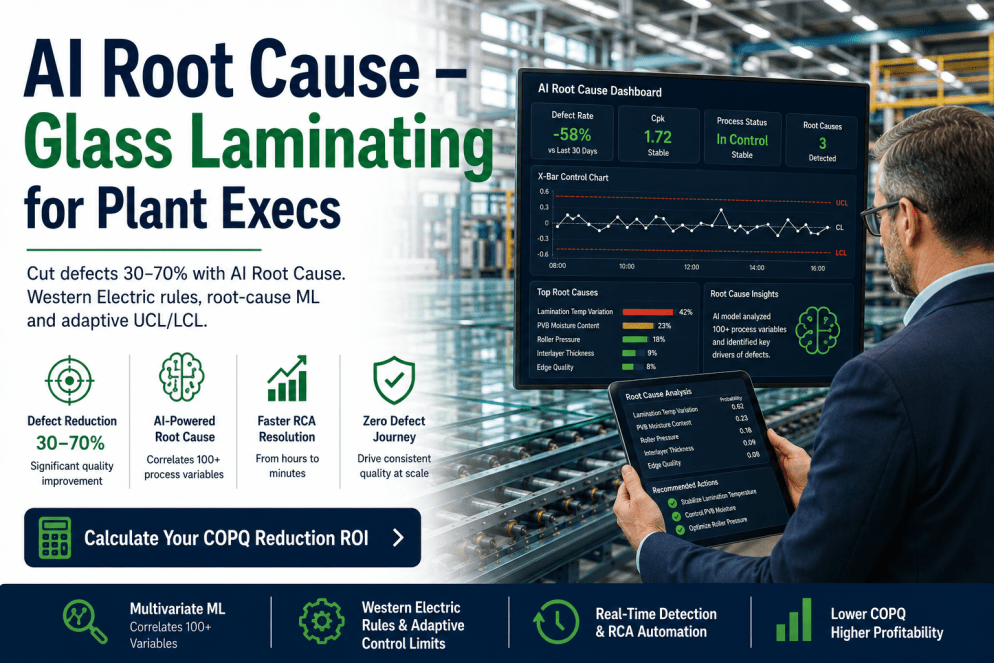
AI root cause detection for glass laminating combines machine learning, multivariate analytics, and real-time process intelligence to identify hidden defect causes before they generate scrap. For digital manufacturing directors, this means moving from reactive firefighting to predictive quality control across the entire laminating line. This guide explains how AI-driven root cause analysis transforms scrap reduction, improves first-pass yield, and strengthens smart factory quality intelligence. Digital manufacturing directors evaluating next-generation quality systems Book a Demo to see AI root cause detection in live glass laminating environments.
What Is AI Root Cause Detection in Glass Laminating?
AI root cause detection applies machine learning algorithms to multivariate process data — temperature profiles, nip roller pressure, interlayer moisture content, glass thickness variation, line speed, and ambient conditions — to automatically identify the true drivers of laminating defects. Unlike traditional root cause analysis that relies on engineer intuition and manual data correlation, AI systems continuously scan all process variables simultaneously, detect subtle interaction effects, and rank potential causes by statistical confidence. Digital manufacturing directors exploring automated root cause analysis Book a Demo to see how iFactory AI connects with existing line data sources.
| Capability | Traditional Root Cause Analysis | AI Root Cause Detection |
|---|---|---|
| Data Sources | Manual logbooks, basic SPC charts, operator observations | All process variables, quality test results, equipment sensors, environmental data combined in real time |
| Detection Speed | Days to weeks — data gathering and manual correlation dominate the timeline | Minutes to hours — automated analysis delivers ranked causes within the same shift |
| Interaction Effects | Missed — human analysis cannot track more than 2–3 variable interactions simultaneously | Captured automatically — ML models detect multivariate interactions like temperature-humidity-speed combinations |
| Accuracy | Subjective — bias toward recent events and easily measured variables | Statistical confidence scores — each root cause ranked with probability and supporting evidence |
| Scalability | Does not scale — each investigation requires dedicated engineer time | Full line coverage — monitors every laminating line and defect type simultaneously |
Machine Learning Approaches for Root Cause Detection
Three primary machine learning approaches power AI root cause detection in glass laminating. Each method addresses different data profiles, defect types, and operational constraints. Digital manufacturing directors evaluating ML approaches Book a Demo to see which fits their facility profile.
Supervised Learning trains on labeled historical defect data where root causes are already confirmed. Models like gradient-boosted trees and random forests learn the relationship between process variable patterns and known defect causes. Best suited for facilities with robust historical RCA records and recurring defect types. Delivers high precision on known failure modes and provides clear feature importance rankings that quality teams can validate.
Unsupervised Pattern Recognition uses clustering and anomaly detection algorithms to identify unusual variable combinations without requiring labeled defect data. Methods like isolation forests and autoencoders detect novel defect patterns that have not been seen before. Particularly valuable for identifying emerging quality issues from material changes, equipment wear, or environmental shifts that fall outside historical experience.
Deep Learning employs multi-layer neural networks capable of modeling complex non-linear interactions across dozens of process variables simultaneously. Recurrent and transformer architectures capture temporal dependencies in batch data — for example, how a temperature deviation in zone one propagates through later process stages. Best for high-volume facilities with rich sensor data and complex defect mechanisms involving time-lagged variable interactions.
AI Root Cause Detection vs. Manual RCA Comparison
The table below compares AI-driven root cause detection against traditional manual RCA across the metrics that matter most to digital manufacturing directors in glass laminating operations.
| Capability | Manual Root Cause Analysis | AI Root Cause Detection |
|---|---|---|
| Investigation Time | 8–40 hours per significant defect investigation | 5–30 minutes from alert to ranked cause list |
| Variable Coverage | Limited to 3–5 variables the engineer can manually correlate | 50+ process variables continuously monitored and analyzed |
| Detection Lag | Detected at final inspection or customer complaint stage | Detected in real time during production, before defect generation |
| Knowledge Retention | Depends on individual engineer memory and documentation practices | Institutional knowledge base grows with every investigation and correction |
| Corrective Action Accuracy | 60–70% first-attempt success rate | 85–95% first-attempt success rate with continuous improvement |
Implementation Roadmap for AI Root Cause Detection
Deploying AI root cause detection follows a structured five-phase sequence that ensures data readiness, model accuracy, organizational adoption, and measurable scrap reduction advance in parallel.
Expert Review — AI Root Cause Detection in Glass Laminating
We deployed AI root cause detection across three laminating lines at our float glass facility approximately nine months ago. The most significant change has been the shift from reactive to proactive quality management. Where we used to spend 70% of our time investigating defects after they occurred, we now spend that time preventing them. The system recently identified a supplier material lot variation that our manual RCA process had missed for six months. For directors evaluating this technology, the key insight is that AI root cause detection does not replace your quality team — it amplifies their effectiveness by eliminating the data-gathering overhead that consumes most of their time.
— Director of Manufacturing Quality, Tier 1 Glass Laminating Supplier — Automotive and Architectural Glass, ISO 9001 and IATF 16949 CertifiedConclusion
AI root cause detection for glass laminating transforms scrap reduction from a reactive investigation process into a predictive quality capability. Machine learning models continuously analyze multivariate process data, identify hidden defect causes, and deliver ranked recommendations with statistical confidence scores. Digital manufacturing directors achieve 35–50% scrap reduction, 3x faster corrective actions, and 85% fewer recurring defects. Digital transformation leaders ready to eliminate recurring quality issues Book a Demo to see iFactory AI root cause detection deployed in live glass laminating environments with full smart factory integration.
Frequently Asked Questions
Most glass laminating facilities require 3–6 months of production data including process variables, quality test results, and defect records. iFactory AI can achieve useful initial results with as little as 6–8 weeks of data using pre-trained defect signature libraries and transfer learning techniques.
No. AI root cause detection complements SPC systems by providing the investigative layer above control chart signals. When SPC flags an out-of-control condition, the AI engine automatically performs the root cause analysis that the quality team would otherwise do manually. The two systems work together — SPC detects the signal, AI identifies the cause.
AI root cause detection addresses the full spectrum of glass laminating defects including edge delamination, central debonding, bubble formation, interlayer waviness, optical distortion, thickness variation, and adhesion failures. The system learns defect-specific variable patterns and builds a unique cause signature for each failure mode.
Each laminating line receives its own model instance calibrated to that line's specific equipment characteristics, material grades, and environmental conditions. Multi-line facilities benefit from cross-line pattern transfer where insights from one line improve detection on similar lines, while each individual model maintains line-specific accuracy.
Stage one — data connectivity and baseline model training — typically takes 4–6 weeks. Stage two — parallel run validation and model calibration — requires 4–8 weeks. Full production deployment with integrated dashboards and alerting is achievable within 3–5 months from project initiation depending on data availability and IT infrastructure readiness.