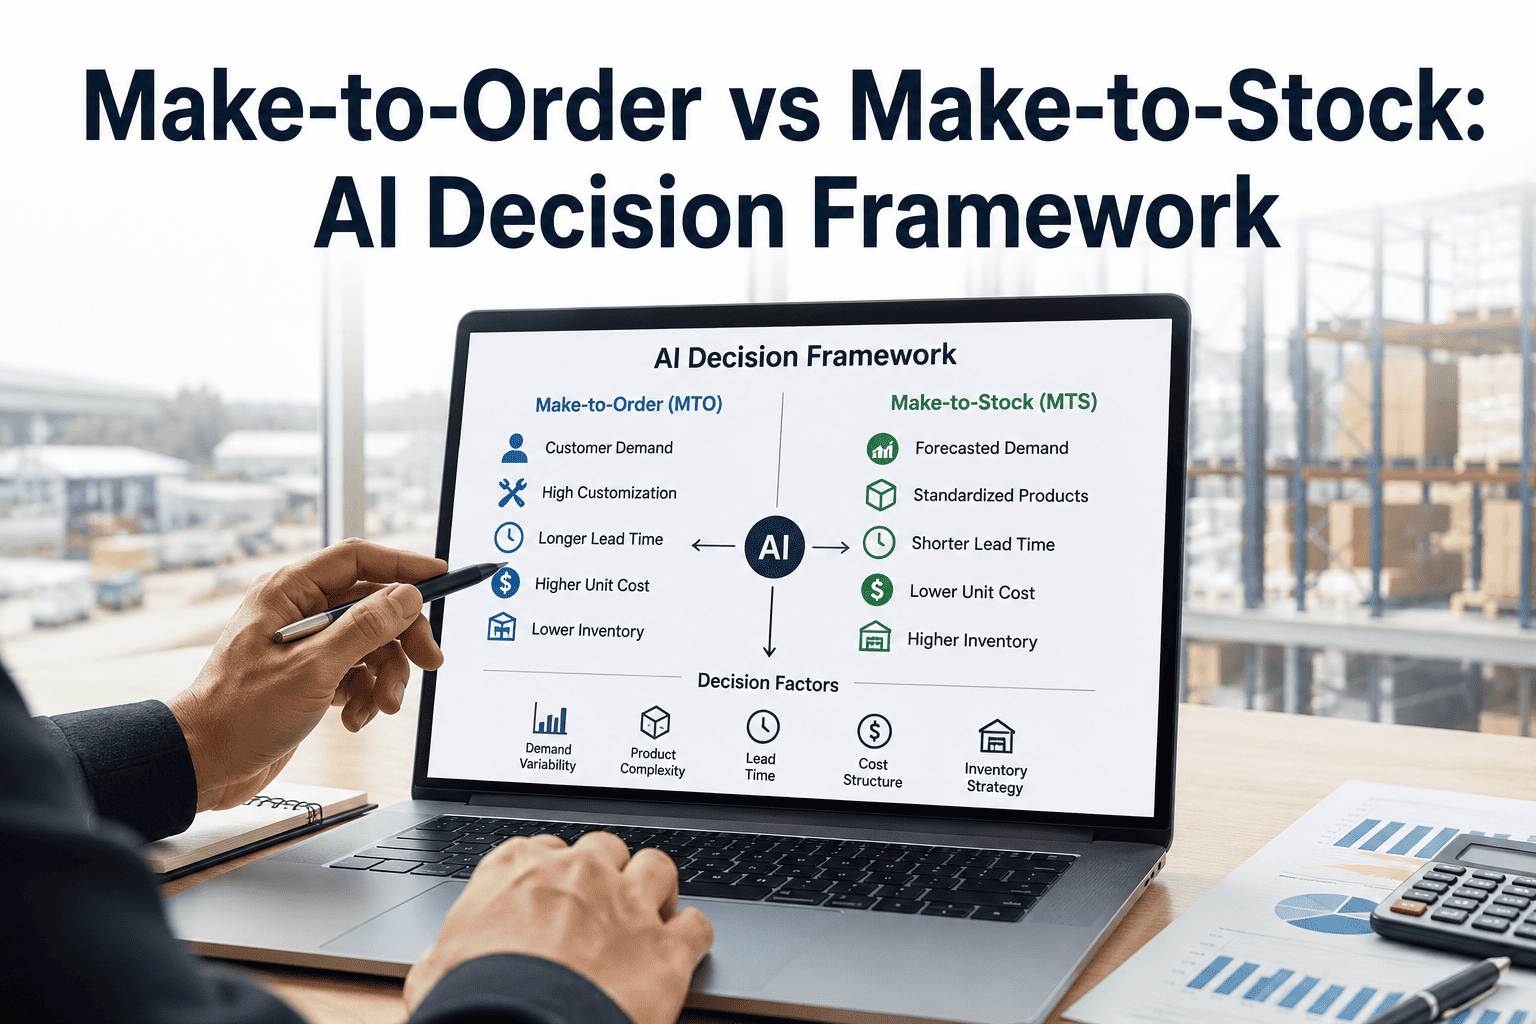
Almost no plant is purely one or the other. A machine shop might build custom gearboxes to order while keeping fasteners and common subassemblies on the shelf, and a consumer goods line might stock its top sellers while treating seasonal variants as pure build-to-order. The real question isn't "MTO or MTS" — it's which strategy each SKU deserves this month, and how fast you can move a part between the two camps when demand, lead time, or holding cost shifts under it. Get the split wrong and the cost shows up in two very different places: cash tied up in finished goods nobody's buying, or missed delivery dates on parts that could have been pre-built with a little foresight. iFactory's AI classifies every SKU continuously against live demand, lead time, and variability signals, and you can book a demo to see your own SKU mix reclassified in real time.
Production Strategy
Make-to-Order vs Make-to-Stock: Let AI Decide, SKU by SKU
Most plants already run a hybrid model without realizing it. The difference between the plants that thrive and the ones that don't is whether that hybrid split is set once a year in a spreadsheet, or recalculated every week by a system that actually watches demand.
The Line Between MTO and MTS Is Blurrier Than the Textbook Says
In theory, make-to-order waits for a confirmed order before production starts, and make-to-stock builds ahead against a forecast. In practice, most manufacturers run a hybrid: some SKUs sit in finished-goods inventory, others are built only against a purchase order, and a growing middle group moves between the two depending on the month. Getting that middle group wrong is expensive in both directions — carrying inventory nobody wants, or missing delivery dates on parts that could have been pre-built.
Make-to-Stock
TriggerDemand forecast
Lead time to customerShip from stock, days
Inventory riskCarrying cost, obsolescence
Best fitStable demand, low variability
Make-to-Order
TriggerConfirmed order
Lead time to customerFull production cycle
Inventory riskNear zero finished goods
Best fitHigh variability, custom specs
Where the Cost of a Wrong Classification Actually Lands
A SKU stuck on make-to-stock when it should have moved to order-driven production quietly builds up excess finished goods, tying up working capital and warehouse space on parts that may need to be discounted or scrapped later. Flip that around, and a SKU left on make-to-order when demand has become stable and predictable costs you on the other side: longer customer lead times, missed delivery commitments, and lost orders to a competitor who happened to have that part on the shelf. Both failure modes are common, and both are usually invisible until a monthly inventory report or a customer complaint forces the issue.
2–3x
typical excess inventory carrying cost on wrongly-classified MTS SKUs
15–25%
of a typical SKU portfolio sits in the ambiguous middle ground between MTO and MTS
Weekly
how often demand signals should really be re-evaluated, not once a year
Why a Static SKU List Fails Within Two Quarters
Most plants set their MTO/MTS split once, usually during an annual S&OP cycle, and leave it alone until something breaks. The problem is that the inputs behind that split — demand volatility, lead-time pressure from customers, and the cost of holding a specific part — all move continuously. A SKU that was a safe stock item in January can become a volatile, order-driven item by June if a competitor exits the market or a customer changes their ordering pattern.
01
Demand Variability
Coefficient of variation on weekly demand, tracked per SKU rather than per product family.
02
Customer Lead-Time Tolerance
How many days a customer will actually wait before they cancel or reorder elsewhere.
03
Holding Cost & Obsolescence Risk
Carrying cost, shelf life, and the odds a spec change makes finished stock worthless.
04
Production Flexibility
How much capacity headroom exists to absorb a sudden order without a forecast buffer.
How iFactory's AI Reassigns SKUs Automatically
Instead of a single annual decision, the AI engine runs a continuous loop that re-scores every SKU against the four signals above and moves it across the decoupling point when the evidence supports it — with a planner reviewing any move above a set risk threshold. See this loop running against your own SKU data in a live demo.
1
Score
Every SKU is re-scored weekly on variability, lead-time pressure, holding cost, and flexibility.
→
2
Flag
SKUs whose score crosses a threshold are flagged as candidates to move MTO or MTS.
→
3
Simulate
The proposed move is simulated against current capacity and inventory before anything changes.
→
4
Reassign
Low-risk moves apply automatically; higher-risk moves route to a planner for one-click approval.
What This Looks Like Across a Real SKU Portfolio
These patterns repeat across nearly every plant we've worked with, just with different part numbers attached. A high-volume commodity item settles into a stable make-to-stock rhythm once its variability drops low enough to trust a forecast. A configured product often doesn't need to be pure make-to-order at all — standardizing the core and configuring only the last step can move it to assemble-to-order instead, cutting customer lead time without adding finished-goods risk. The table below shows four common patterns and the reasoning behind each reclassification.
| SKU Pattern | Old Strategy | AI-Assigned Strategy | Why It Moved |
|---|
| High-volume fastener, stable demand | MTS | MTS, lower safety stock | Variability dropped, forecast tightened |
| Configured gearbox, custom ratio | MTO | Assemble-to-order | Core housing standardized, only gearing configured |
| Seasonal accessory kit | MTS year-round | MTO off-season, MTS in-season | Demand concentrated in 12-week window |
| New product launch SKU | MTS (guessed forecast) | MTO for first 90 days | No historical demand signal to trust yet |
Capacity to Absorb the Shift, Not Just Data to Support It
Knowing a SKU should move to make-to-order doesn't help if the plant has no open capacity to absorb the sudden demand without a forecast buffer to smooth it. That's why every reclassification proposal is checked against real production capacity, not just demand math, before it's ever presented to a planner. The four capabilities below work together so that a strategy change on paper actually holds up on the shop floor.
Postponement Points
The AI identifies where in the routing a decoupling point can be moved downstream — assembling to order instead of building to order for the full product.
Capacity Headroom Checks
Before a SKU shifts to MTO, the system confirms there's enough open capacity to meet the customer lead time without a forecast buffer.
Safety Stock Right-Sizing
SKUs staying on MTS get safety stock recalculated against current variability instead of a static reorder point set years ago.
Cross-SKU Rebalancing
Freed capacity from SKUs moving to MTO is automatically reallocated to cover the MTS SKUs that need it most.
Hybrid Strategy, Automated
Stop Re-Deciding MTO vs MTS Once a Year
See how iFactory continuously reclassifies your SKU portfolio, catching the shifts a static plan misses until it's too late.
Frequently Asked Questions
Won't constantly moving SKUs between strategies confuse the shop floor?
No, because the system doesn't move every SKU every week. Only SKUs whose demand signals cross a meaningful threshold get flagged, and most portfolios see a small single-digit percentage of SKUs reclassified in any given month. Planners also see the reasoning behind every proposed move before it takes effect, so the shop floor always works from an approved plan rather than a constantly shifting target.
Ask about the approval workflow in a demo.
How does the AI handle a brand-new product with no demand history?
New SKUs typically start as make-to-order, or assemble-to-order if a standardized subassembly exists, because there isn't enough demand history yet to trust a forecast. As real orders accumulate, usually over 60 to 90 days, the system begins scoring the SKU normally and will propose a move to make-to-stock once the demand pattern is stable enough to support safety stock. This avoids the common mistake of guessing a forecast for a product nobody has bought yet.
Does this replace our ERP's reorder point and MRP logic?
No, it sits on top of your existing ERP and feeds it better inputs. The AI engine reads historical and real-time demand data from your ERP, recalculates the classification and safety stock parameters, and writes those updated parameters back as reorder points, planning strategies, or lot-sizing rules your MRP run already understands.
Contact support to check compatibility with your specific ERP.
What data do we need before starting?
The minimum is 6 to 12 months of historical order and shipment data per SKU, current lead times from suppliers and internal routings, and current safety stock or reorder point settings. Most ERP systems already store this data; the main effort is making sure SKU identifiers are consistent across sales, planning, and inventory modules so the AI can join the data cleanly.
How quickly do plants typically see a measurable result?
Most plants see their first meaningful inventory or service-level improvement within one to two quarters, since the first pass through the SKU portfolio typically finds a handful of clearly mis-classified high-cost SKUs immediately. The compounding value builds over the following two to three quarters as the continuous reclassification loop catches drift that a static annual review would have missed entirely.
Book a demo for a plant-specific estimate.
Ready When You Are
Bring Your SKU Portfolio Into a Living MTO/MTS Model
iFactory continuously reclassifies every SKU against real demand signals, so your hybrid strategy stays accurate long after the annual S&OP meeting ends.