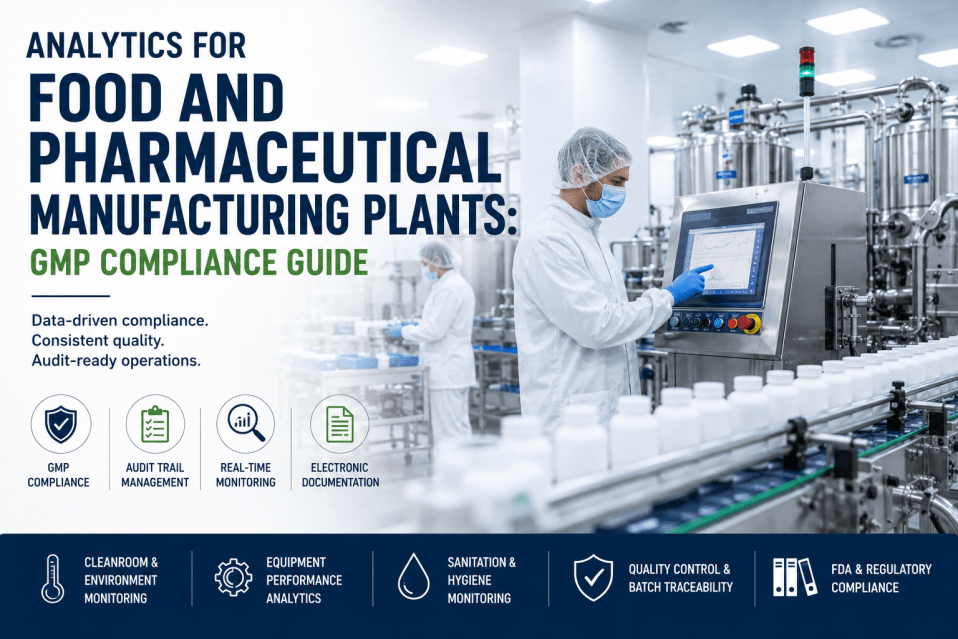
The pharmaceutical manufacturing industry operates under a compliance and quality mandate that has no equivalent in any other industrial sector: every process, every instrument, every cleaning cycle, every change to a validated method must be documented, qualified, and traceable to a regulatory standard — and the penalty for failure is not a production loss metric but a Warning Letter, a consent decree, or a market withdrawal. The plant manager at a mid-size solid oral dosage facility in New Jersey managing 14 product lines, 340 calibrated instruments, and 6 ongoing validation projects with a paper-based system in 2026 is not managing a documentation problem — they are managing a competitive liability that their peers who have deployed pharmaceutical manufacturing analytics have already resolved. AI-powered analytics platforms built for cGMP environments are transforming how pharmaceutical manufacturers manage equipment qualification, calibration compliance, cleaning validation, change control, and operational efficiency — not by replacing regulatory rigor but by making it faster, more reliable, and less dependent on manual effort that introduces the human error risk that auditors scrutinize most heavily. This guide covers the five analytics domains that are reshaping pharmaceutical manufacturing operations in 2026: GMP compliance analytics reducing audit exposure, equipment qualification and calibration management eliminating instrument-related deviations, cleaning validation analytics accelerating campaign changeovers, change control analytics compressing validation timelines, and unified platform architecture replacing the fragmented point-solution stacks that create data integrity gaps. iFactory's 2026 analytics platform integrates each of these capabilities into one unified cGMP-ready architecture — deployable without replacing existing MES, LIMS, or ERP systems — and delivering documented compliance efficiency gains and OEE improvements at pharmaceutical manufacturing facilities across solid oral dosage, sterile injectables, and API production environments.
GMP Compliance Analytics: From Reactive Audit Preparation to Continuous Compliance Visibility
The traditional model of GMP compliance management in pharmaceutical manufacturing is fundamentally reactive: compliance status is assembled from paper records and disconnected systems in the weeks before an FDA inspection or EMA audit, deviations are identified after they have occurred and documented after the fact, and the CAPA backlog that accumulates between audits reflects the gap between the compliance visibility the quality system provides and the compliance visibility the operation actually requires. In 2026, pharmaceutical manufacturers deploying continuous GMP compliance analytics have replaced this reactive posture with a live compliance dashboard that surfaces out-of-tolerance instrument readings, overdue qualification activities, cleaning validation anomalies, and change control documentation gaps in real time — in the shift window when corrective action is still a quality system activity rather than a regulatory response.
Equipment Qualification and Calibration Management: Eliminating Instrument-Driven Deviations
Calibration failure and equipment qualification gaps are among the most consistently cited sources of FDA observations across pharmaceutical manufacturing — not because quality teams are negligent but because managing qualification schedules, calibration intervals, out-of-tolerance responses, and requalification triggers across hundreds of instruments and process equipment items with paper-based or spreadsheet systems creates the kind of scheduling and documentation complexity that produces missed intervals, late recalibrations, and qualification status gaps that appear in audit findings. iFactory's equipment analytics module provides pharmaceutical manufacturers with a live qualification and calibration management system that tracks every instrument's calibration due date, tolerance status, and qualification history in one platform — with automatic escalation when instruments approach due dates, automatic hold flagging when instruments go out of tolerance, and automatic documentation generation for calibration records that meet 21 CFR Part 11 audit trail requirements. Book a Demo to see how iFactory's calibration management integrates with your existing instrument inventory and LIMS.
Cleaning Validation and Change Control Analytics: Accelerating Compliance-Critical Workflows
Two compliance workflows that consume disproportionate quality team bandwidth at pharmaceutical manufacturing facilities — cleaning validation and change control — are being transformed by analytics in 2026. Cleaning validation analytics addresses the campaign changeover bottleneck where QA release of cleaning cycles depends on manual swab data review, residue trending, and worst-case equipment surface area calculations that take 2 to 4 hours of analyst time per changeover. Change control analytics addresses the documentation and impact assessment burden that makes minor equipment or process changes take 3 to 6 weeks from initiation to approval at most mid-size facilities. Together, these analytics capabilities recover production time and quality team capacity that manual compliance workflows consume at a cost that most pharmaceutical manufacturers have accepted as unavoidable — until they see what comparable facilities have achieved with purpose-built analytics tools.
Cleaning Validation Analytics — From Manual Review to AI-Assisted Release
iFactory's cleaning validation analytics module integrates swab sampling data, rinse TOC results, and visual inspection records into a single campaign changeover dashboard that calculates residue levels against established acceptance criteria, flags out-of-limit results automatically, and generates cleaning validation summary reports ready for QA signature review — reducing changeover release cycle time from 2 to 4 hours of analyst effort to 20 to 35 minutes of review. For facilities managing 8 to 16 product changeovers per week, this recovery represents 12 to 28 hours of quality analyst time per week redirected from data compilation to higher-value quality activities. The platform also provides cleaning trend analytics across equipment items, cleaning agents, and product families — identifying drift in cleaning effectiveness before it produces an out-of-limit result rather than after.
Change Control Analytics — Compressing Validation Timelines Without Regulatory Risk
Change control delays are one of the most significant production efficiency losses at pharmaceutical manufacturing facilities — not because the regulatory requirements are unreasonable but because the impact assessment, documentation routing, approval workflow, and post-implementation verification steps are managed through systems that were not designed for the volume and complexity of changes that a dynamic manufacturing operation generates. iFactory's change control analytics module provides a structured workflow that guides change initiators through impact assessment questions, automatically routes documentation to the right reviewers based on change category and product impact scope, tracks approval status in real time, and triggers post-implementation verification activities at the right intervals. The result is a change control process that takes 8 to 14 days at facilities with analytics-supported workflows versus 22 to 38 days at facilities managing the same process through paper or email-based systems.
Combined Financial Impact — Cleaning Validation + Change Control Analytics
The financial case for deploying cleaning validation and change control analytics together is driven by two separate but compounding value streams: production time recovered from faster changeover release decisions, and quality team capacity recovered from documentation and workflow management activities that analytics automates. At a solid oral dosage facility with 12 changeovers per week and 180 change control records annually, combined deployment of cleaning validation and change control analytics recovers an estimated 1,400 to 2,200 analyst-hours per year from administrative activities — equivalent to 0.7 to 1.1 quality FTEs redirected to higher-value compliance activities. The changeover production recovery from faster cleaning release decisions adds 3 to 6 additional production batches per month at facilities where changeover queue time is the constraint on schedule attainment.
Pharmaceutical Manufacturing Analytics: Regulatory Framework and Data Integrity Requirements
Deploying analytics in a pharmaceutical manufacturing environment is not the same as deploying analytics in a steel mill or food plant — the regulatory framework that governs how data is collected, stored, accessed, and modified in a cGMP environment adds requirements that analytics platforms built for general industrial applications cannot satisfy without significant customization. iFactory's pharmaceutical analytics platform is built natively for 21 CFR Part 11 and EU Annex 11 compliance — the electronic records and electronic signatures regulations that govern data integrity in FDA- and EMA-regulated manufacturing — and for Annex 15 validation requirements that govern how software systems used in pharmaceutical manufacturing must be qualified. Understanding these requirements is essential for pharmaceutical plant managers evaluating any analytics platform investment. Book a Demo to review iFactory's validation documentation package for your facility's regulatory environment.
| Regulatory Requirement | What It Governs | Manufacturing Impact If Absent | iFactory 2026 Capability | Audit Risk Level |
|---|---|---|---|---|
| 21 CFR Part 11 | Electronic records and electronic signatures in FDA-regulated environments | Data integrity observations, rejection of electronic records as acceptable equivalents | Full Part 11-compliant audit trail, electronic signatures, and access control architecture | High — consistently cited in Warning Letters |
| EU Annex 11 | Computerized systems in EMA-regulated manufacturing | Data integrity findings on EU inspections, GMP certificate risk | Annex 11-aligned system lifecycle documentation and validation package | High — EU export market access risk |
| 21 CFR Part 211.68 | Automatic, mechanical, and electronic equipment | Qualification gap observations for automated systems used in manufacturing | Equipment qualification module with IQ/OQ/PQ protocol templates and status tracking | Medium — equipment-specific finding risk |
| ICH Q10 PQS | Pharmaceutical Quality System management and lifecycle | Ineffective PQS findings: inadequate CAPA, management review, and continual improvement | Deviation, CAPA, and management review analytics with effectiveness metrics | Medium — systemic observation risk |
| Annex 15 Validation | Qualification and validation of processes, equipment, and utilities | Revalidation gaps, process validation protocol deviations | Validation schedule management with automatic revalidation trigger on change events | High — process validation is inspection focus |
| 21 CFR Part 820 (QMSR) | Quality Management System for medical device manufacturers | QMSR observation risk for combination product facilities | Configurable quality event framework supporting both drug cGMP and device QMSR workflows | Medium — combination product complexity |
Predictive Maintenance and OEE Analytics: Pharmaceutical Manufacturing's Hidden Efficiency Gap
The compliance focus of pharmaceutical quality systems has historically meant that maintenance and operational efficiency analytics have received less investment than quality and regulatory systems — with the result that most pharmaceutical manufacturers are operating critical equipment at 55 to 70% OEE when their physical assets and process designs are capable of 80 to 88% OEE under optimized maintenance and scheduling conditions. The gap is not primarily a capacity investment problem — it is a data visibility problem. Tablet press downtime, lyophilizer cycle time variation, autoclave load density inefficiency, and HVAC/cleanroom system failures that trigger environmental excursions and batch disposals are all predictable and preventable events that analytics identifies before they occur. The pharmaceutical plant manager who has deployed predictive maintenance analytics on tablet presses, fluid bed dryers, and autoclave systems is not just preventing downtime — they are preventing the environmental excursion events that produce batch disposals, the tablet press punch wear events that produce compression weight deviations, and the lyophilizer condenser fouling events that extend cycle times and reduce validated throughput.
Tablet Press and Capsule Filler Predictive Analytics
Vibration and current signature monitoring on tablet press main drives and turret systems provides 7 to 14 day prediction horizons for punch tip wear, turret bearing degradation, and cam track surface failures — enabling planned punch set changes and bearing replacements during scheduled downtime windows rather than unplanned stoppages that require batch disposition decisions. Current signature analytics on capsule filling machines detects dosator piston wear and fill weight drift before statistical process control limits are breached, enabling corrective action before a deviation is generated.
Lyophilizer and Autoclave Cycle Analytics
Lyophilizer condenser performance trending identifies fouling accumulation and refrigeration efficiency degradation before they extend validated cycle times and require unplanned defrost cycles that displace production batches. Autoclave cycle analytics monitors chamber pressure rise rates, drain temperature profiles, and Bowie-Dick test trends to predict seal wear and chamber integrity issues before they produce failed qualification cycles or, more critically, non-sterile load events requiring product disposition.
HVAC and Cleanroom Environmental Analytics
HVAC performance analytics for cleanroom environments monitors filter differential pressure, air velocity at critical supply points, and temperature and humidity stability to predict filter breakthrough and blower degradation before they produce environmental excursions. At sterile manufacturing facilities where an environmental excursion in an ISO 5 or ISO 7 area triggers a media fill investigation and potential batch disposition, preventing the HVAC failure event that caused the excursion has a direct avoided-cost value of $180,000 to $640,000 per incident in investigation, disposition, and regulatory notification cost.
OEE Analytics Across cGMP Production Lines
iFactory's OEE analytics module tracks Availability, Performance, and Quality metrics across pharmaceutical production lines with GMP-appropriate loss categorization that distinguishes planned qualification downtime, change control holds, and cleaning validation cycles from unplanned equipment failures and scheduling inefficiencies. This distinction is critical for pharmaceutical OEE benchmarking: the 68% OEE that looks like a poor performance number is actually 81% OEE net of planned compliance activities — and the analytics layer that makes that distinction visible changes how management teams prioritize improvement investments. Book a Demo to see iFactory's GMP-adjusted OEE framework configured for your product line and compliance activity profile.
Expert Review: Pharmaceutical Manufacturing Analytics From the Quality Operations Floor
I have been in pharmaceutical operations for 22 years — solid oral dosage, sterile injectables, and one biosimilar facility — and the analytics conversation in 2026 is fundamentally different from what it was even three years ago. What changed is that the platforms finally understand what GMP manufacturing actually requires. In 2021 I evaluated four analytics vendors for our NJ solid oral dosage site and every single one required us to build custom validation protocols because they had never deployed in a Part 11 environment. The implementation timelines were 9 to 14 months and the validation burden alone cost us more than the software. What iFactory brought to the table in 2025 was a platform that shipped with a validation package, an IQ/OQ template set for the software itself, and an audit trail architecture that our QA team reviewed and approved in three weeks rather than three months. We went live on calibration management, cleaning validation analytics, and change control workflow in 8 weeks. In the first 12 months we reduced calibration-related deviations by 47%, recovered 1,200 analyst-hours from cleaning documentation activities, and cut our average change control cycle from 31 days to 11 days. The inspection readiness piece is what I tell every quality director I talk to: I now walk into any FDA pre-announcement inspection with a live compliance dashboard that shows every instrument calibration status, every qualification due date, and every open CAPA with its due date and current owner. That dashboard alone changed the tenor of our last inspection. When the investigator asks for calibration records and you pull up a live screen instead of a binder, the conversation changes. That is what analytics does for pharmaceutical manufacturing in 2026 — it changes the conversation from defense to confidence.
— VP of Quality Operations, U.S. Solid Oral Dosage Facility — 22 Years in Pharmaceutical Manufacturing — iFactory Reference Customer 2026Conclusion
Pharmaceutical manufacturing analytics in 2026 is not a future investment — it is a present competitive and regulatory necessity. The five analytics domains covered in this guide — continuous GMP compliance visibility, equipment qualification and calibration management, cleaning validation analytics, change control workflow acceleration, and predictive maintenance with OEE optimization — are each independently valuable and collectively transformative for pharmaceutical manufacturers who deploy them on a unified platform built for cGMP environments.
The cost of deploying these capabilities has dropped to a level that is economically justifiable at mid-size facilities based on deviation prevention value alone — before accounting for the production efficiency, analyst capacity, and audit readiness benefits that drive the $2 to $6 million annual value documented at comparable facilities. iFactory's unified pharmaceutical analytics platform delivers all five capability domains in one 21 CFR Part 11-compliant architecture, deployable in 6 to 9 weeks without replacing existing MES, LIMS, or ERP systems. Book a Demo to see iFactory's pharmaceutical analytics platform configured for your specific facility profile, product mix, and regulatory environment.
Frequently Asked Questions
Yes — iFactory's pharmaceutical analytics module is built natively for 21 CFR Part 11 and EU Annex 11 compliance, with timestamped audit trails, electronic signature controls, access role management, and a validation documentation package that includes IQ/OQ templates for the software system itself. The platform ships with the documentation infrastructure that pharmaceutical QA teams require to approve deployment without building custom validation protocols from scratch.
Calibration management analytics consistently delivers the fastest payback — typically under 8 months — because the deviation prevention value from eliminating missed calibration intervals and out-of-tolerance late detections is immediate and measurable against the facility's existing deviation cost baseline. For facilities with high sterile product changeover frequency, cleaning validation analytics frequently matches or exceeds calibration ROI through production time recovery from faster release decisions.
Yes — iFactory's 2026 deployment architecture is designed to operate alongside, not replace, existing LIMS, MES, and ERP systems. The platform connects to existing data sources through standard API and OPC-UA integration protocols, adds the analytics layer that existing systems do not provide, and surfaces insights in one unified dashboard without requiring the facility to migrate data or retire validated systems. The typical integration scope for LIMS and MES connectivity is completed within the 6 to 9 week deployment timeline.
iFactory's GMP compliance dashboard provides a live inspection readiness score updated daily across all compliance domains: calibration currency, qualification status, validation currency, change control backlog, CAPA closure rates, and training currency. Facilities with this visibility walk into FDA inspections with real-time documentation access rather than assembling binders over 3 to 5 days — and the ability to immediately produce audit trails, calibration histories, and deviation summaries for any equipment item or time window the investigator requests changes the inspection dynamic significantly.
Mid-size pharmaceutical manufacturers — facilities with 4 to 20 production lines, 150 to 600 calibrated instruments, and 80 to 400 change control records annually — typically see the highest ROI from analytics deployment because they carry the full compliance burden of large facilities without the large IT and quality team headcount required to manage that burden manually. The analytics deployment cost at this scale — $95,000 to $220,000 annually for unified pharmaceutical analytics — is recoverable from deviation prevention value alone in most cases within 6 to 10 months.