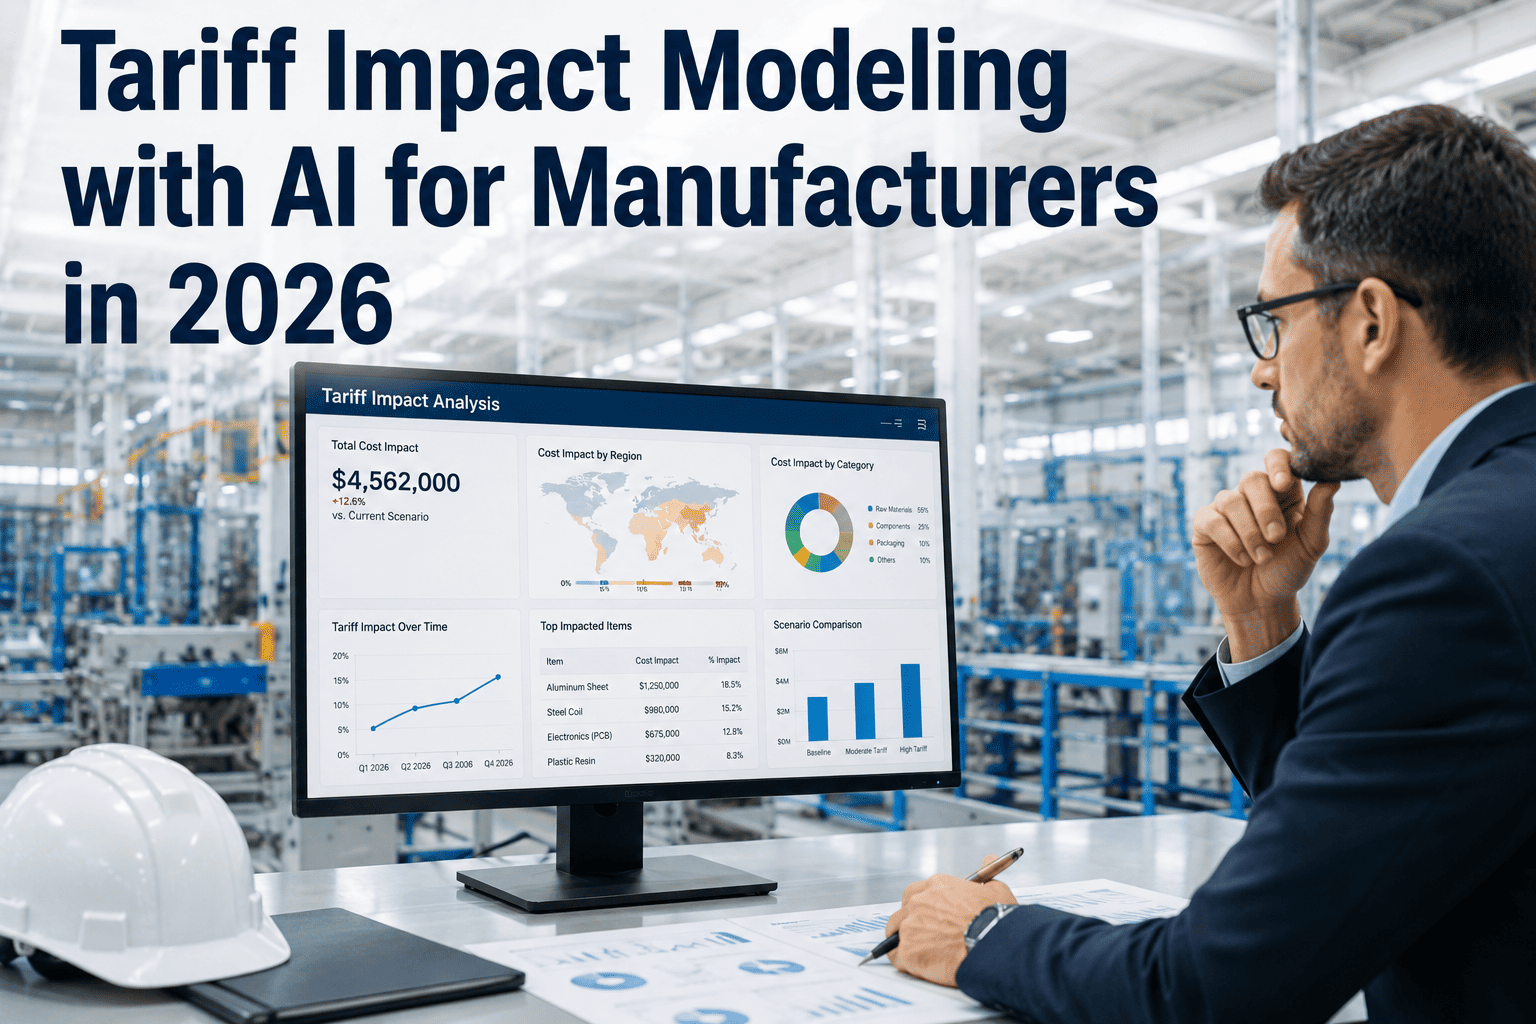
The weighted-average applied U.S. tariff rate has climbed from roughly 1.5 percent in 2022 to close to 14 percent in 2026, with an effective rate around 10.1 percent — the highest level since 1946. For an operations director running a plant with $10 million in imported components, that shift alone represents close to $1 million in added annual cost, and it rarely shows up as one clean line item. It arrives quietly, buried inside freight, duty, harbor fees, and customs handling, which is exactly why industry data shows landed cost running 20 to 40 percent above the vendor's quoted price on a growing share of purchase orders. Static spreadsheets built around last quarter's tariff rate cannot keep pace with a policy environment that now shifts week to week, which is why iFactory AI's tariff impact modeling platform keeps landed cost visible inside every order before margin quietly disappears.
The Landed Cost Gap Hiding in Every Quote
Ask most operations teams what margin they are running on a given order and they will answer confidently, fast. Ask them to show the work behind that number, and the confidence tends to slip — because most cost models are still built off the vendor's quoted FOB price, not the true landed cost of getting that product onto the plant floor. Freight, duty, tariff layers, insurance, and handling fees stack on top of the quoted price one at a time, and by the time they are all accounted for, the real cost per unit can run substantially higher than what the original quote implied.
In this illustrative example, a purchase order quoted at $10,000 lands at roughly $17,200 once every layer is accounted for — a 72 percent gap between the number on the vendor invoice and the number that should be driving the margin calculation. Pricing and reporting margin off the original quoted figure means overstating profitability on every single unit, often without finding out until the numbers are reconciled weeks or months later. See this same buildup modeled against your actual bill of materials and sourcing data.
Why Tariff Exposure Changes Faster Than Spreadsheets Can Track
Three distinct tariff authorities can stack on the same shipment depending on product category and country of origin, and each one can change independently, sometimes within the same week. Operations directors managing sourcing decisions need to track all three simultaneously, not as a one-time classification exercise but as a continuously monitored variable.
Targets goods of Chinese origin specifically, with rates that have expanded to cover dozens of additional economies under active investigation.
Applies to steel, aluminum, and other materials designated a national security concern, modified further by country-specific bilateral deals.
A broader baseline tariff authority applied across a wide range of imports, introduced following recent shifts in trade legal authority.
Manual Tariff Analysis vs. AI Scenario Modeling
| Dimension | Manual Spreadsheet Analysis | AI Tariff Scenario Modeling |
|---|---|---|
| Data Source | Manually updated tariff tables, often weeks stale | Continuous ingestion of trade bulletins and HTS updates |
| Update Frequency | Reviewed periodically, when someone remembers | Recalculated automatically as policy changes occur |
| Scenario Coverage | 2–3 scenarios modeled per analysis cycle | Dozens of sourcing and routing scenarios in one session |
| Time to Answer | Days to weeks per scenario | Minutes per scenario, including margin impact |
| Margin Visibility | Reconciled after the fact, often quarter-end | Visible inside the quote before it is issued |
What a Tariff What-If Query Actually Looks Like
The practical value of AI tariff modeling shows up in how a question gets asked and answered. Instead of building a new spreadsheet model for every scenario, operations directors can query the system in plain language and get a structured answer back in minutes, complete with ranked sourcing alternatives.
"What happens to our margin if Section 301 duties increase by 10 percent on our electronics components from Malaysia, while ocean freight rises 15 percent?"
Landed cost rises an estimated 12.4 percent on affected SKUs; gross margin compresses by 4.1 points on the electronics product line; three alternative sourcing routes are ranked by total landed cost, lead time, and compliance requirements.
What Margin Compression Actually Costs at the EBITDA Line
Tariff-driven cost increases rarely stay contained to gross margin — they flow straight through to EBITDA, and the relationship is not one-to-one, it is amplified. A business running healthy 35 percent gross and 20 percent EBITDA margins that absorbs a 5-point gross-margin compression from unmodeled tariff exposure does not drop to a 15 percent EBITDA margin as a rounding error — that is a 25 percent reduction in operating profit on the same revenue.
Operations Director Perspective
I have run operations for a mid-market industrial equipment manufacturer for just over twenty-one years, and 2025 into 2026 has been the first stretch of my career where I genuinely could not keep our cost models current using the process we had always used. We import roughly $14 million a year in components across three tariff programs, and by the second quarter of 2025 our finance team was reconciling landed cost variances that were sometimes 15 to 18 percent off what our quotes assumed — not because anyone made an error, but because the tariff rate itself had changed twice between when we quoted a job and when the materials actually landed. We brought in iFactory AI's tariff modeling platform specifically to stop pricing off stale assumptions, and the change that mattered most was not a single big win, it was that every quote our sales team issues now reflects landed cost as of that morning, not landed cost as of whenever someone last updated the spreadsheet. We caught one sourcing decision in the first month — a component we had been buying from a supplier that had just become subject to an additional duty layer — that alone would have cost us close to $80,000 over the following two quarters if we had not switched routing before signing the next purchase order. The what-if modeling has genuinely changed how our leadership team plans; instead of debating tariff exposure in the abstract during a quarterly review, we pull up the actual margin impact of a proposed policy change in the meeting and make the sourcing call on the spot. For any operations director still pricing off last quarter's tariff assumptions: that gap is not shrinking on its own, and it compounds every week you carry it.
— Operations Director, Mid-Market Industrial Equipment Manufacturer — 21 Years Industry Experience — iFactory AI Reference Customer 2026Conclusion
Tariff exposure has moved from a background compliance concern to a first-order margin problem, and the pace of change in 2025 and 2026 has made spreadsheet-based tariff analysis structurally unable to keep up. The gap between a quoted price and true landed cost is exactly where operations directors are losing margin they never see coming — until quarter-end reconciliation forces the number into view.
iFactory AI connects tariff, freight, and duty data directly to your bill of materials and sourcing origins, modeling scenario impact in minutes instead of the days or weeks a manual process requires. Book a Demo to see your current tariff exposure modeled against your own product portfolio.
Frequently Asked Questions
The quoted price is what a vendor invoices for the product itself, typically on an FOB basis. True landed cost adds every expense required to get that product onto your plant floor — ocean or air freight, insurance, duty and tariff layers, customs processing fees, and inland trucking. Industry data shows these additional costs commonly add 20 to 40 percent on top of the quoted price, and in a stacked tariff environment the gap can run higher. Book a Demo to see your true landed cost calculated against a recent purchase order.
Tariff programs have shown significant volatility through 2025 and 2026, with Section 232 inclusions expanding, Section 301 lists modified, and new legal authorities such as Section 122 emerging with little advance notice. A cost model that reflects rates from even a few weeks ago can materially understate true landed cost on an active quote. Continuous monitoring is what allows AI tariff modeling to keep pricing decisions current rather than reconciled after the damage is done.
Yes. Section 301, Section 232, and Section 122 tariffs can all apply to the same shipment depending on product category and country of origin, and correctly stacking them requires accurate HTS classification and up-to-date origin determination. iFactory AI's platform maps each active tariff program to the relevant SKUs and origins automatically, rather than requiring a manual classification review each time a program changes. Contact support to discuss your specific product classification needs.
Manual tariff scenario analysis typically takes days to weeks per scenario, since it requires building or updating a spreadsheet model, sourcing current rate data, and manually recalculating margin impact across affected SKUs. AI-driven scenario modeling returns a structured answer, including margin impact and ranked sourcing alternatives, within minutes of a query, which is what allows operations teams to evaluate dozens of scenarios in the time a manual process would allow for two or three.
A functional deployment generally requires current bills of materials with accurate HTS classifications, sourcing origin data by supplier and SKU, current purchase order and freight cost history, and visibility into which tariff programs currently apply to your product categories. Facilities with incomplete or approximate HTS classification typically start with a classification review, since inaccurate classification undermines the accuracy of every scenario built on top of it. Book a Demo to discuss a data readiness review for your specific product portfolio.