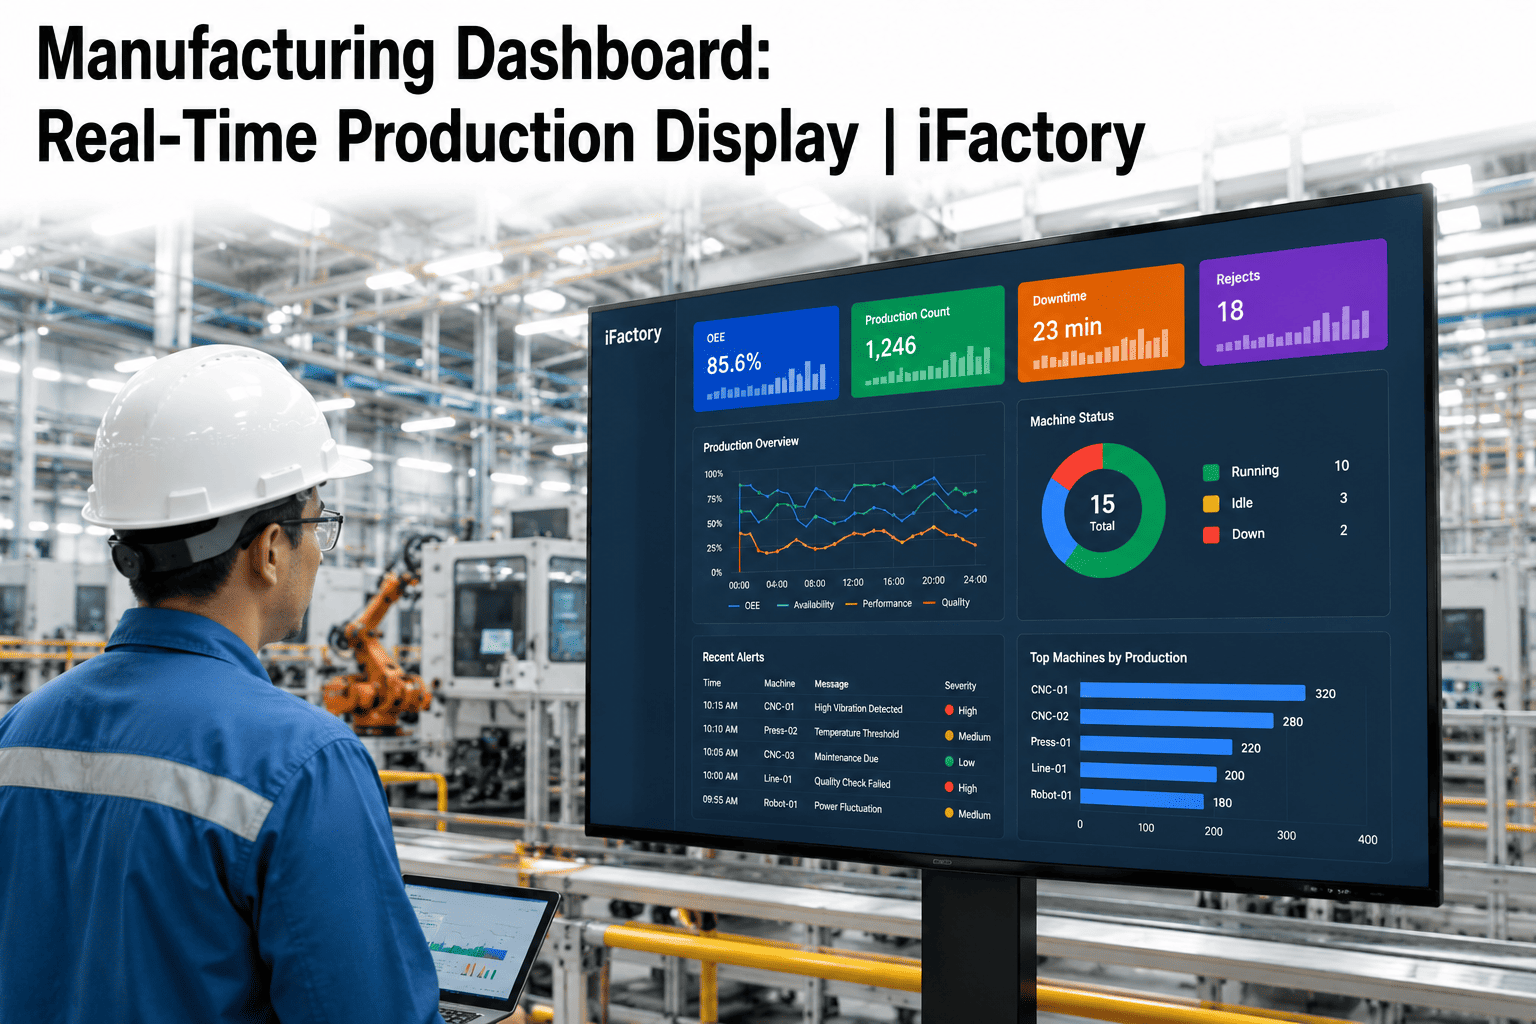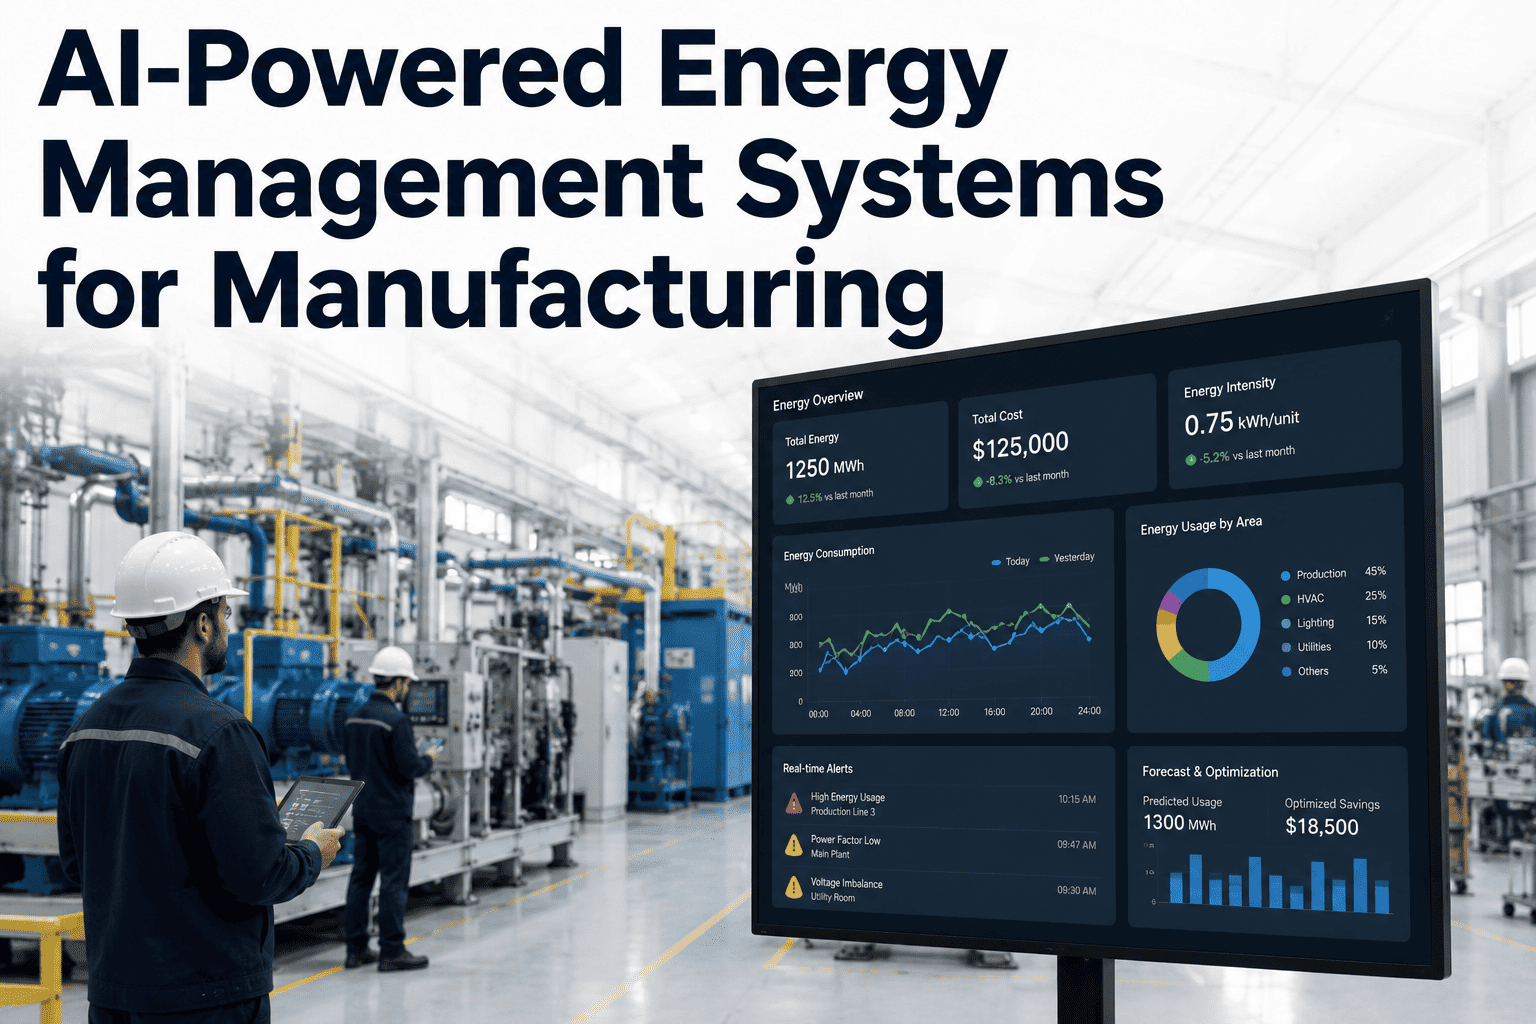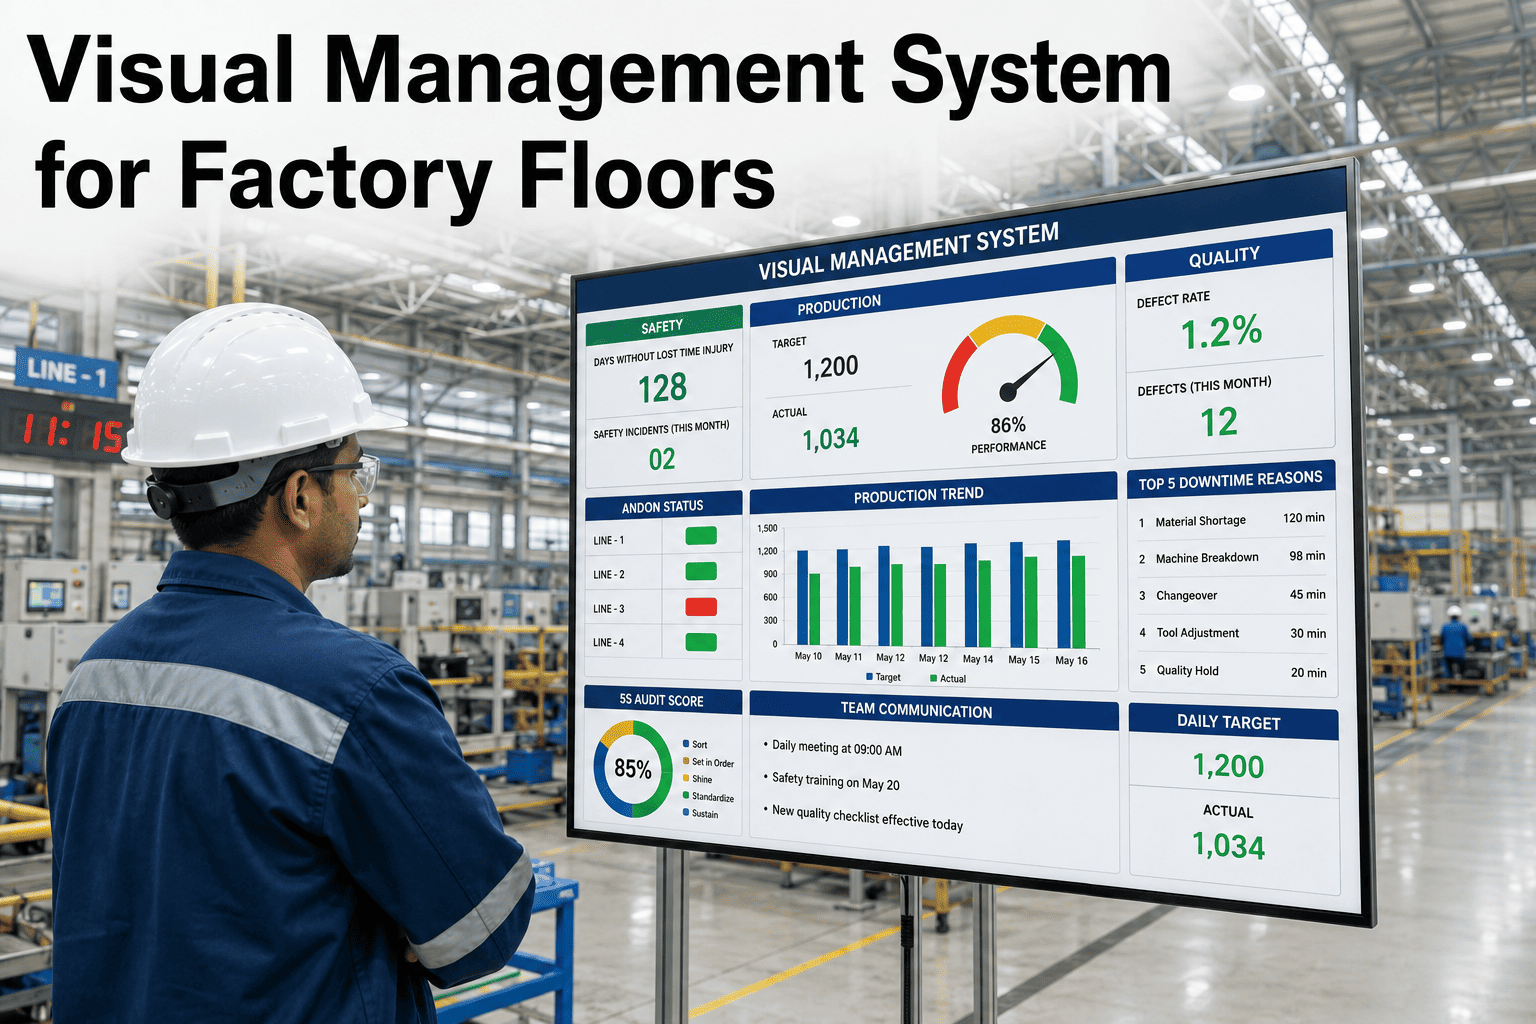
Walk onto an unfamiliar factory floor and count how long it takes to answer one simple question: is production going well right now, or is something wrong. On most floors that answer lives in someone's head, buried in a supervisor's mental notes or a spreadsheet nobody outside the office ever opens. A true visual management system removes that dependency entirely — status, targets, and problems are displayed openly enough that any person, even a visiting stranger, can read the state of the line within seconds of looking at it. That is the standard iFactory's platform is built around, and the support team can show you exactly how it maps onto your existing lines during a short walkthrough.
Visual Management System: Make Every Line Readable in Five Seconds
Replace scattered whiteboards, radio calls, and end-of-shift reports with live status boards, color-coded andon signals, and metric displays that put the true state of the floor in front of everyone, all the time.
The Five-Second Rule
A visual management board earns its place on the wall only if it passes one test: can a person understand whether the line is winning or losing within five seconds, without asking anyone a question. If the answer requires a conversation, the board is not visual — it is just another document that happens to be displayed on a screen.
This rule matters because it forces a discipline that most factories never get around to on their own: deciding what actually deserves a place on the primary display. It is far easier to add another metric to a screen than to remove one, which is why so many boards slowly accumulate numbers until nobody can read them at a glance anymore. Holding every addition to the five-second standard keeps the board doing its actual job — radiating the state of the line outward — instead of becoming a report that happens to be mounted on a wall.
Three Layers, One Consistent Picture
A modern visual factory is not one screen — it is a set of layers that each serve a different audience, all reading from the same live data so nobody sees a different version of the truth depending on where they happen to be standing.
Keeping all three layers wired to the same underlying data, rather than three separate systems maintained independently, is what stops the boards from drifting apart over time. A signal light that says green while the cloud dashboard shows a stalled line is worse than having no digital layer at all, because it teaches people to stop trusting any of the displays. Consistency across every layer is what earns the floor's confidence in the first place.
Stop Waiting for Someone to Notice the Light
Traditional andon lights only work if someone happens to be looking. iFactory pairs the same familiar color language with automatic alerts, so a stoppage reaches the right person the moment it happens instead of waiting for eyes to land on the board.
Six Things Worth Displaying, Not Sixty
The fastest way to ruin a visual management board is to overload it. If a board tries to show everything, it ends up communicating nothing within the five-second window it is supposed to meet. These six categories cover what actually needs to be visible to keep a floor self-correcting, and each one earns its spot because it directly triggers a specific action from whoever reads it — a supervisor call, a maintenance dispatch, or a quality hold — rather than existing simply because the data happened to be available.
A Toyota Idea That Outgrew the Factory Wall
The andon cord traces back to the Toyota Production System, where a single rope gave any operator the authority to stop the line the moment something went wrong. That authority was the point — the light was never just decoration, it was a signal backed by real permission to act. Decades later, the same principle still holds: a visual signal only earns trust on the floor if everyone understands that acting on it is expected, not optional.
What has changed since then is how the signal travels. A physical light only helps the people who happen to be looking at it, which means many small issues on a busy or noisy floor simply go unnoticed until they compound into something larger. A digital layer keeps the same familiar color language operators already trust, while removing the dependency on someone glancing up at exactly the right moment. The signal still means the same thing — it just reaches the right person automatically instead of waiting to be spotted.
This evolution also solved a second, quieter limitation of the original andon system: a pulled cord tells you something is wrong, but not what, how long it has been wrong, or how it compares to a normal shift. Modern visual management closes that gap by pairing the same instant visual cue with the reason, the duration, and the trend behind it, so the person responding arrives already informed instead of starting the investigation from zero.
The Morning Walk That Visual Management Replaces
On a floor without visual management, a supervisor's morning often starts the same way: a slow walk past every line, a glance at each operator, a few questions asked out loud, and a mental tally of what needs attention that lives nowhere except that supervisor's head. If that person is out sick or pulled into a meeting, the floor loses its only real-time source of truth for the day.
That walk is not a bad instinct — it is exactly the right information to gather. The problem is that it only reaches one person, only updates a few times a day, and disappears the moment the supervisor moves on to the next line. Visual management does not replace the instinct to walk the floor; it makes the same information available continuously, to everyone, instead of intermittently to one person doing rounds.
The shift shows up quickly once boards go live. New operators stop needing to ask where a changeover stands. Maintenance stops waiting for a phone call to know which line needs them next. Quality stops discovering a defect trend a day after it started, because the trend was visible on the board hours earlier. None of these changes require a new headcount or a new process — they come from making information that already existed impossible to miss.
Why a Photo Beats a Paragraph
Text-based work instructions leave room for interpretation, and interpretation is exactly what a visual standard is designed to remove. A written line that says "clean the sensor thoroughly" means something different to every operator who reads it. A labeled photo of what clean actually looks like leaves no ambiguity at all, and it travels across language barriers and shift-to-shift handoffs far better than a paragraph ever could.
This is why visual standards tend to spread quickly once one area adopts them well — supervisors in neighboring departments see the reduction in repeated questions and training time, and start requesting the same format for their own work instructions without needing to be convinced by a formal policy change.
Building a Visual Factory Without Disrupting Production
Sites that succeed with visual management rarely try to instrument every line on day one. A phased approach builds trust in the boards before they become the primary source of truth for the floor, and gives teams time to learn which metrics genuinely change behavior versus which ones just look good on a screen.
A common mistake in this rollout sequence is skipping straight to Phase 4 before Phase 2 is actually settled — pushing incomplete or inconsistent metrics out to management dashboards before the floor-level board has proven itself undermines confidence in the entire system. Letting each phase earn trust before expanding scope is usually the difference between a program that becomes the plant's default way of working and one that quietly reverts back to whiteboards within a year.
What Changes Once the Floor Can See Itself
A visual management rollout is worth the effort only if it changes how fast problems get noticed and resolved, not just where the numbers happen to live. These are the indicators worth tracking before and after go-live, and the ones most plants find easiest to explain to leadership when justifying the investment.
| Indicator | Before Visual Management | After Visual Management |
|---|---|---|
| Time to notice a stoppage | Depends on someone walking past or a radio call | Seconds, flagged automatically on every screen |
| Time to understand line status | Requires asking a supervisor directly | Under five seconds, readable by anyone on the floor |
| Consistency of work instructions | Varies by operator interpretation of text SOPs | Standardized through labeled photo and video references |
| Visibility beyond the shop floor | Limited to end-of-shift or end-of-week reports | Live, continuous access from office and mobile devices |
Frequently Asked Questions
Turn Every Screen Into a Five-Second Answer
iFactory connects your existing signal lights, boards, and machine data into one live visual management layer — readable by anyone, updated automatically, and available anywhere.