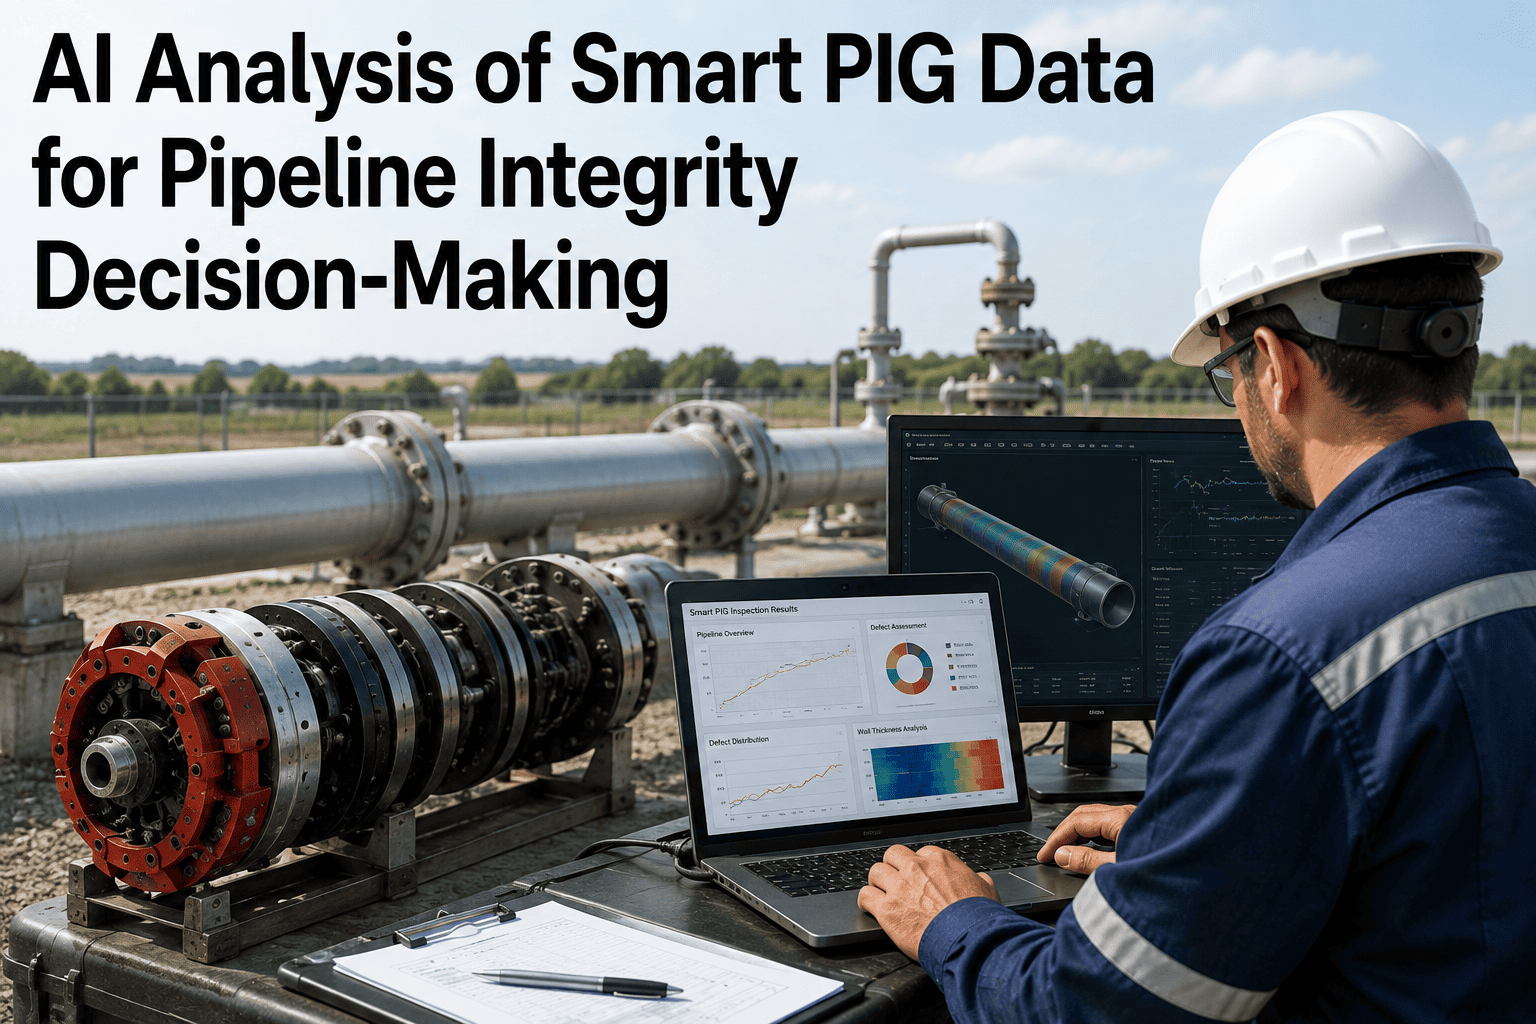
A single smart pig run generates gigabytes of MFL, ultrasonic, and caliper readings, and somewhere in the middle of it is a handful of anomalies that actually matter — the ones close enough to the pressure limit, or growing fast enough, to justify a dig. Finding them today usually means an integrity engineer scrolling through weeks of tabulated data, cross-referencing prior runs by hand. iFactory's smart pig data analysis does that triage automatically, turning weeks of manual review into hours.
Your ILI Vendor Delivers a Report. Your Integrity Engineer Still Has to Find the Anomalies That Actually Matter.
AI-driven analysis of MFL, UT, and caliper data automatically detects, sizes, and prioritizes anomalies — cutting analysis time from weeks to hours without lowering detection confidence.
Three Inspection Technologies, Three Different Stories About the Same Pipe
Every smart pig run produces a different kind of evidence depending on the tool technology, and the real analytical work is in reconciling all three into one coherent picture of pipe condition — not treating each dataset as its own isolated report.
Magnetic Flux Leakage
Detects metal loss from corrosion or gouging by measuring disruption in a magnetic field induced in the pipe wall. Strong at finding general corrosion patterns, sensitive to sensor lift-off and pipe grade variation that can distort raw signal interpretation.
Ultrasonic Testing
Measures wall thickness directly using sound wave time-of-flight, giving more precise depth sizing than MFL alone but requiring a liquid couplant and running best in liquid-filled lines rather than gas lines.
Caliper / Geometry Tools
Maps internal pipe geometry to detect dents, ovality, and buckles — deformation anomalies that neither MFL nor UT are designed to characterize, but which carry their own distinct failure risk, especially where a dent overlaps a metal loss feature.
The anomalies that carry the highest actual risk are frequently the ones where two of these datasets overlap — a dent sitting on top of a corrosion patch, for instance, which neither the caliper report nor the MFL report alone would flag as urgent, but which combined represents a materially different integrity threat than either finding in isolation.
From Raw Tool Data to a Prioritized Dig List
Ingest and align multi-technology data
MFL, UT, and caliper datasets from the same run — and from prior runs — are aligned to a common distance reference along the pipeline, correcting for odometer drift that otherwise makes cross-referencing anomalies between datasets unreliable.
Detect and size anomalies automatically
Machine learning models trained on labeled historical anomaly data identify metal loss, deformation, and cracking features directly from raw signal data, sizing depth and length with consistency that manual signal review struggles to replicate across a full pipeline length.
Correlate overlapping feature types
Anomalies detected across different tool technologies at the same location are automatically cross-referenced, surfacing compound features — like a dent-on-corrosion combination — that a single-technology review would evaluate separately and understate.
Compare against prior run history
Where a prior ILI run exists, anomaly growth rate is calculated automatically by comparing feature size across runs, distinguishing a stable, decades-old feature from one that is actively growing and closing in on a repair threshold.
Rank by remaining strength and urgency
Every flagged anomaly is scored against pipe remaining strength calculations and growth trajectory, producing a ranked dig list that separates immediate-action features from ones that can be monitored to the next scheduled run.
| Analysis Step | Manual Review Timeline | AI-Assisted Timeline |
|---|---|---|
| Raw data alignment across tools | Several days per run | Automated within hours |
| Anomaly detection and sizing | 1-2 weeks of engineer review | Automated, engineer reviews flagged features |
| Prior-run comparison for growth rate | Manual cross-referencing, days | Automated feature-matching, minutes |
| Dig list prioritization | Days of manual ranking and review meetings | Ranked output generated same day |
| Total time to actionable dig list | 3-5 weeks typical | Days, engineer-reviewed |
Every Week Spent Manually Reviewing ILI Data Is a Week a Growing Anomaly Goes Unranked
iFactory turns raw MFL, UT, and caliper data into a prioritized, engineer-reviewable dig list in days, not weeks.
A Composite Scenario: The Feature Two Reports Missed Separately
Consider a midstream operator running a combined MFL and caliper inspection on a twenty-year-old crude line. The MFL report identifies a moderate metal loss feature at a specific joint — present, logged, sized, but not urgent enough on its own to warrant an immediate dig given its depth relative to wall thickness. The caliper report, reviewed separately by a different analyst days later, identifies a shallow dent at what turns out to be the same approximate location, also not independently alarming, since a dent of that depth alone rarely triggers immediate action.
Reviewed in isolation, as they typically are when two different specialists handle two different datasets on two different timelines, neither finding crosses the threshold for urgent action. Correlated automatically against a shared distance reference, the combination tells a different story: a dent overlapping a corrosion feature creates a stress concentration that meaningfully increases failure risk compared to either anomaly alone, and the combined feature moves substantially up the prioritized dig list as a result. The operator schedules a dig within the current maintenance window rather than carrying the feature to the next five-year inspection cycle, closing a risk that two separate single-technology reviews would each have rated as low-priority.
Why Growth Rate Matters More Than a Single Snapshot
A single ILI run tells you what a pipeline looks like on the day the pig ran. It doesn't tell you whether a given anomaly has been stable for fifteen years or has grown significantly since the last inspection — and that distinction is often more decisive for prioritization than the absolute size of the feature itself. A moderately sized, actively growing anomaly frequently deserves more urgent attention than a larger but demonstrably stable one, yet a snapshot-only review has no way to make that distinction without deliberately pulling and comparing the prior run.
Automating that run-to-run comparison is one of the more consistently underused capabilities in integrity management, largely because manually matching hundreds or thousands of individual features between two large datasets, correcting for the odometer and orientation differences between runs, is exactly the kind of tedious, error-prone task that tends to get abbreviated under deadline pressure — reviewed for the handful of anomalies an engineer already suspects are worth checking, rather than comprehensively across the full feature list.
What the Remaining Strength Calculation Actually Weighs
A dig prioritization list built purely on anomaly depth misses the more complete picture that remaining strength calculations provide. Two metal loss features of identical depth can carry very different failure risk depending on their length, orientation, proximity to a weld or girth joint, and the operating pressure of that specific segment. A shallow but long, axially-oriented feature on a high-pressure segment can carry more risk than a deeper but short, isolated feature on a lower-pressure one — a distinction that a simple depth-threshold sorting approach would get backwards.
Standard remaining strength methods used across the pipeline industry — modified B31G and similar approaches — already account for this interaction between depth, length, and pipe geometry. What automated analysis adds is applying that calculation consistently and immediately across every single detected anomaly on a run, rather than reserving the full calculation for the subset of features an engineer has time to run it on manually, which under deadline pressure is rarely the complete anomaly list.
| Feature Characteristic | Why It Changes Risk | Often Missed By |
|---|---|---|
| Length-to-depth ratio | Longer features reduce remaining strength more than depth alone suggests | Depth-only threshold sorting |
| Proximity to weld or joint | Stress concentration compounds with nearby structural features | Single-technology review |
| Local operating pressure | Same feature carries different risk at different MAOP segments | Generic dig-list ranking |
| Overlapping feature types | Dent-plus-corrosion carries compound risk beyond either alone | Separately reviewed tool reports |
Building the Integrity Review Around the Prioritized List
Who Should Review the Ranked Output
A qualified pipeline integrity engineer reviews every top-ranked anomaly before a dig decision, using the AI-generated sizing and correlation as a starting point rather than a final answer — the model accelerates the analysis, the engineer still owns the judgment call.
Realistic Review Timeline
A same-week engineer review of the top-ranked features, rather than waiting for a full report cycle on the entire anomaly list, is what actually captures the time savings automated analysis is meant to deliver.
Common Mistake: Reviewing Tool Types in Isolation
Assigning MFL, UT, and caliper data to separate specialists who each produce an independent report misses the compound-risk features that only appear when the datasets are correlated against a shared distance reference.
Common Mistake: Treating a Single Run as the Full Picture
A single run without growth-rate comparison to prior inspections can't distinguish a stable decades-old feature from an actively growing one — prioritizing based on size alone, without trend, risks under-ranking the features that need attention soonest.
Turning One Run Into a Trend Line Across the Pipeline's Life
The real value of automated ILI analysis compounds with every subsequent run. A single inspection, however thoroughly analyzed, is still one data point. The second run against the same segment turns that data point into a trend — corrosion rate per year at a specific location, dent behavior over time, whether a previously stable feature has started growing. By the third and fourth runs, a pipeline operator has something closer to a genuine condition forecast than a series of independent snapshots, and that forecast is what actually supports moving from reactive, threshold-triggered digs toward a planned, risk-ranked integrity program.
Getting to that point requires the run-to-run matching to be done consistently and completely every time, not just for the handful of features an engineer remembers flagging on the prior run. Automated feature matching across the full anomaly list, rather than a manually selected subset, is what makes a multi-run trend line trustworthy rather than a partial picture assembled from whichever features happened to get cross-referenced.
Frequently Asked Questions
Does this replace our ILI vendor's analysis and reporting?
No — the ILI vendor's tool run and initial data processing remain the foundation of the inspection. iFactory works with the vendor-delivered dataset to add automated cross-technology correlation, run-to-run growth analysis, and prioritized ranking on top of it, which is typically a layer of analysis that goes beyond what a standard vendor report provides on its own. Visit support to see how it fits alongside your current ILI vendor relationship.
What file formats or data structures does this accept from ILI vendors?
The platform is built to work with standard ILI vendor deliverables, including tabulated anomaly listings and, where available, raw signal data for MFL, UT, and caliper tools. Format compatibility varies by vendor, so an initial data assessment typically confirms exactly what can be ingested directly versus what may need a conversion step.
How does the model handle pipelines with no prior ILI run to compare against?
Without a prior run, growth-rate analysis isn't possible for that specific pipeline yet, but anomaly detection, sizing, cross-technology correlation, and remaining-strength-based prioritization all still apply to the current run's data. Once a second run is completed, whether from iFactory's baseline or a future inspection, growth analysis becomes available and sharpens prioritization further. Book a demo to discuss your specific inspection history.
Who reviews and approves the final dig list — the AI or our integrity engineers?
The AI-generated ranking is a decision-support output for your integrity engineers, not an autonomous decision. Every flagged anomaly, its sizing, and its ranking rationale are presented for engineer review before any dig decision is finalized, which keeps the qualified integrity professional in control of the final call while removing the manual burden of finding and cross-referencing the anomalies in the first place.
Can this help with regulatory reporting requirements for pipeline integrity programs?
The structured, prioritized anomaly analysis and documented growth-rate comparisons support the kind of record-keeping typically expected in a pipeline integrity management program, and can strengthen the evidence base behind repair prioritization decisions that regulators review. It's not a substitute for your formal compliance program, but it improves the underlying data quality that program relies on.
The Anomaly That Matters Most Is Rarely the One Sitting Alone in a Single Dataset
iFactory correlates every inspection technology and every prior run automatically, so the compound risks your current process might miss get found — and ranked.