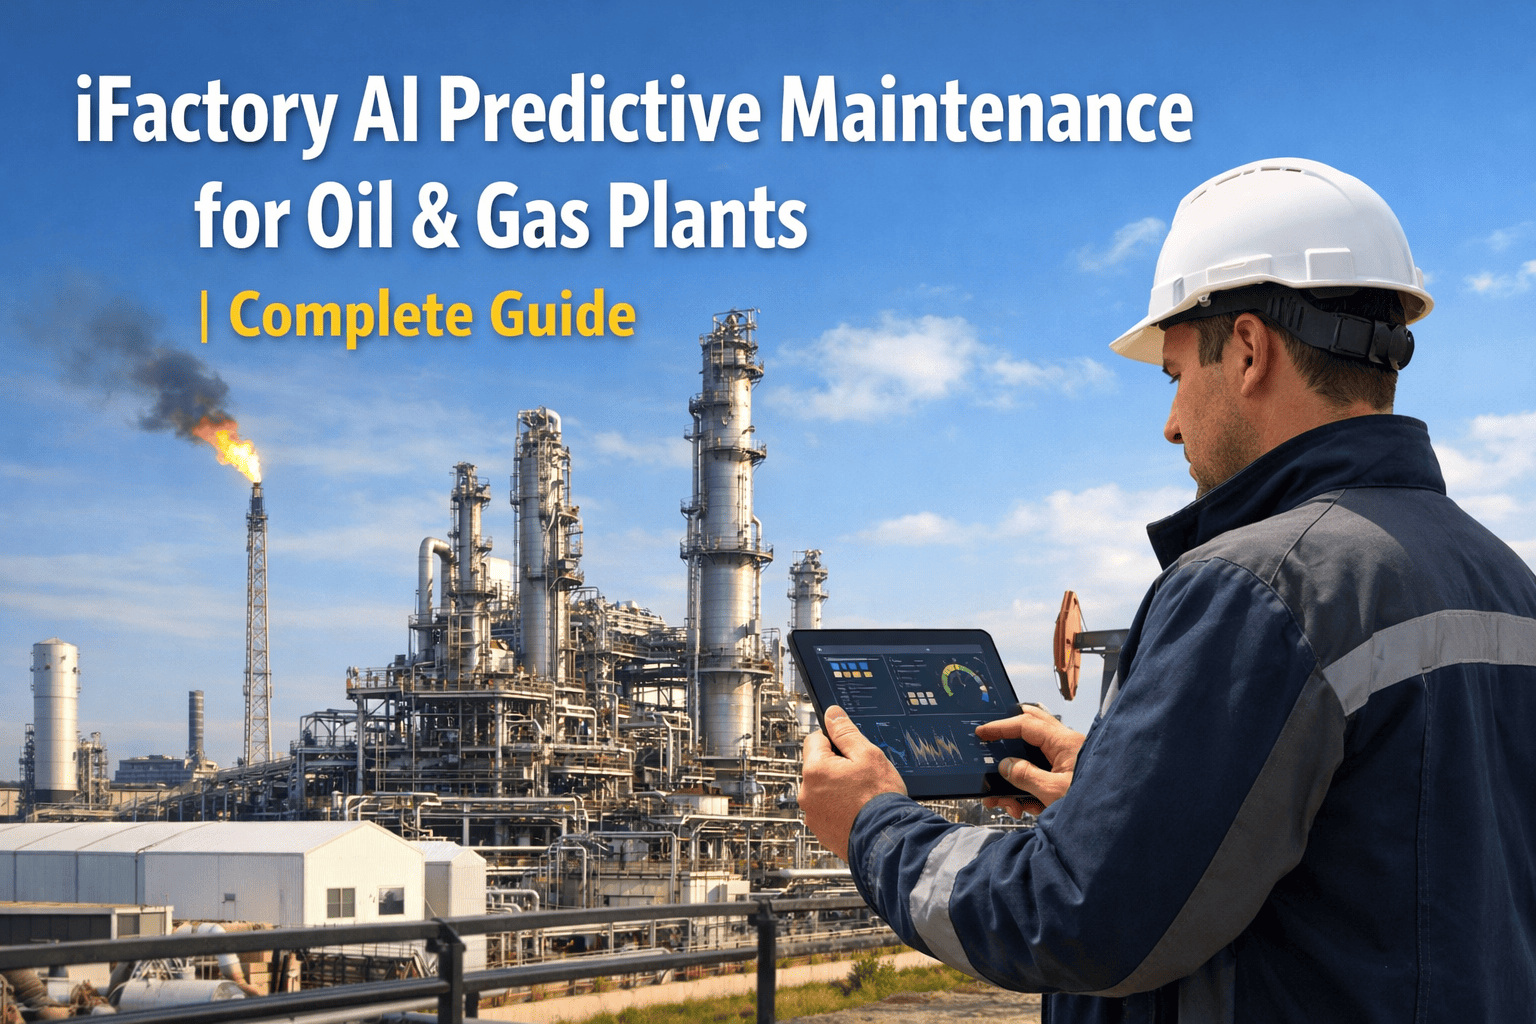
iFactory AI-powered OEE analytics platform helps oil and gas processing facilities move beyond reactive maintenance cycles and build a measurable, continuous improvement model for equipment performance. For plants where a single hour of unplanned downtime can cost upwards of $500,000, knowing the health of critical rotating equipment, compression trains, and separator systems in real time is not a luxury — it is a core operational discipline. iFactory brings together IoT sensor integration, digital twin modeling, and AI-driven predictive analytics into one unified platform purpose-built for the demands of industrial energy operations. Book a Demo to see how iFactory delivers measurable OEE gains across refining, LNG processing, and upstream production facilities.
Why Oil & Gas Processing Plants Lag Behind World-Class OEE
According to the Aberdeen Group, the average oil and gas facility operates at an OEE of approximately 73%, while process industry leaders consistently score in the high 80s. That gap represents tens of millions of dollars in unrealized throughput capacity sitting idle every year. The root causes are well understood: aging infrastructure managed on fixed calendar-based maintenance intervals, limited real-time sensor coverage across distributed processing equipment, and maintenance teams that only learn about equipment degradation after a failure has already disrupted production.
In capital-intensive oil and gas operations, a one-point improvement in availability directly translates to a one percent gain in production throughput. For a 20,000 barrel-per-day facility, recovering just one OEE point can generate an additional 73,000 barrels of annual output. iFactory's AI platform is designed to close this OEE gap systematically — by integrating condition-based monitoring, predictive failure scoring, and digital twin analytics across every critical asset in the processing train.
The Four Operational Blind Spots Driving OEE Loss in Processing Plants
Most oil and gas processing facilities suffer from the same structural OEE losses. They are not failures of engineering — they are failures of visibility. Without continuous, sensor-level data flowing into an AI analytics engine, maintenance teams cannot detect the early-stage degradation patterns that precede equipment failures by days or weeks. iFactory's platform addresses each of these blind spots with targeted condition monitoring and machine learning models built for the specific failure modes of oil and gas processing equipment. Book a Demo to see how iFactory identifies your plant's top OEE loss drivers.
How iFactory AI Delivers OEE Analytics Across Oil & Gas Processing Operations
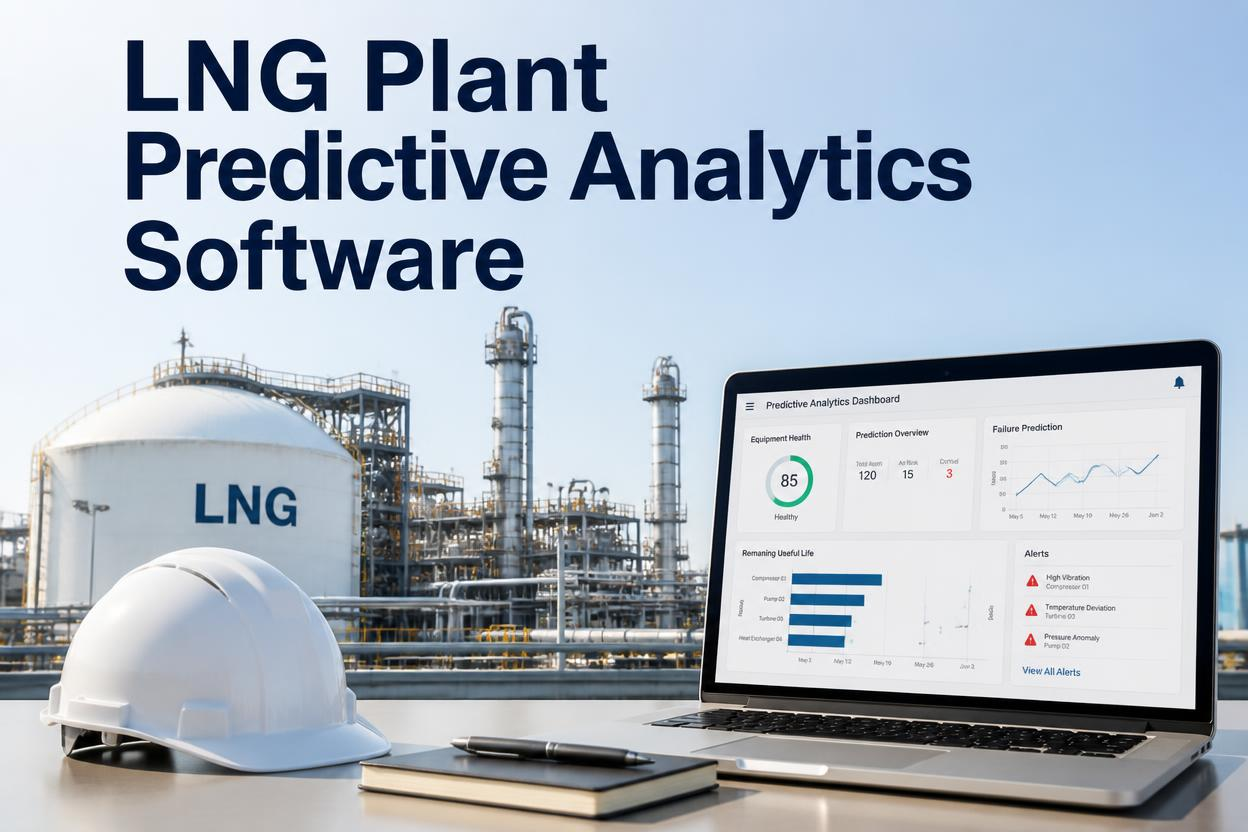
iFactory is an OEM-agnostic AI-driven industrial software platform that integrates directly with existing SCADA, DCS, and PLC infrastructure common to oil and gas processing facilities. The platform deploys a mesh of IoT sensors across critical rotating and static equipment, feeding a continuous stream of operational data into AI models that monitor equipment health, flag anomalies, and generate prioritized maintenance recommendations. The result is a shift from calendar-based maintenance to condition-based intervention — the single most impactful change a processing plant can make to its OEE trajectory.
Critical Equipment iFactory Monitors in Oil & Gas Processing Facilities
iFactory's sensor integration covers the full scope of rotating, static, and process control equipment found across upstream production sites, midstream compression stations, and downstream refining and LNG processing plants.
| Equipment Category | Assets Monitored | Key Failure Modes Detected | iFactory Sensor Type |
|---|---|---|---|
| Rotating Equipment | Centrifugal & reciprocating compressors, pumps, turbines, blowers | Bearing wear, shaft imbalance, cavitation, seal degradation | Vibration, motor current, temperature |
| Separation & Processing | Gas-liquid separators, flash drums, distillation columns, heat exchangers | Fouling buildup, pressure excursions, level control drift | Pressure, differential pressure, flow, temperature |
| Utility & Power Systems | Cooling water systems, steam generators, power distribution panels | Cooling degradation, insulation failures, overload conditions | Current, voltage, thermal imaging integration |
| Pipeline & Transfer | Transfer pumps, control valves, metering skids, pig receivers | Valve stiction, meter drift, seal leak detection | Flow, pressure, acoustic emission sensors |
| Safety & Compliance Systems | Emergency shutdown valves, relief systems, flare monitoring | Valve response time degradation, relief valve chatter | Position, pressure, response time logging |
iFactory Deployment Timeline for Oil & Gas Processing Plants
iFactory is designed for rapid deployment without disruption to active processing operations. Integration with existing SCADA and DCS infrastructure means most facilities are receiving live OEE data within 30 days of project kickoff, with full predictive analytics active within 60 days.
Full audit of critical processing equipment, existing instrumentation coverage, and SCADA/DCS integration points. Sensor placement architecture finalized for rotating equipment and key process control nodes. Network connectivity assessed for substation and remote skid locations.
IoT sensors installed on highest-criticality rotating equipment. iFactory platform connected to live data streams. AI engine begins establishing behavioral baselines for compressors, pumps, and turbines. OEE dashboard goes live with real-time availability tracking across monitored assets.
Sensor coverage extended to separation systems, heat exchangers, and utility assets. Digital twin models activated for key processing units. AI predictive models transition from baseline training to active anomaly detection and failure prediction mode.
iFactory maintenance priority queue integrated with existing CMMS or work order management system. Maintenance team trained on mobile dashboard and condition-alert protocols. Platform fully commissioned with 24/7 autonomous monitoring active and audit documentation flowing automatically.
Measured OEE Improvements Across iFactory Oil & Gas Deployments
iFactory deployments across industrial processing facilities consistently deliver measurable OEE improvements within the first two quarters of full operation. The platform's ability to eliminate unplanned downtime — the single largest OEE loss driver in oil and gas — drives the majority of the financial return, which typically produces full platform ROI within seven to nine months of commissioning.
| Performance Metric | Before iFactory | After iFactory | Net Change |
|---|---|---|---|
| Overall Equipment Effectiveness (OEE) | ~73% industry avg. | 85–91% target range | +12–18 percentage points |
| Unplanned equipment downtime | Reactive — post-failure response | Condition-based intervention | Up to −20% downtime reduction |
| Mean time to detect equipment anomaly | Hours to days (manual inspection) | Real-time (<60 seconds) | Real-time detection |
| Predictive failure detection window | None (failure-triggered) | 14–21 days pre-failure | Weeks of advance warning |
| Emergency repair cost per event | $12,000–$50,000+ per event | Planned maintenance rate | −70 to −85% repair cost |
| Maintenance cost reduction (AI-driven) | Calendar-based spend | Condition-optimized intervals | Up to −15% maintenance cost |
| OEE reporting and compliance documentation | Manual — 12–24 hr lag | Automated — real-time dashboard | 100% audit-ready records |
| Deployment timeline to full OEE coverage | N/A | 60 days | Full coverage in 60 days |
What Operational Leaders in Oil & Gas Say About AI-Driven OEE Analytics
The shift from calendar maintenance to condition-based intervention is the single highest-ROI operational change available to processing plant operators today. Fixed-interval maintenance schedules were designed for an era before continuous sensor data was economically viable. Today, running a compressor to a fixed calendar date — regardless of its actual wear state — is equivalent to leaving money on the table or accepting unnecessary risk. iFactory's AI platform removes the guesswork from maintenance timing and replaces it with data-driven decisions grounded in the actual mechanical condition of each asset.
Digital twin technology is transforming how processing engineers optimize throughput without physical experimentation. By maintaining a continuously updated virtual model of the processing train, iFactory allows operations teams to identify performance losses, simulate process adjustments, and evaluate maintenance scenarios without interrupting live production. This is particularly valuable during pre-turnaround planning, where the ability to accurately predict post-maintenance performance improvements translates directly into more effective capital allocation.
Compliance and audit readiness are increasingly recognized as direct OEE contributors, not administrative overhead. In regulated oil and gas environments, the time and labor consumed by manual inspection logging, maintenance record compilation, and HSE reporting represents a real operational cost. iFactory's automated compliance documentation converts this overhead into a system byproduct — freeing experienced maintenance personnel to focus on condition-based interventions rather than paperwork. Trusted by 500+ oil and gas facilities globally, iFactory's platform aligns operational performance with regulatory excellence. Book a Demo to assess your facility's compliance readiness.
Building a Data-Driven OEE Culture in Oil & Gas Processing Operations
The path from the oil and gas industry average of 73% OEE to the high-80s performance achieved by process leaders is not paved with more maintenance personnel or more frequent inspections — it is built on better data, interpreted by better models, and acted on in real time. iFactory's AI-driven OEE analytics platform gives processing plant operators the continuous visibility they need to make condition-based maintenance decisions, recover throughput lost to undetected performance degradation, and meet the compliance demands of modern oil and gas operations without incremental administrative burden.
The financial case is direct. A one-point OEE gain at a 20,000 barrel-per-day facility represents 73,000 additional barrels of annual production. iFactory deployments deliver 12 to 18 percentage points of OEE improvement within the first year. For refining, LNG, and upstream processing operations looking to close the gap between their current performance and world-class benchmarks, iFactory provides the analytical foundation, the predictive intelligence, and the operational workflow integration to make that improvement durable. Book a Demo and see how iFactory maps to your specific processing assets and OEE improvement targets.