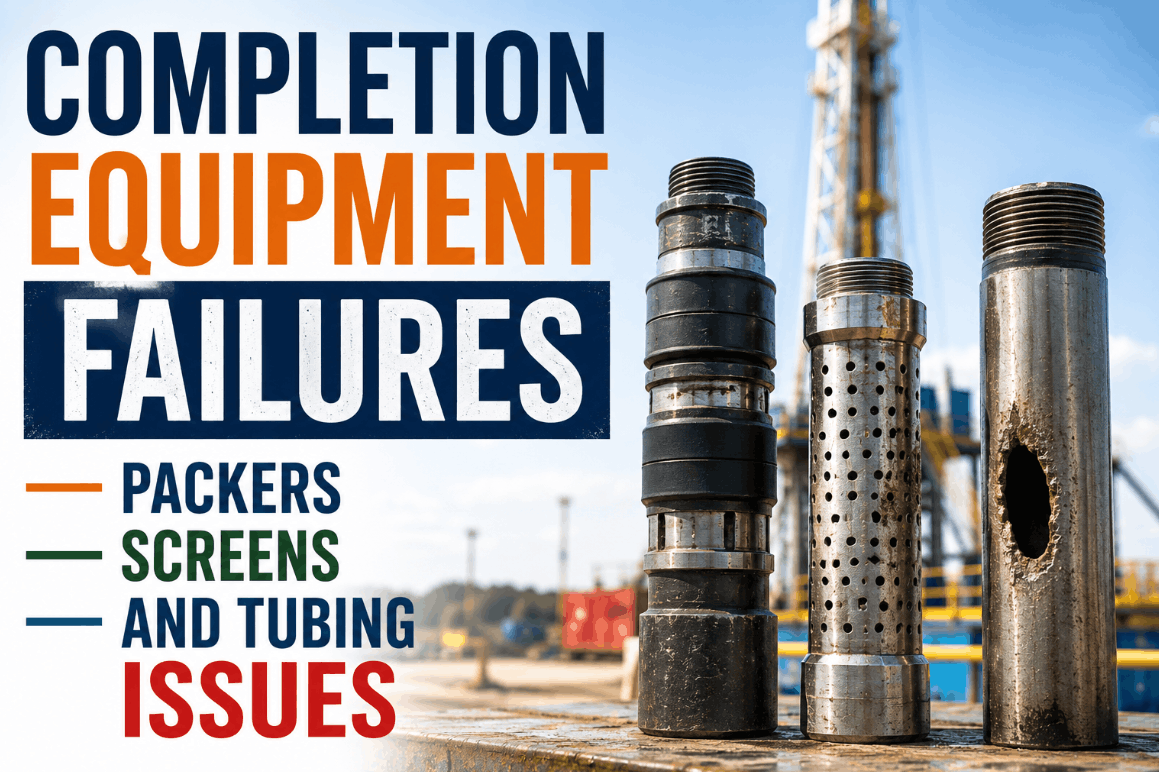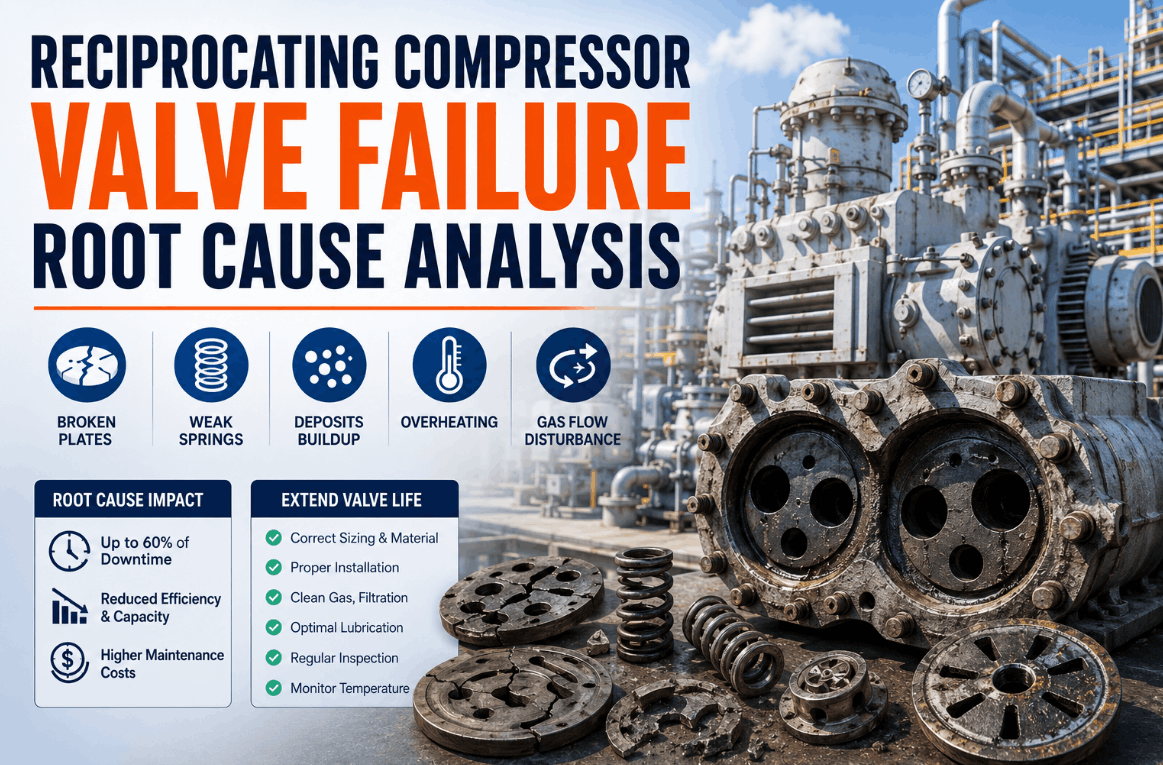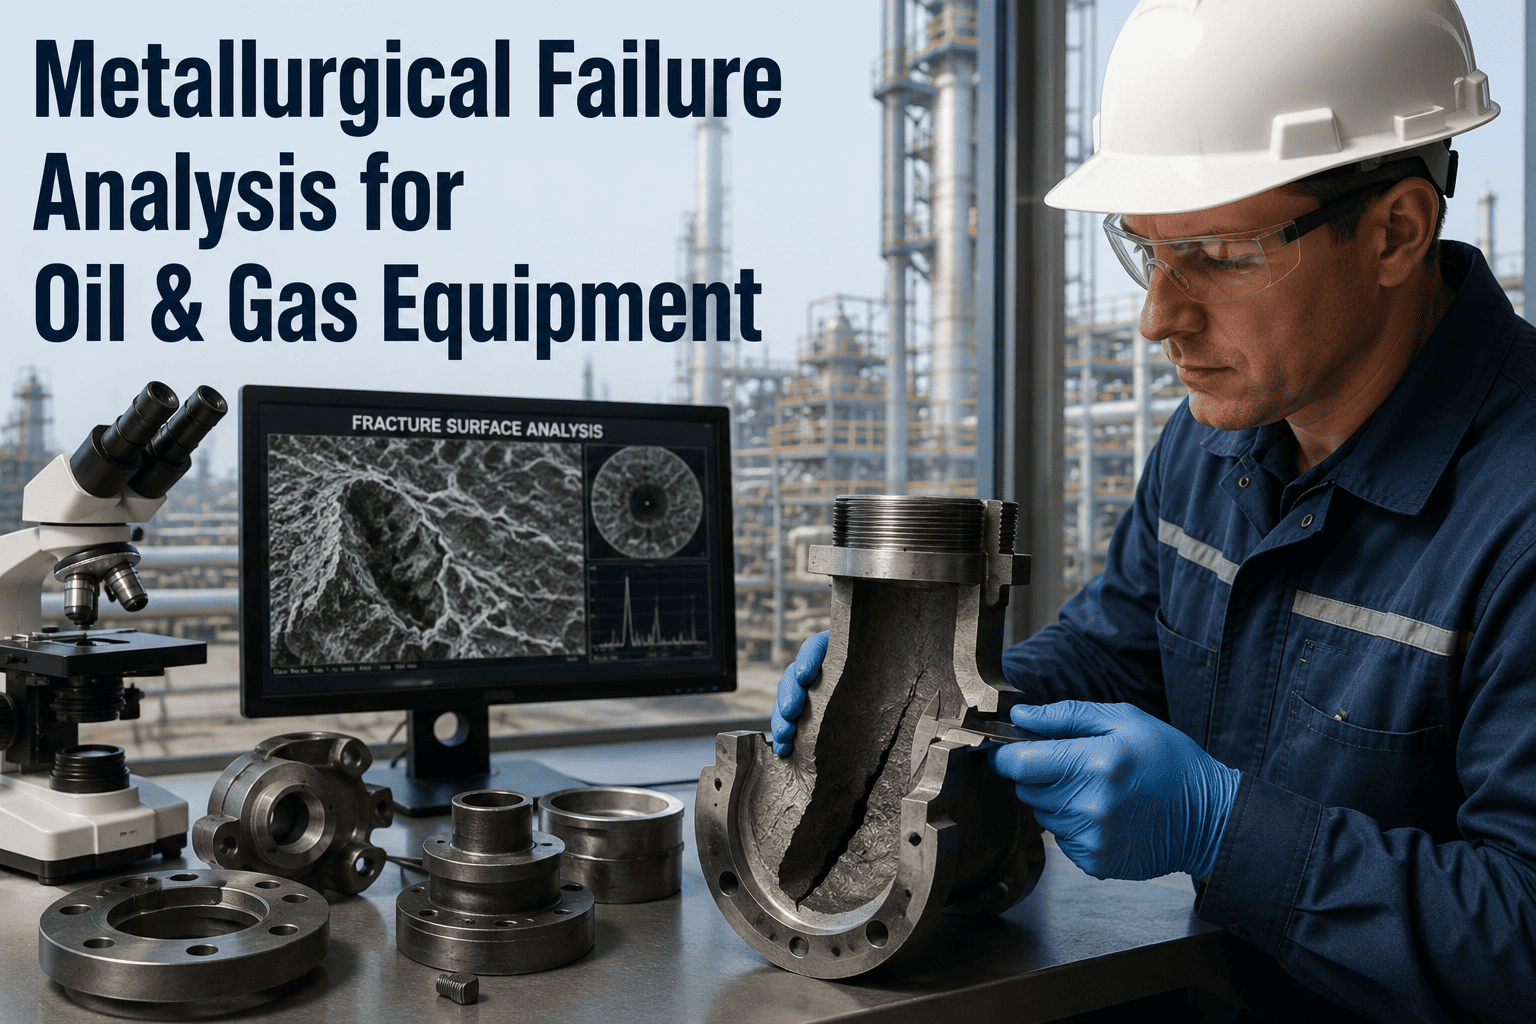
A cracked flange, a snapped sucker rod, a valve stem that failed months ahead of its rated life — every oil and gas plant eventually pulls a broken component off the line and asks the same question: why did this actually fail? The honest answer almost never matches the first guess. A fracture that looks like sudden overload under a hand lens often turns out, under a scanning electron microscope, to be classic fatigue striations that had been propagating for months. A weld that looks structurally sound can be hiding hydrogen damage introduced during fabrication years earlier. Metallurgical failure analysis exists precisely to replace that guesswork with fracture-surface evidence, and the plants that treat it as a standing capability rather than a one-off emergency call are the ones that actually stop repeat failures instead of just replacing the same part again. A demo can show how failure analysis findings tie directly into your asset history so the next technician sees the pattern immediately.
Four Fracture Modes, Four Very Different Root Causes
Every metal fracture surface carries a signature specific to how it broke, and a trained eye — or increasingly, a properly documented photographic record reviewed against known patterns — can usually tell within minutes which of four broad mechanisms was at work. Getting this classification right at the start of an investigation matters enormously, because the corrective action for a fatigue failure (address cyclic loading or vibration) looks nothing like the corrective action for hydrogen embrittlement (address welding procedure or cathodic protection current), even though both can produce a fracture that looks superficially similar to an untrained observer standing at the pipe rack.
The Investigation Sequence: How a Failed Part Becomes a Root Cause
A credible metallurgical investigation follows a sequence for a reason — skipping a step, or reordering it, risks destroying evidence the later steps depend on. Macroscopic examination and photographic documentation happen first and are non-negotiable, because cutting into a fracture surface before it's fully documented can erase the exact evidence the investigation exists to find. Only once the surface evidence is preserved does the process move toward the destructive techniques — sectioning, metallographic preparation, mechanical testing — that reveal what's happening beneath the surface.
Common Failure Mechanisms Across Oil & Gas Equipment
Certain failure mechanisms show up disproportionately often across pipelines, pressure vessels, wellhead equipment, and rotating machinery, and recognizing the pattern early narrows the investigation considerably. Stress corrosion cracking and hydrogen damage in particular are notorious for producing failures that look, at first glance, like simple mechanical overload — which is exactly why field teams that jump straight to "the part just wasn't strong enough" without lab confirmation often miss the environmental or metallurgical factor that will cause the replacement part to fail on the same schedule.
| Mechanism | Typical Components Affected | Key Diagnostic Evidence |
|---|---|---|
| Stress corrosion cracking (SCC) | Pipelines, pressure vessels, sour service tubulars | Branching intergranular cracks, minimal ductility at fracture |
| Hydrogen embrittlement / HIC | High-strength bolting, welds, sour gas equipment | Decohesive fracture, blistering, subsurface stepwise cracking |
| Erosion / erosion-corrosion | Chokes, elbows, pump impellers, valve trim | Directional wall thinning, wavy or scalloped surface pattern |
| Weld defect failure | Piping welds, pressure vessel seams, structural connections | Porosity, lack of fusion, or heat-affected-zone cracking at origin |
| Fatigue from vibration | Small-bore piping, instrument connections, rotating shafts | Beach marks, striations tracing back to a stress concentration point |
Why the Obvious Answer Is Often the Wrong One
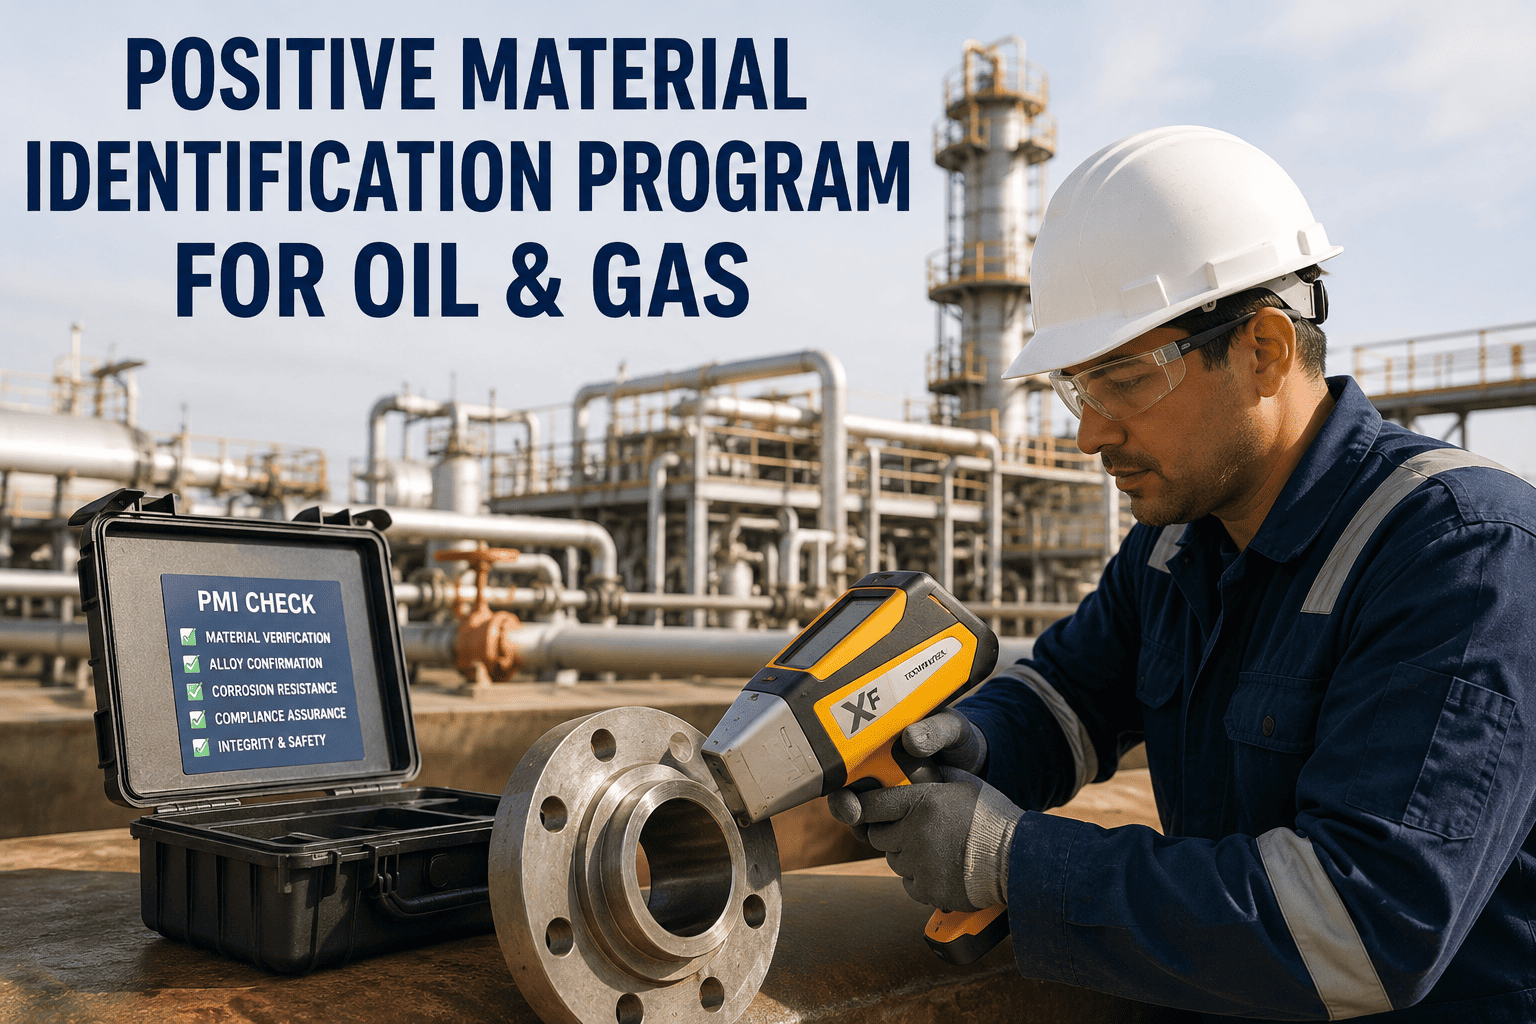
Field teams under pressure to get a line back in service tend to reach for the explanation that requires the least additional work: the part was defective, the operator overloaded it, the weather was extreme that week. Sometimes that explanation is correct. Often it isn't, and the real cause is something that won't show up without laboratory-grade evidence — a positive material identification check revealing the installed component wasn't actually the alloy grade specified, a hardness traverse showing a heat-affected zone that was never properly tempered after welding, or an EDS scan revealing that what looked like ordinary corrosion product was actually evidence of a specific aggressive species in the process stream that the original design never accounted for.
This is why root cause failure analysis is formally structured, in frameworks like API RP 585, to separate the physical cause from the root cause and the contributing causes. The physical cause is the metallurgical mechanism itself — fatigue, SCC, hydrogen damage. The root cause is almost always procedural or organizational: a material substitution that wasn't caught during receiving inspection, a welding procedure that wasn't qualified for the actual service temperature, an inspection interval that assumed a corrosion rate the process chemistry didn't actually support. Stopping the investigation at the physical cause fixes the immediate part but leaves the procedural gap in place for the next component to fall into.
From Lab Report to Prevention Program: Closing the Loop
A metallurgical failure analysis report is only as valuable as what happens to it after it's filed. Too many investigations produce a technically excellent report that lands in an inbox, gets referenced once during the immediate repair decision, and then sits disconnected from the asset's ongoing maintenance record — which means the next technician who touches a similar component six months later has no way of knowing a near-identical failure already happened and already has a documented root cause. The plants that actually reduce repeat failures are the ones that treat every failure report as a permanent addition to that asset class's history, searchable the next time a similar symptom shows up anywhere in the fleet.
This is also where field-level verification tools matter as much as the lab itself. A root cause that traces back to a material substitution is only actionable going forward if there's a reliable way to confirm, at the point of installation, that the correct alloy grade is actually being used — positive material identification checks logged against the work order rather than trusted on faith from a supplier certificate. Similarly, a root cause tied to a welding procedure gap only gets fixed permanently if the corrected procedure is tracked and enforced across every future weld on that service, not just the one that failed. Connecting failure analysis conclusions to the systems that actually govern daily field work is what turns a single report into a lasting prevention program instead of a one-time correction.