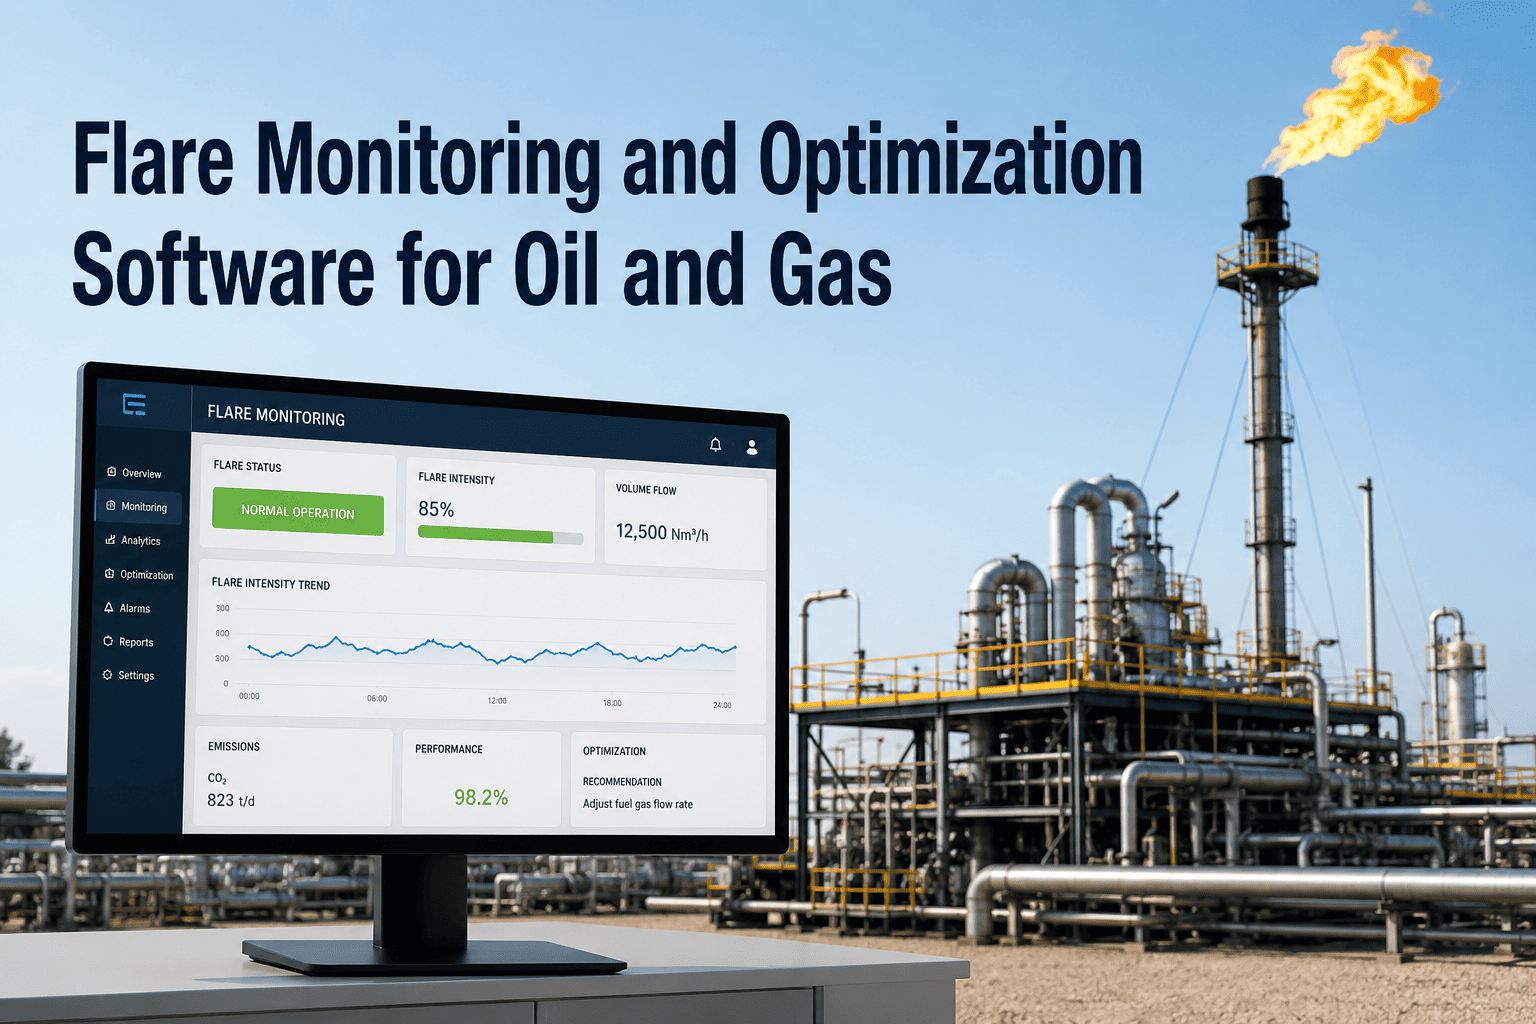
A small number of flaring events drive almost all of a refinery's flare volume and emissions — historical air district data consistently shows that so-called "significant events" account for more than 90 percent of total flaring, while the much larger number of routine, low-volume releases barely register. That means the entire question of reducing flaring comes down to correctly classifying a relatively small set of events by what actually caused them: a planned depressuring ahead of maintenance looks nothing like a pressure relief valve lifting during a process upset, and treating them the same way in a reduction program wastes effort on events that were never avoidable in the first place. See how iFactory's flare intelligence platform classifies every event automatically as it happens.
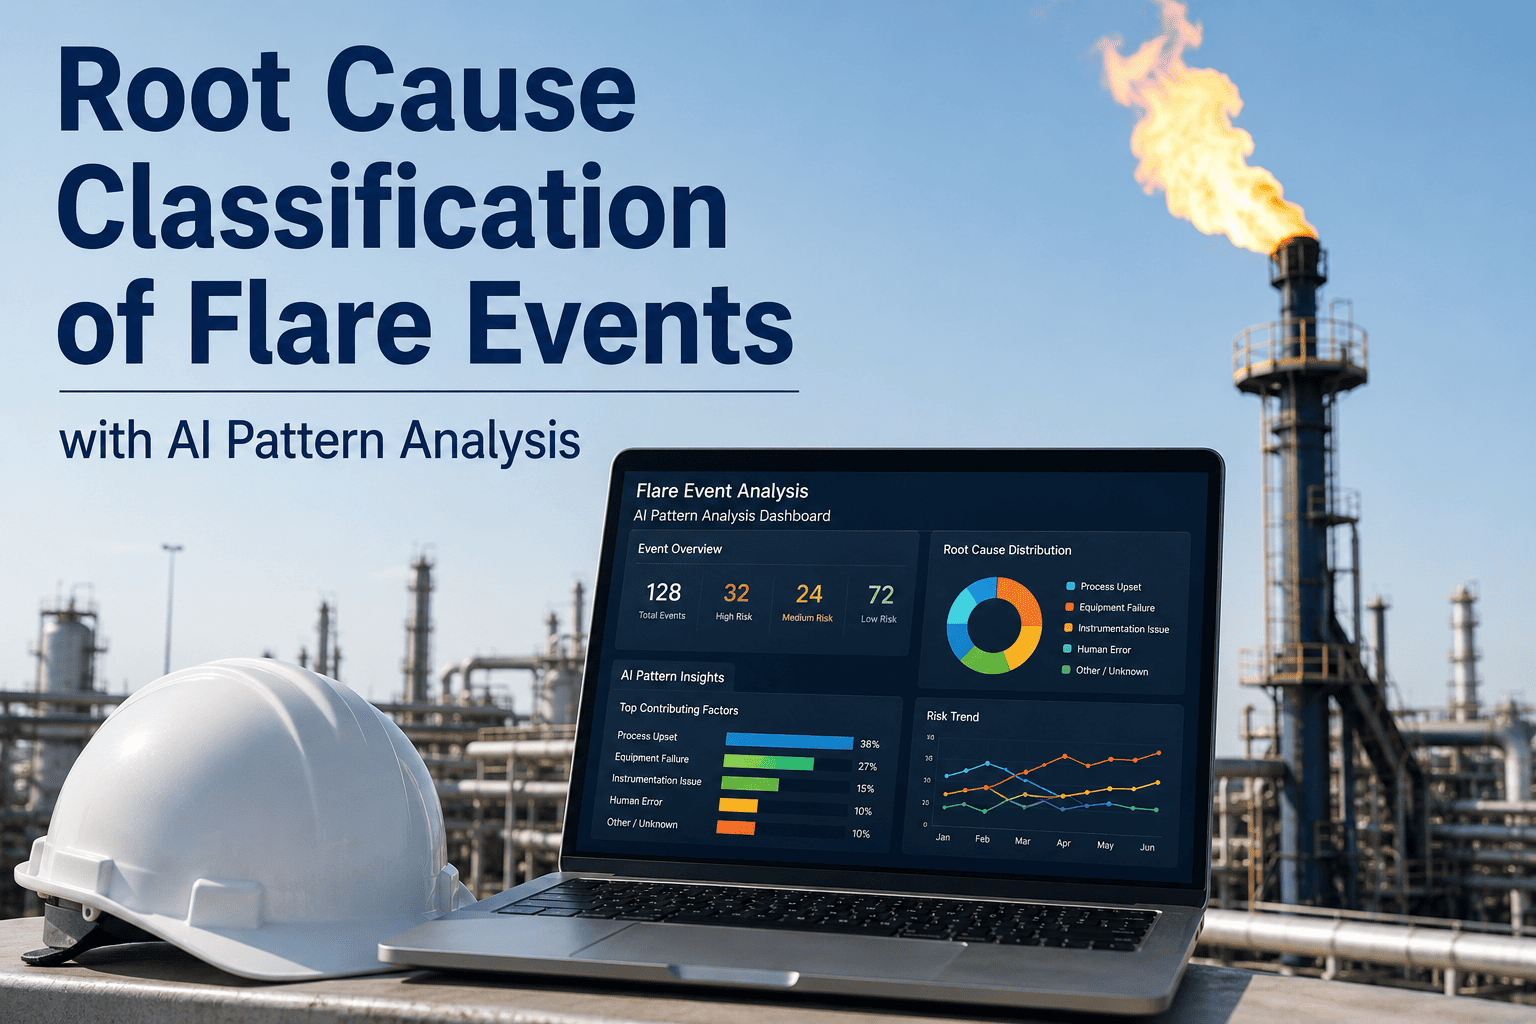
Root Cause Classification of Flare Events with AI Pattern Analysis
Every flare event tagged by cause — planned depressuring, PSV relief, process upset, startup/shutdown, or equipment malfunction — the moment it happens, not weeks later in a causal report.
The Five Root Cause Categories Every Flare Event Falls Into
Air district causal reporting requirements and internal reliability programs converge on largely the same set of categories, because every flare event ultimately traces back to one of a handful of underlying triggers. Getting the classification right on each event, down to the specific unit and component involved rather than a generic label, is what turns a flaring log into an actual reduction roadmap instead of a compliance archive nobody revisits.
Planned Depressuring
Scheduled venting ahead of maintenance, equipment isolation, or a turnaround. Expected, budgeted, and generally the least actionable category for reduction since the event itself is intentional.
PSV / Relief Valve Lift
A pressure safety valve opening in response to overpressure — sometimes a legitimate safeguard response, sometimes a symptom of a valve set point or seat issue worth investigating on its own.
Process Upset
A deviation in the process itself — a control loop excursion, a feed composition swing, or a unit trip — that pushes vent gas to the flare header faster than routine operation would.
Startup / Shutdown
Gas flared while a unit comes online or goes offline, before gas quality or system balance is stable enough to avoid the flare — frequent, generally expected, but sometimes extended by an avoidable delay.
Equipment Malfunction
A mechanical failure — a control valve positioner, a compressor trip, an instrument fault — that forces gas to the flare as a direct consequence of the failure rather than a process condition.
These five categories aren't equally distributed, and they aren't equally actionable. Planned depressuring is close to a fixed cost of operating the plant — a reduction program can shrink it at the margins through better staggering and scheduling, but it can't eliminate the need to safely take equipment offline for maintenance. The unplanned categories are where a facility actually has leverage, and within those three, equipment malfunction tends to be the most tractable, because a recurring mechanical failure usually has a specific, identifiable asset behind it rather than a diffuse process condition.
Why the Classification Isn't Optional
Air districts covering major refining regions require a documented causal analysis for flaring events that exceed defined thresholds, and the primary causal factor has to be identified and reported — not just the volume flared. A causal report that says "process upset" without identifying which specific deviation triggered it, or "equipment malfunction" without naming the failed component, doesn't satisfy the reporting requirement and invites a follow-up inquiry from the reviewing agency.
The reporting bar has also risen over time. Where an early flare minimization plan might have satisfied a regulator with a volume total and a one-line cause description, current expectations from major air districts push toward component-level specificity — which valve, which loop, which compressor — because that's the level of detail a facility actually needs to demonstrate it understands its own recurring problems rather than just documenting that an event occurred.
How AI Pattern Analysis Classifies an Event
The classification challenge isn't a lack of data — modern flare headers already carry flow, pressure, and composition instrumentation. The challenge is correlating that signal against the surrounding process context fast enough to assign a cause before the event report is due, instead of an engineer manually reconstructing the timeline days later from historian trends and operator logs.
Event Detection
Flow and composition sensors on the flare header flag a volume or duration exceeding baseline, marking the start and end of a discrete event automatically.
Upstream Signal Correlation
Process data from every unit feeding the flare header is pulled for the same time window — pressures, valve positions, trip logs, and alarm history across the contributing units.
Pattern Matching Against a Signature Library
The correlated signal is compared against known signatures for each root cause category — a PSV lift shows a distinct pressure spike-and-release pattern that looks nothing like a compressor trip or a scheduled depressuring ramp.
Signature Detail, By Category
A planned depressuring shows a slow, controlled ramp tied to a maintenance work order timestamp. A PSV lift shows a sharp spike followed by a step-down as the valve reseats. A process upset shows a gradual drift in an upstream loop before the flare volume rises. An equipment malfunction shows an abrupt discontinuity — a valve position that stops responding to command, a compressor speed that drops to zero without a corresponding shutdown request. Each pattern is distinct enough that a correctly correlated signal rarely sits ambiguously between two categories.
Causal Classification
The event is tagged with a primary cause and, where relevant, a specific contributing unit or component — the same level of detail a causal report requires, generated automatically rather than reconstructed by hand.
Trend Rollup by Category
Classified events accumulate into a running category breakdown, so a reliability team can see whether equipment malfunctions or process upsets are the larger driver of unplanned volume this quarter.
Turn Your Flare Log Into a Classified Reduction Roadmap
iFactory correlates flare header signal against upstream process data automatically, tagging every event by root cause and contributing unit as it happens — not weeks later during causal report preparation.
A Traced Event: One Failed Positioner, Three Units Affected
A composite scenario drawn from patterns seen across refinery flare causal reporting illustrates why root cause depth matters more than volume alone. A control valve positioner on one process unit failed mid-shift, forcing an unplanned unit shutdown and a reactor depressuring that exceeded the site's flare gas recovery compressor capacity. On the flaring log, the event registered as a single large-volume release. Left at that level of detail, the natural response would be to look at the flare gas recovery system's capacity — the wrong fix, since the recovery system performed exactly as designed and simply couldn't absorb a volume that size on short notice from a failure nobody anticipated.
Correlating the event against upstream signal told a different story: the true root cause was the positioner failure two process steps upstream, which triggered a cascade — feed pulled, reactors depressured, and vent gas from multiple contributing units routed to the same header simultaneously. The corrective action that actually reduced repeat events wasn't a bigger compressor, it was a targeted reliability program on that specific positioner model across the unit, informed by classifying the event correctly as equipment malfunction rather than a generic capacity shortfall.
This is the pattern that repeats across most misclassified flare events: the largest, most visible symptom sits several steps downstream of the actual trigger, and whichever piece of equipment happens to be nearest the flare header when the alarm sounds gets the initial blame by default. A causal analysis that stops at the first visible symptom routes the corrective budget toward the wrong asset, while the actual root cause keeps generating the same category of event on a slightly different schedule. Correlating the full upstream signal chain, rather than reading the flare header data in isolation, is what closes that gap.
Manual Causal Analysis vs. AI-Assisted Classification
What a Classified Event Log Reveals
Once a full year of events is tagged by category rather than left as a flat volume log, patterns emerge that a volume-only view hides completely. Two facilities with identical total flare volume for the year can have entirely different root cause distributions — one dominated by unavoidable turnaround depressuring, the other by a recurring equipment malfunction that a targeted reliability fix could substantially reduce.
The distribution also changes how a reduction program gets funded internally. A facility that can show its flaring is overwhelmingly planned and unavoidable has a straightforward story for leadership and regulators alike — the plan is to keep executing well, not to chase a number that can't move much further. A facility where the classified data shows a rising share of unplanned equipment malfunction events has a very different, and more urgent, story: a specific asset or asset class needs reliability investment, and the classified event history is the evidence that justifies the spend.
Separates the Fixable from the Fixed Cost
Planned depressuring and much of startup/shutdown flaring is largely a fixed cost of running the plant. Equipment malfunction and a meaningful share of process upset events are where a reduction program actually has leverage.
Surfaces Repeat Offenders
A category breakdown by contributing unit shows which specific valve, compressor, or control loop keeps generating events — the same signal a bad actor ranking uses for rotating equipment, applied to flare events instead.
Strengthens the Regulatory Narrative
A flare minimization plan backed by consistent, component-level causal classification is a stronger document during air district review than one built on generic, inconsistently worded causal reports assembled by whichever engineer happened to be on shift when the event occurred.
Who Acts on a Classified Flare Event
A root cause tag only creates value once it reaches the person positioned to act on that specific category, and different categories route to different owners.
Reliability Engineering
Owns the follow-up on equipment malfunction events, using the tagged component history to prioritize which valves, compressors, or instruments need a closer reliability review.
Process Engineering
Reviews process upset events for control tuning or operating procedure gaps, using the correlated upstream signal to see exactly which deviation preceded the event.
Environmental Compliance
Uses the full classified event set to prepare causal reports and flare minimization plan updates, drawing on component-level detail rather than reconstructing each event from scratch.
Frequently Asked Questions
Why does a small number of flare events account for most of the total volume?
Refinery flare systems handle a continuous background of small, routine releases alongside occasional large events, and historical air district causal reporting data consistently shows that the larger, "significant" events — process upsets, equipment failures, major unit shutdowns — account for the large majority of total flared volume and associated emissions in a typical year. That's why a reduction program built around classifying and addressing the significant events delivers far more impact than trying to eliminate every small routine release. Visit support to see how event significance thresholds are configured.
What's the difference between a process upset and equipment malfunction classification?
A process upset originates in the process condition itself — a control loop excursion, a feed composition swing, an operating parameter drifting outside its normal band — while an equipment malfunction is a mechanical or instrumentation failure that directly forces gas to the flare, such as a failed valve positioner or a compressor trip. The distinction matters because the corrective action is completely different: a process upset points toward operating procedure or control tuning review, while an equipment malfunction points toward a specific asset's reliability program — and misrouting one as the other means the team responsible for the actual fix never sees the event at all.
How quickly can an AI system classify a flare event after it happens?
Because the classification runs against signal that's already being captured continuously — flare header flow and composition alongside upstream process data — a causal tag can be generated within the same shift the event occurs, rather than the days it typically takes an engineer to manually reconstruct the timeline from historian trends. Book a demo to see the classification turnaround on your own flare header data.
Does classifying flare events actually reduce flaring, or just document it better?
Classification by itself doesn't reduce a single cubic foot of flared gas — it's the input that makes a reduction program aim at the right target. A flare minimization plan built on accurate, component-level causal data can prioritize the specific valve, compressor, or control loop generating repeat unplanned events, rather than spreading improvement budget evenly across a volume log that doesn't distinguish an avoidable equipment failure from an unavoidable turnaround depressuring. Facilities that have paired flare gas recovery equipment with better causal tracking have documented reductions exceeding 99 percent in some tracked hydrocarbon flaring streams, though results vary widely depending on starting baseline and what recovery equipment was already in place.
Can this classification approach also help with regulatory causal reporting deadlines?
Yes. Because the root cause and contributing unit are identified automatically as the event happens, a causal report draft is available well ahead of typical filing deadlines instead of being assembled under time pressure from historian data days later — reducing both the reporting burden on environmental compliance staff and the risk of a shallow causal factor that triggers a regulatory follow-up request. Contact support for details on report generation.
See Your Flare Events Classified by Root Cause
iFactory turns raw flare header signal into a component-level causal classification for every event, automatically — the foundation for a flare reduction program that targets what's actually fixable.