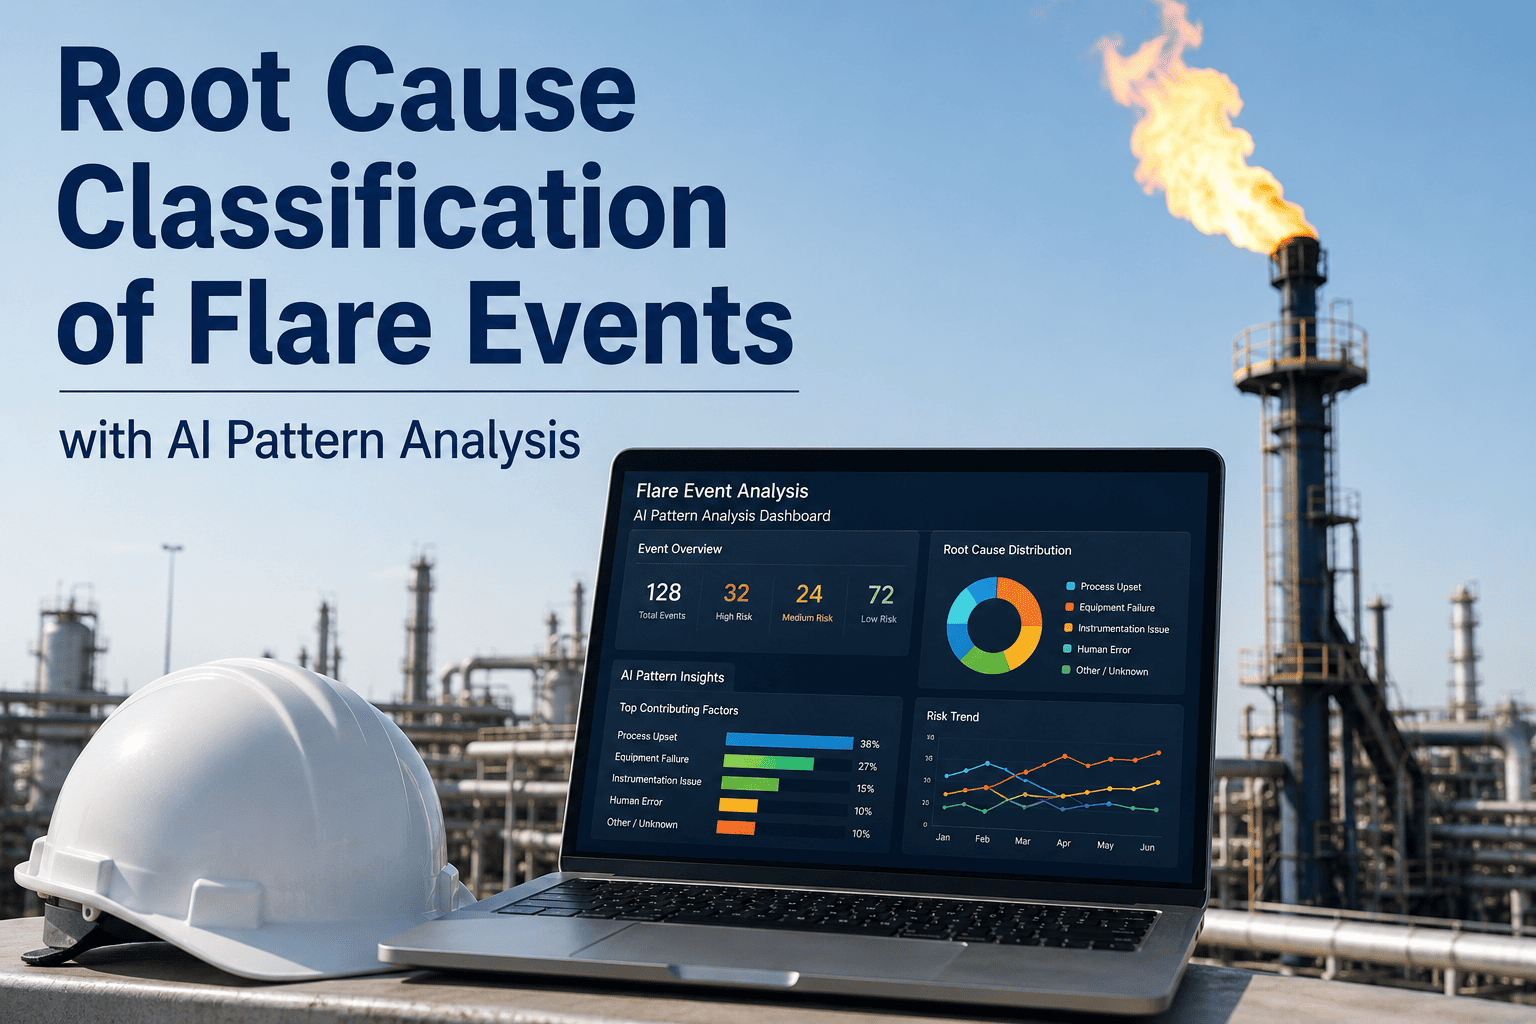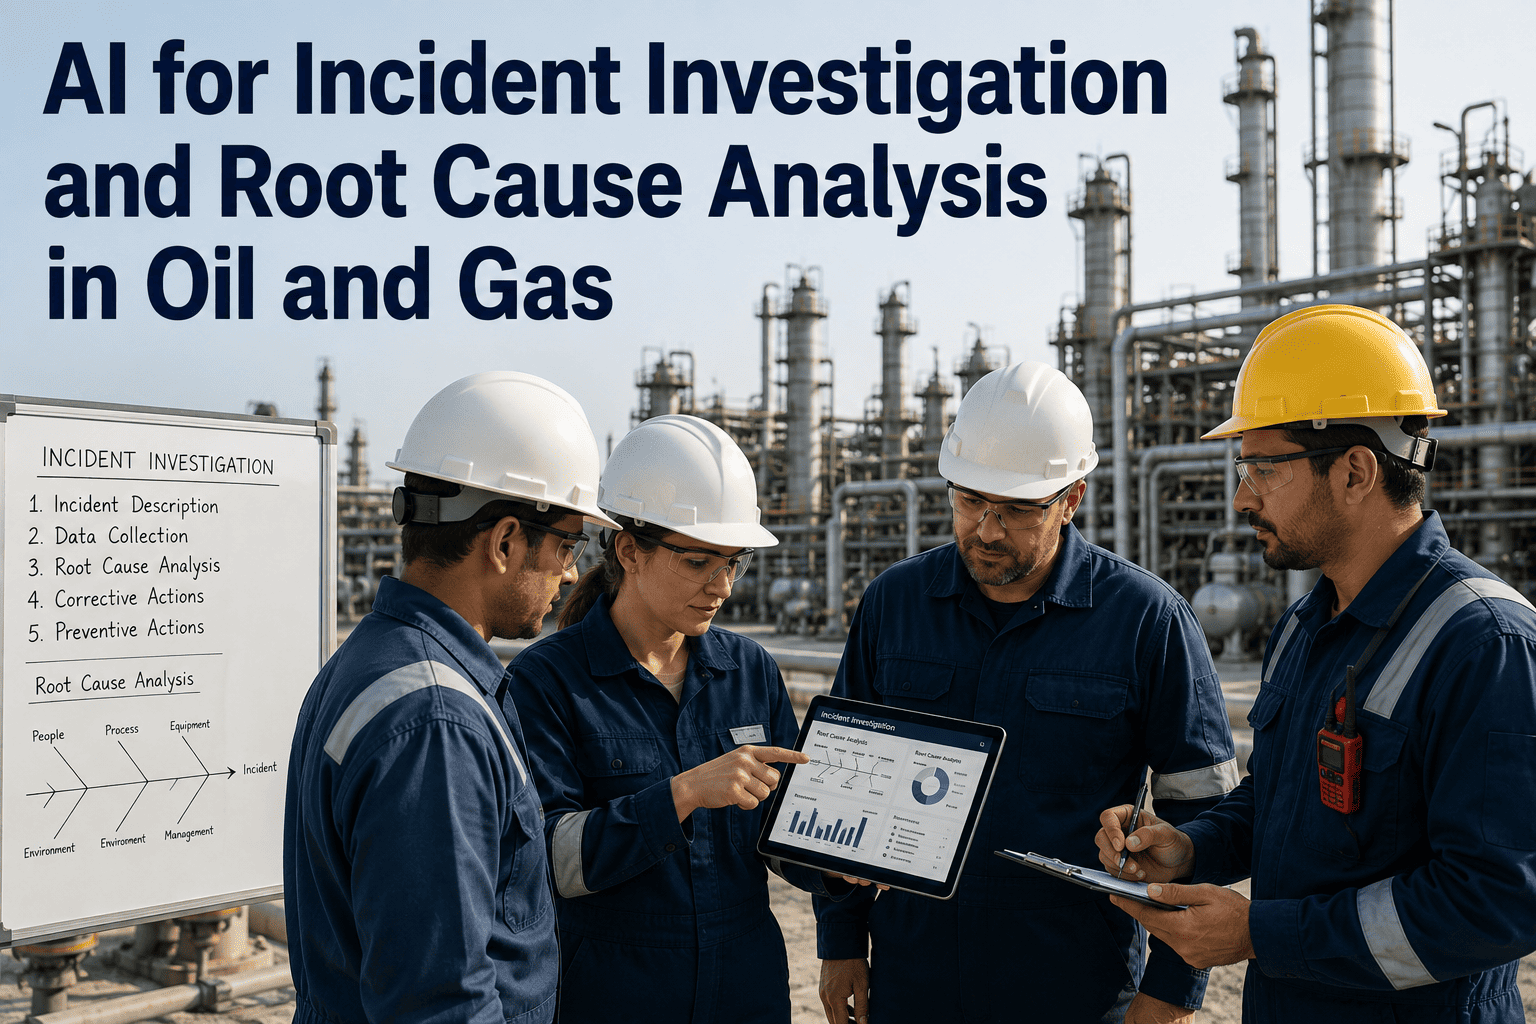
Three weeks after the event, the investigation report lands on a desk and concludes that an operator failed to follow procedure. Everyone signs it. Retraining is assigned. Eleven months later something remarkably similar happens on a different unit, and the new report reaches almost the same conclusion. This is not a story about bad investigators — it is a story about what happens when a team of four people has to reconstruct a sequence of events from historian exports, handwritten shift logs, permit records, alarm files, and interviews conducted after memory has already degraded. AI changes the reconstruction step specifically, and you can book a demo to see it rebuild a timeline from your own incident data.
Evidence Starts Degrading the Moment the Alarm Clears
Every investigator knows the feeling of arriving at a scene that has already been made safe, cleaned up, and partially returned to service. That is not negligence — it is the correct operational response, and it is also the beginning of evidence loss. Physical evidence is disturbed within hours. Human recollection begins reshaping itself almost immediately, and by the time formal interviews happen days later, witnesses have already discussed the event with each other and converged on a shared narrative that feels like memory but is partly reconstruction. Meanwhile the digital record — historian tags, alarm logs, controller events, access records — sits completely intact and largely unexamined, because extracting and aligning it is slow, manual work that nobody has time for in the first week.
This asymmetry is the practical opening for AI in investigation work. The evidence that decays fastest is exactly the evidence investigators prioritise, while the evidence that never decays is the evidence they reach last, if at all. A typical process unit generates thousands of tags at sub-minute resolution, alongside alarm and event journals, operator action logs, permit records, and maintenance history. No investigation team reads all of that. They sample it, guided by a hypothesis formed in the first forty-eight hours — which means the hypothesis shapes the evidence review rather than the evidence shaping the hypothesis.
Regulatory expectation makes the gap more consequential. Employers covered by the OSHA Process Safety Management standard are required to investigate incidents that resulted in, or could reasonably have resulted in, a catastrophic release of highly hazardous chemicals, and both OSHA and the EPA urge operators to conduct genuine root cause analysis rather than stopping at the immediate cause. Incident investigation is one of the fourteen elements of the PSM standard, sitting alongside mechanical integrity, management of change, and process hazard analysis — elements that investigations routinely reveal as contributing factors, but only when the investigation goes deep enough to reach them.
Five Evidence Streams, One Synchronised Timeline
The single most valuable output of AI-assisted investigation is not a conclusion — it is a chronology. When sensor data, alarm records, operator actions, permit status, and communications are aligned on one clock, contradictions and gaps become visible immediately. A permit that shows work completing at a time when the controller shows the valve still stroking. An alarm that annunciated eleven minutes before anyone acknowledged it. A handover note describing a condition the historian says had already resolved. Investigators find these things eventually. The difference is whether they find them in week three, after a hypothesis has hardened, or in hour six, while the picture is still genuinely open.
Building this manually is entirely possible and is what good investigation teams already do. It typically consumes the majority of the investigation calendar. Historian exports arrive in one format, the alarm journal in another, permits in a document system, handover logs on paper or in a separate application, and every clock is offset slightly differently. Reconciling all of it is the least intellectually demanding and most time-consuming part of the whole exercise, and it is the part that determines whether the analysis phase begins with a complete picture or a partial one. Automating the reconstruction does not replace investigative judgement — it moves the calendar so that judgement gets applied to a full dataset instead of a sample.
Why Most Investigations Stop Three Layers Too Early
Industry research on investigation practice puts a number on something safety professionals have long suspected: an estimated 60 to 70 percent of investigation reports identify human error as the root cause in a way that researchers and regulators consider superficial, and around 72 percent of resulting corrective actions are administrative controls or retraining — the least effective levels of the hierarchy of controls. Those two figures describe the same failure from different angles. Stop the analysis at the person, and the only available remedy is to do something to the person.
Reaching Layer 5 is not primarily a matter of investigator skill — it is a matter of evidence access. Establishing that alarm rationalisation was incomplete requires comparing the current alarm configuration against the modification record and the procedure library. Establishing that the panel was flooded requires counting annunciations per minute across the transition window. Establishing that staffing assumptions changed requires cross-referencing shift rosters against the original design basis. Each of those checks is straightforward in isolation and prohibitively slow to perform manually within an investigation timeline. When the system performs them automatically as part of reconstruction, the deeper layers stop being optional.
There is a cultural dimension worth naming honestly. Concluding that an individual made a mistake is organisationally convenient in a way that concluding the management of change process is broken is not. Research on investigation practice repeatedly finds that the organisations closing this gap are the ones whose leadership actively protects investigators who surface uncomfortable systemic findings. Software does not solve a culture problem. What it does is remove the excuse that the evidence was not available, which shifts the conversation from what could be proven to what the organisation is willing to act on.
Investigating the Wide Base, Not Only the Narrow Peak
API RP 754 organises process safety events into four tiers, and it exists precisely because the industry learned the hard way that counting only the worst outcomes provides no warning. The framework emerged from an industry working group following the Baker Panel report on the 2005 BP Texas City refinery explosion, in which fifteen people died — a review that centred on the absence of leading indicators preceding the catastrophe. Tiers 3 and 4 were designed to surface barrier erosion while it is still correctable. Book a demo to see tiered event analysis running against your own records.
The practical problem with this framework has never been the concept — it is capacity. Tier 1 and Tier 2 events are relatively rare and get full investigation resource. Tier 3 events are far more numerous, and Tier 4 signals are effectively continuous. No safety department has the staffing to investigate every relief valve lift and every missed inspection with the depth applied to a loss of containment. So the base of the pyramid gets counted rather than analysed, and the leading indicators that the framework was built to surface end up as trend lines nobody interrogates.
Automated analysis changes that arithmetic directly. When reconstruction and factor extraction are machine work, applying a consistent analytical treatment to every Tier 3 and Tier 4 event becomes feasible, and the tiers can be analysed together rather than as separate reporting streams. That is where the framework's original intent finally becomes operational: identifying that the same barrier has been challenged eleven times in six months across three units, well before the twelfth challenge becomes a Tier 1 event with a headline attached.
How AI Fits the RCA Methods Your Team Already Uses
None of this replaces established root cause methodology, and any tool that claims to should be treated with suspicion. Five Whys, fishbone analysis, fault tree analysis, and barrier or bow-tie analysis remain the reasoning frameworks that turn evidence into causation. What changes is the quality and completeness of the input each method receives, and how much of the mechanical work each method requires is done before a human starts thinking. The table below maps that division honestly, including where the method still depends entirely on human judgement.
| Method | What It Does Well | Where It Breaks Down Manually | What AI Contributes |
|---|---|---|---|
| Five Whys | Fast, accessible, effective for simple linear causation chains | Stops at whichever answer feels satisfying, usually at the human factor layer | Supplies evidence for each successive why, so the chain continues while data supports it rather than stopping at consensus |
| Fishbone Analysis | Organises candidate causes across people, process, equipment, and environment | Categories get populated from memory, so unrepresented factors stay invisible | Populates each branch from actual records, surfacing candidate factors nobody in the room would have recalled |
| Fault Tree Analysis | Rigorous logical decomposition of how a top event could occur | Time-intensive to build and to validate each branch against real data | Tests each branch against historian and event records, marking which paths the evidence supports or excludes |
| Barrier and Bow-Tie | Maps which safeguards were meant to prevent or mitigate the event | Barrier status at the moment of the event is often assumed rather than verified | Verifies actual barrier state from controller, permit, and inspection records at the relevant timestamp |
| Timeline Reconstruction | Establishes the factual sequence every other method depends on | Consumes most of the investigation calendar and is built from a sampled subset | Aligns all sources on one clock automatically, including the records investigators would not have reached |
| Cross-Incident Pattern Review | Reveals whether an event is isolated or part of a recurring systemic weakness | Effectively never performed, because reports are unstructured text in separate files | Extracts structured factors from historical reports and matches them across sites, units, and years |
The final row is the one most safety leaders react to, because it names something they already know is happening. Investigation reports are written as documents, filed as documents, and read as documents. The findings inside them are structured knowledge trapped in unstructured text, which means the organisation cannot query its own history. Ask most sites how many incidents in the past three years involved a permit signed back before the process stabilised, and the honest answer is that nobody could produce the number without reading every report individually.
The Same Contributing Factor, Six Times, Across Four Units
Investigation research is direct about this: if the same contributing factors keep appearing in unrelated incidents — time pressure, communication breakdown, inadequate supervision — the investigation programme is reporting a systemic condition, whether or not any individual report says so. High-performing organisations have a formal mechanism for distributing learning, where a finding at one site triggers an applicability review at the others. Most organisations have an email with a report attached. The matrix below is what structured extraction across a report library makes visible.
| Contributing Factor | Unit A | Unit A | Unit B | Unit C | Unit C | Unit D |
|---|---|---|---|---|---|---|
| Alarm flood during transition | ||||||
| Procedure not matching current plant | ||||||
| Isolation signed back early | ||||||
| Handover omitted abnormal condition | ||||||
| Management of change closed incomplete | ||||||
| Single operator covering two areas |
This capability matters more now than it did a few years ago. Concerns raised across the process industries about the reduced availability of independent external investigation have centred on exactly this risk: that incidents get treated as isolated failures rather than as parts of broader systemic patterns, eroding institutional memory and slowing industry-wide learning. Whatever happens externally, the internal version of that capability is buildable today, and it depends on structuring your own investigation history rather than on anyone else publishing theirs.
The near-miss dimension compounds the value. Research consistently finds near misses grossly underreported and inadequately investigated, despite being the events with the most learning potential and the least cost attached. When investigating a near miss requires the same multi-week manual effort as investigating a serious incident, the economics guarantee it will not happen. When reconstruction and factor extraction are automated, applying real analysis to high-potential near misses becomes practical rather than aspirational.
What the Machine Does and What the Investigator Still Owns
Being precise about this boundary matters, because investigation findings carry legal, regulatory, and human weight that no automated system should be asked to bear. The useful framing is that AI handles retrieval, alignment, and pattern extraction, while every causal judgement, every interview, and every conclusion remains a human product supported by better evidence. Any vendor describing something more autonomous than this in a safety investigation context is describing a liability, not a capability.
One consequence of this split is worth stating plainly for anyone building the internal business case. The measurable saving is investigator hours redirected from data assembly to analysis, which is real but modest on its own. The far larger return is the change in what investigations conclude — corrective actions that address barriers, procedures, and management systems rather than defaulting to retraining. Given that roughly 72 percent of corrective actions currently sit at the weakest end of the hierarchy of controls, shifting even a portion of them toward engineered and systemic fixes changes the recurrence rate in a way that no amount of faster reporting ever will.