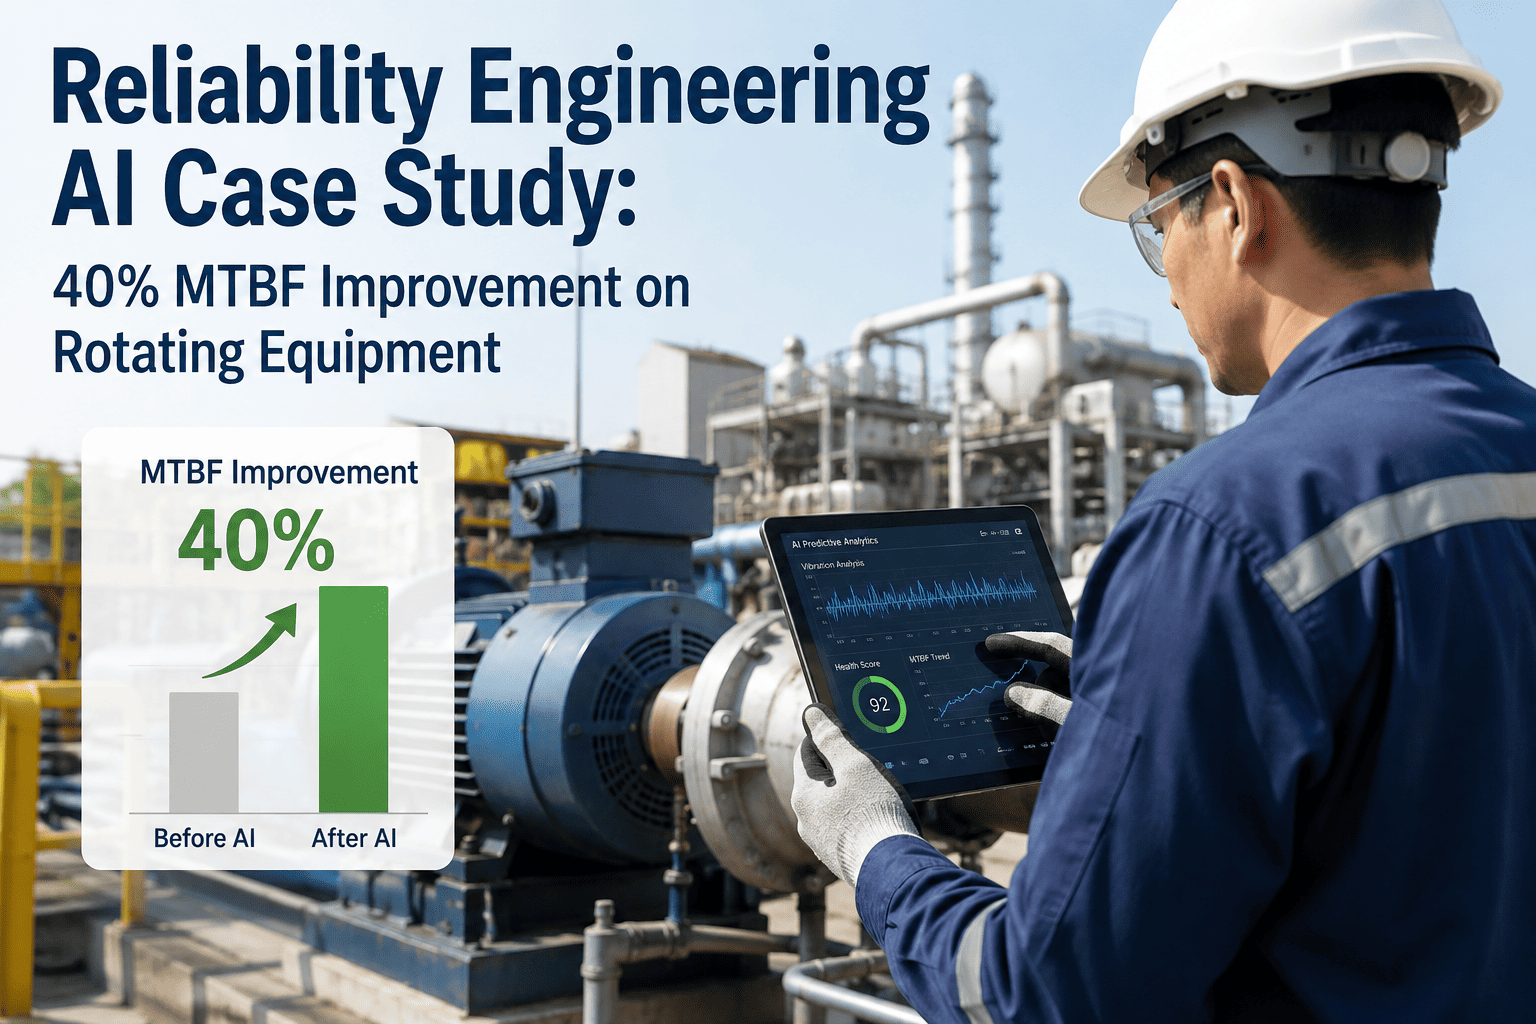
A mid-size fuels refinery running roughly 1,200 rotating assets — pumps, compressors, fans, and motors across its crude, FCC, and utilities units — spent years treating repeat failures as isolated events rather than a pattern worth measuring. Centrifugal pumps in refinery service typically run somewhere between three and ten years of mean time between failures depending on how well they're specified and installed, and this facility's fleet was sitting well below that range on its worst-performing 20 percent of assets. Over 24 months, an AI-driven reliability-centered maintenance and bad actor program pulled that fleet from reactive firefighting to a measured, ranked improvement cycle. The result: average MTBF up 40 percent across the tracked population and maintenance spend down 22 percent, without adding headcount. Full methodology and results below, or see how iFactory's reliability platform structures this kind of program.
40% MTBF Improvement Across 1,200 Rotating Assets in 24 Months
AI-driven RCM and bad actor analysis replaced complaint-driven maintenance with a ranked, data-backed improvement cycle — cutting maintenance cost 22 percent while reliability climbed.
Facility Snapshot: Where the Program Started
Before any ranking or root cause work began, the reliability team established a clean baseline — the step most bad actor programs shortcut by relying on whichever machine generated the loudest complaint that week instead of which one actually cost the most over a full operating year.
Why 1,200 Rotating Assets Resist Manual Reliability Management
A single reliability engineer can reasonably hold the failure history of perhaps a few dozen assets in their head — which pump keeps seal-leaking, which motor bearing runs hot, which compressor has needed three unplanned outages this year. Across 1,200 assets spanning three process units, that kind of institutional memory breaks down long before it covers the full population, and it breaks down unevenly: the loudest, most recent failures get remembered, while a pump quietly failing twice a year for three years running goes unnoticed because no single failure was ever dramatic enough to escalate.
That unevenness is exactly what a Pareto-style bad actor program is built to correct. Instead of relying on which failure is freshest in anyone's memory, the ranking runs against the full work order history for every asset in the population, so a pump with a long, quiet pattern of moderate-cost failures can outrank a compressor that just had one expensive but isolated event. The AI layer's contribution here isn't judgment — the criticality weighting and RCA decisions still belonged to the reliability engineers — it's simply making sure the ranking reflects the complete twenty-four-month record instead of whatever happened to be top of mind that week.
The Baseline Problem: A Full Work Order Log, No Ranked Priority
The plant wasn't short on maintenance data — 24 months of work order history existed for nearly every asset. What it lacked was a way to turn that history into a ranked list. Twelve to twenty-four months of work order records is generally enough to calculate a reliable MTBF, MTTR, and total cost of unreliability per asset, but only if someone actually pulls and cross-references it, which this team had never done systematically before the program began.
The Four-Step Bad Actor Methodology
Rather than reacting to the newest failure, the team adopted a repeatable ranking-and-elimination cycle. The AI layer's role was narrow and specific: turn scattered work order text and sensor history into a ranked, cross-referenced list fast enough that engineers could spend their time on root cause work instead of spreadsheet assembly.
Concretely, that meant parsing free-text failure descriptions from years of work orders into consistent failure codes, matching those codes against parts cost and downtime hours, and layering a criticality score derived from each asset's position in the process — spared or unspared, feeding a bottleneck unit or not. None of that replaced engineering judgment on root cause; it simply removed the weeks of manual data assembly that used to happen before judgment could even start.
Failure History Audit
Every work order, failure code, and repair action across the 1,200-asset population was pulled and normalized, establishing an MTBF and MTTR baseline per asset rather than a single plant-wide average that hides the worst performers.
Pareto Ranking by Cost and Criticality
Assets were ranked by total downtime cost and failure frequency, then cross-referenced against process criticality — a repeat failure on a spared, non-critical pump ranks differently than the same failure pattern on an unspared compressor feeding the FCC unit.
Root Cause Analysis on Top-Ranked Assets
The highest-ranked bad actors received formal RCA — fishbone diagrams and 5-Whys for single, well-understood failure modes, and fault tree analysis for assets with multiple recurring failure patterns that a shallow review would have missed.
Corrective Action and Re-Measurement
Fixes ranged from precision alignment and lubrication standards to PM interval changes and, on the most critical assets, condition monitoring. Each asset was re-measured against its own baseline the following quarter, not against a plant-wide average.
One Bad Actor, Traced End to End
The clearest illustration of why criticality-weighted ranking mattered came from a single feed pump on the crude unit. On raw failure count alone, it wasn't the plant's worst performer — a handful of other pumps had failed more often over the same period. But it sat unspared, feeding a unit that could not run without it, and its repair history showed a pattern nobody had connected: three seal failures in eighteen months, each one initially logged and resolved as an isolated event with a different apparent cause.
Cross-referencing the three work orders against the pump's operating data showed a common thread — each failure followed a period of operation outside the pump's best efficiency point, driven by a control valve sequencing choice made upstream. No single work order technician had reason to connect the dots between three separate incidents spread across a year and a half; the pattern only became visible once the failure history was reviewed as one continuous record rather than three unrelated repair tickets. Correcting the valve sequencing, rather than repeatedly replacing the seal, took the pump from an eight-month average MTBF to over twenty months, and it became the case the reliability team used internally to explain why the ranked, cross-referenced approach caught problems that individual work order reviews consistently missed.
Your Work Order History Already Has the Answer
iFactory cross-references failure frequency, repair cost, and asset criticality automatically, turning 24 months of maintenance records into a ranked bad actor list in place of a manual spreadsheet exercise.
Results by Asset Class: Before vs. After
Averaging results across all 1,200 assets flattens the story — the biggest gains concentrated on the asset classes that had been the least instrumented and the least formally reviewed before the program began.
| Asset Class | Baseline MTBF | 24-Month MTBF | Maintenance Cost Change |
|---|---|---|---|
| Centrifugal Pumps | 14 months | 21 months | -19% |
| Reciprocating & Centrifugal Compressors | 18 months | 24 months | -24% |
| Fans & Blowers | 11 months | 17 months | -21% |
| Motors & Drivers | 22 months | 29 months | -26% |
Fans and blowers started from the lowest baseline MTBF of any class in the fleet and delivered the largest relative gain, mainly because they had received the least formal attention before the program — utility-service equipment tends to get treated as low-consequence until a ranked list shows how often it was actually failing. Motors, by contrast, started from the strongest baseline and still improved by nearly a third, largely on the back of vibration-driven early detection catching bearing degradation before it progressed to a winding failure.
The 24-Month Rollout, Phase by Phase
Sustained, compounding reliability improvement typically takes twelve to eighteen months of consistent execution once the quick wins from precision maintenance are captured — this program was planned around that reality rather than promising a single dramatic quarter.
Months 1-3: Baseline and Quick Wins
Failure history audit completed across all 1,200 assets. Precision alignment, balancing, and lubrication standards applied to the top-ranked bad actors, delivering the fastest visible MTBF gains of the whole program.
Months 4-9: RCA and PM Optimization
Formal root cause analysis run on the ranked bad actor list. PM task lists and frequencies rewritten based on actual failure data rather than OEM default intervals, and condition monitoring deployed on the most critical unspared assets.
Months 10-18: Compounding Improvement
Corrective actions from Phase 2 re-measured quarterly against each asset's own baseline. Recurring failure patterns that survived the first round of fixes escalated to fault tree analysis rather than repeat 5-Whys sessions.
Months 19-24: Sustain and Re-Rank
The full 1,200-asset population re-ranked from scratch. A new set of bad actors emerged lower down the original list, confirming the cycle needed to repeat rather than close out as a one-time project.
Who Used the Ranked Data, and For What
A bad actor list only changes outcomes if it actually reaches the people who can act on it, in a form that fits how each of them already works. Four groups drew on the same underlying ranking for four different decisions.
Reliability Engineers
Used the ranked list to decide which assets received formal RCA each month, prioritizing engineering time against total cost of unreliability instead of splitting attention evenly across every open complaint.
Maintenance Planners
Rewrote PM task lists and frequencies for the assets where RCA findings pointed to over- or under-maintenance, replacing blanket OEM-default intervals with schedules grounded in the asset's actual failure history.
Operations Leadership
Reviewed which bad actors sat on unspared or bottleneck equipment, since a fix on those assets carried a direct production-continuity benefit beyond the maintenance budget line alone.
Finance and Planning
Tracked the quarterly total cost of unreliability figure as the program's core financial metric, giving the 22 percent maintenance cost reduction a clear, auditable trail back to specific asset-level interventions.
Manual Bad Actor Review vs. AI-Assisted Ranking
Three Lessons the Reliability Team Took Forward
Frequency Alone Ranks the Wrong Assets
Two pumps with identical failure counts carried very different consequences depending on whether they sat on a spared line or fed a bottleneck unit. Criticality-weighted ranking changed which assets got engineering attention first.
Quick Wins Don't Predict the Full Curve
The fast MTBF gains from Phase 1 lubrication and alignment fixes were real, but they masked how much longer the compounding gains from PM redesign and condition monitoring took to show up in the data.
The List Isn't Static
Fixing the original bad actors didn't end the program — it revealed a new tier of assets that had previously been masked by the worse performers above them. Re-ranking on a standing cadence, not a one-time project timeline, kept gains from stalling.
Frequently Asked Questions
How long does a bad actor and RCM program take to show measurable MTBF gains?
Most plants see measurable MTBF gains within 60 to 90 days by tackling the highest-impact failure modes first, since precision maintenance, lubrication improvements, and eliminating the top handful of recurring failures often deliver 15 to 25 percent MTBF improvement in the initial quarter. Sustained, compounding improvement of the kind that produced the full 40 percent gain in this case study requires 12 to 18 months of consistent execution across data audit, ranking, RCA, and re-measurement, not a single dramatic fix. Book a demo to map a realistic timeline for your own asset population.
Do we need expensive sensors before we can start a bad actor program?
No. The first phase of this program ran entirely on existing work order history and failure codes, since 12 to 24 months of records is generally enough to calculate reliable MTBF, MTTR, and total cost of unreliability per asset. Condition monitoring was added later, and only on the most critical unspared assets identified through the ranking process, rather than deployed plant-wide from day one. Visit support to see what data sources a program can start from.
What is the 80/20 rule in bad actor analysis?
It refers to the common pattern where roughly 20 percent of an asset population accounts for 80 percent of total downtime hours and repair cost, which is exactly the distribution this refinery's rotating equipment fleet showed at baseline. Ranking assets by total cost of unreliability, rather than by raw failure count, is what reliably surfaces that top 20 percent instead of chasing whichever machine failed most recently.
Why does asset criticality matter as much as failure frequency in ranking?
Two assets with identical failure counts can carry very different consequences depending on where they sit in the process — a bad actor on a bottleneck or unspared machine outranks one on a spared, non-critical line even if both fail at the same rate. Cross-referencing frequency against criticality before assigning RCA resources is what kept this program's engineering time focused on the failures that actually threatened production output.
How is the maintenance cost reduction actually achieved, not just MTBF?
Cost reduction followed reliability gains rather than being pursued directly — fewer emergency repairs, fewer expedited parts orders, and PM task lists rewritten around actual failure data instead of blanket OEM intervals all reduced spend as a byproduct of fixing the underlying failure modes. The 22 percent figure reflects total maintenance spend across the tracked population over the full 24 months, not a single cost-cutting initiative layered on top of the reliability work. Contact support for the full cost breakdown methodology.
See What a Ranked Bad Actor List Looks Like for Your Fleet
iFactory turns your existing work order history into a criticality-weighted bad actor ranking and tracks MTBF gains asset by asset, quarter by quarter — the same methodology behind this 40 percent improvement, applied to your own rotating equipment population instead of a case study fleet.