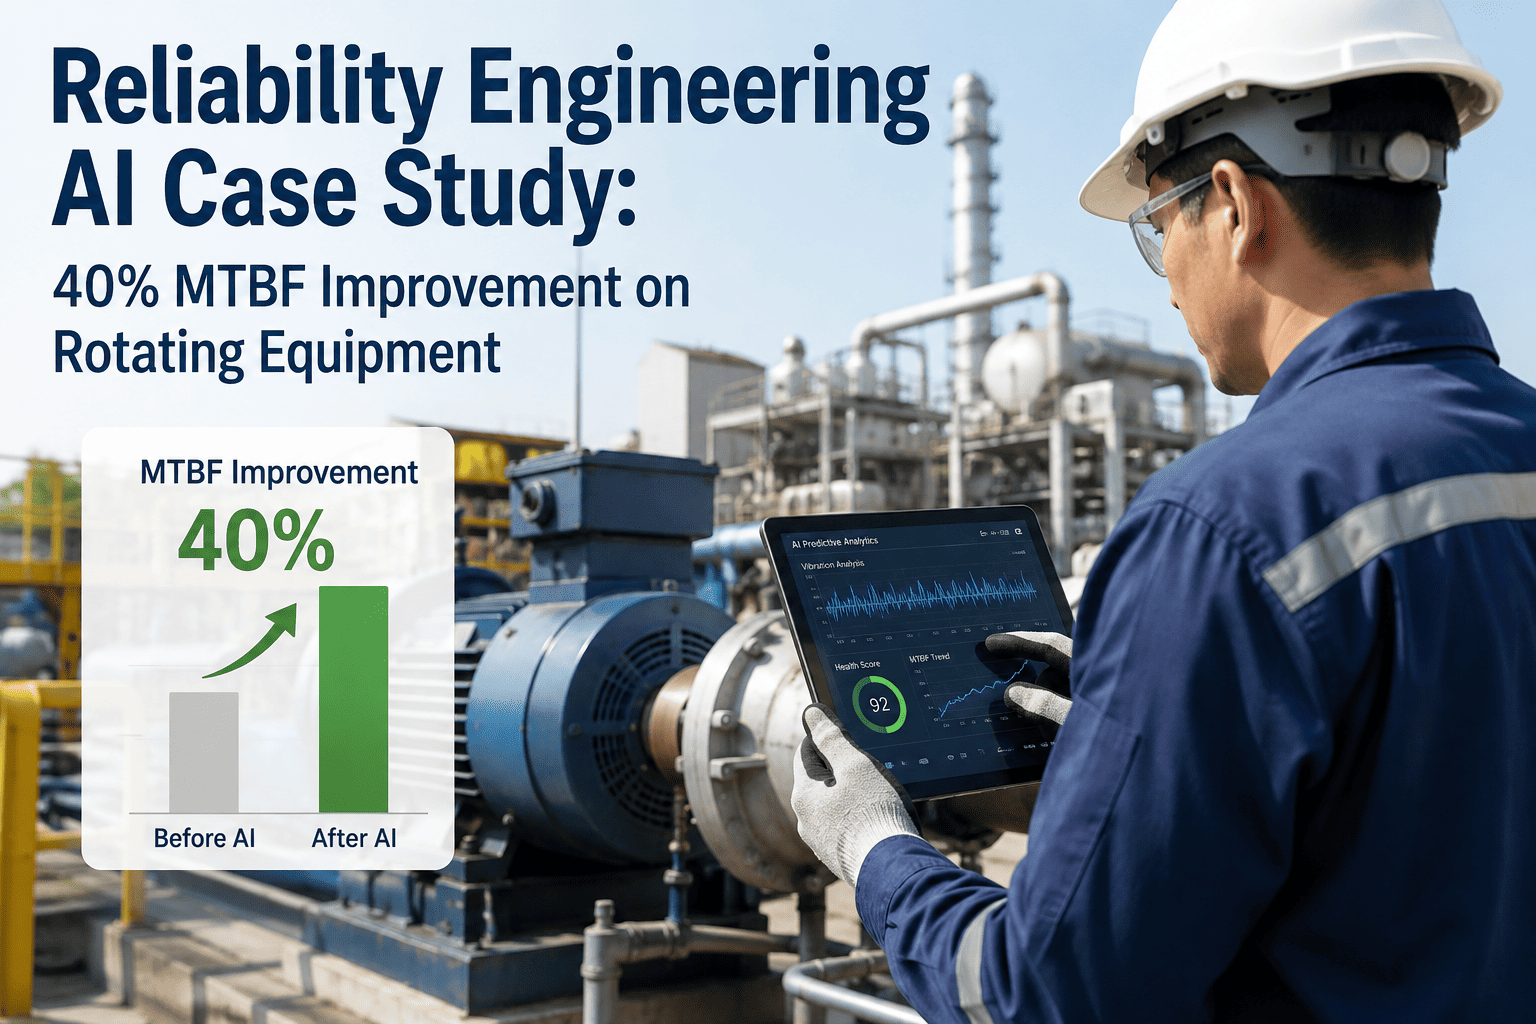
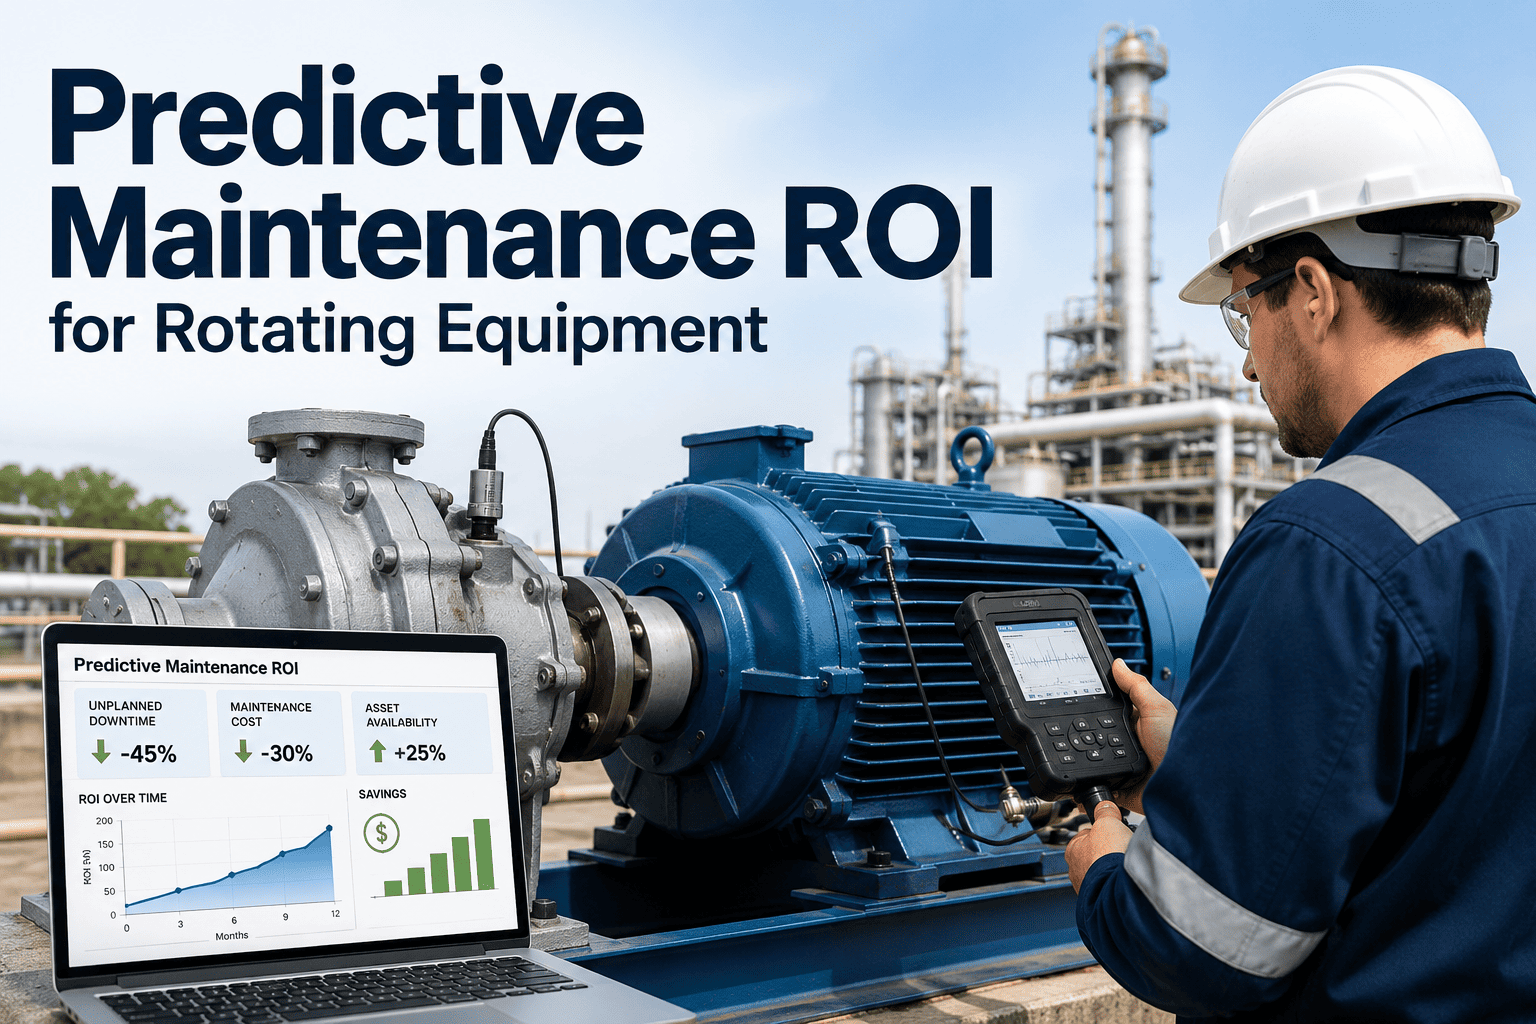
Rotating equipment — pumps, compressors, gas turbines, and motor-driven trains — generates the pressure, flow, and power that keep oil and gas facilities producing. When a pump trips or a compressor shuts down unexpectedly, the impact cascades through the process, often forcing partial or total production shutdowns that cost tens of thousands of dollars per hour. Mean Time Between Failures, or MTBF, is the metric that captures how often this equipment fails, and in most facilities the MTBF of critical rotating assets sits well below what the equipment design and operating conditions should support. Closing that gap requires moving past quick fixes to a structured approach that identifies why failures happen and eliminates the causes permanently. Teams ready to build a data-driven rotating equipment reliability program can Book a Demo to see how iFactory tracks failure patterns and drives MTBF improvement.
What MTBF Actually Measures and Why It Matters
MTBF is calculated by dividing total operating hours by the number of failure events over a defined period. It measures how frequently equipment fails — not how long repairs take, not how much repairs cost, but the raw frequency of unplanned shutdowns. A pump that runs 8,760 hours in a year and fails four times has an MTBF of 2,190 hours. A compressor that runs the same period but fails twelve times has an MTBF of 730 hours. The compressor demands three times more maintenance attention, three times more spare parts, and three times more operational disruption for the same calendar period — yet many facilities track total repair cost without ever calculating MTBF by equipment type, which means they cannot see where their reliability problem is concentrated.
The bar above represents a typical year for a piece of rotating equipment with below-average reliability. The red unplanned downtime segment is what MTBF improvement targets — not by making repairs faster, but by preventing the failures that create those shutdowns in the first place. Facilities that track MTBF by equipment type, failure mode, and operating unit can pinpoint exactly where their reliability resources will have the largest effect, rather than spreading effort evenly across equipment that has very different failure frequencies.
Where Pumps, Compressors, and Turbines Actually Fail
Each rotating equipment type has a distinct failure profile. Treating all rotating equipment the same — applying a generic preventive maintenance program regardless of type — means the maintenance tasks rarely match the failure modes that are actually driving downtime. The breakdown below shows the dominant failure modes for the three most common rotating equipment categories in oil and gas, based on aggregated industry failure data.
Mechanical Seal Failure
Largest single failure driver, caused by dry running, shaft misalignment, excessive vibration from hydraulic unbalance, or contaminated seal flush fluid reaching the seal faces.
Bearing Degradation
Often a downstream consequence of the same alignment and vibration issues that damage seals, accelerated by lubrication contamination, incorrect lubricant selection, or improper bearing installation.
Impeller and Casing Wear
Erosion from suspended solids, corrosion from process fluid chemistry, or cavitation damage that reduces hydraulic performance and increases vibration levels across the entire pump train.
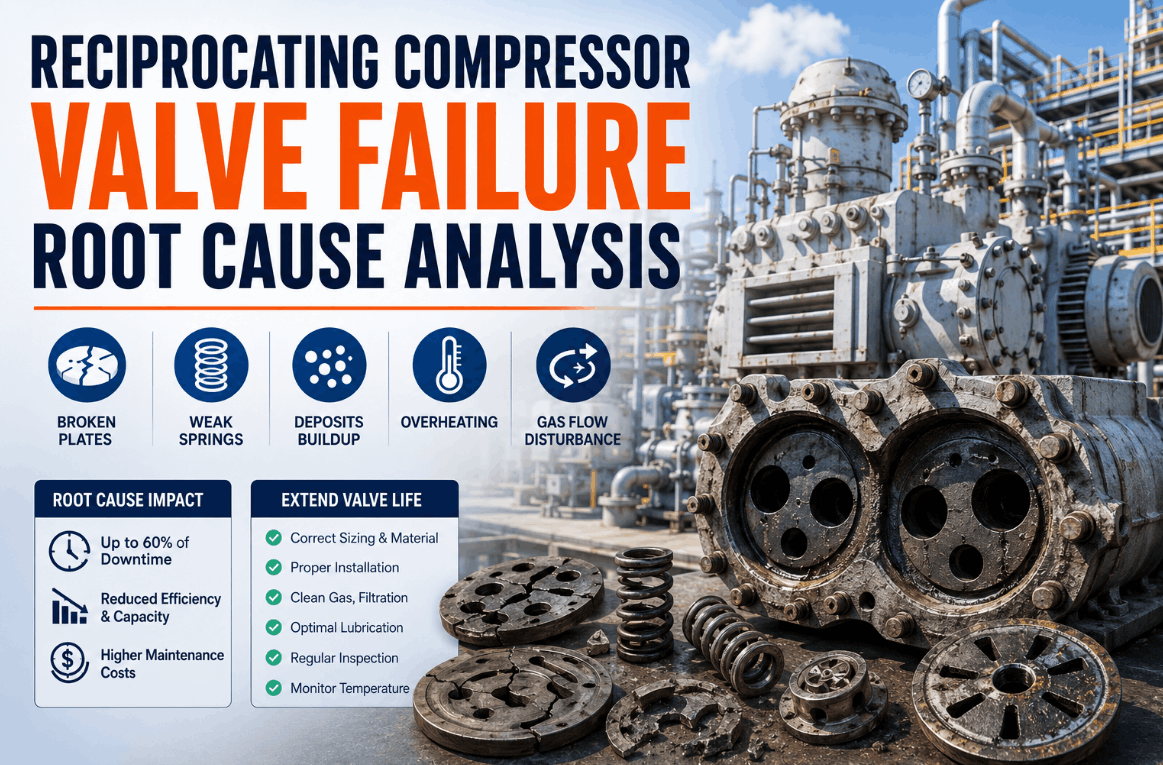
Valve Plate Failure
Compressor valves cycle thousands of times per hour and fail from fatigue cracking, impact damage from liquid carryover, or gas-side deposits that prevent proper seating and cause leakage.
Packing and Ring Wear
Rod packing degrades from friction heat, inadequate lubrication, or gas contamination, leading to increased leakage rates, rod scoring, and eventual unscheduled shutdowns for replacement.
Crankshaft and Crosshead Damage
Structural damage from liquid slugging, overspeed events, or accumulated fatigue from operating beyond design limits on pressure ratio or rod load.
Hot Section Blade Damage
Combustion turbine blades degrade from creep, thermal fatigue, oxidation, and sulfidation at operating temperatures, with failure often triggered by exceeding temperature limits during transient operation.
Bearing and Rotor Instability
High-speed rotor bearings fail from oil film disruption, electrical shaft currents, or rotor imbalance that develops as blade erosion changes the dynamic balance of the rotor assembly.
Fuel System and Controls
Fuel valve sticking, control system malfunctions, and fuel quality excursions cause unexpected trips that count as MTBF events even when the mechanical hardware is not damaged.
Why Most Failure Investigations Stop Too Early
When rotating equipment fails, the typical response is to replace the failed component, restart the equipment, and move on. The work order records that a bearing was replaced or a seal was changed, but it rarely captures why the bearing failed or what allowed the seal to be damaged. This shallow investigation pattern is the single largest reason MTBF stays flat year after year — the same underlying causes keep producing the same failures, and the maintenance team keeps replacing the same parts. The funnel below shows the four levels of failure analysis, and most facilities stop at level two.
High vibration alarm, seal leak detected, bearing temperature trip, low discharge pressure, abnormal noise from bearing housing
Bearing inner race spalling, seal face wear, impeller erosion, valve plate cracking, rod packing extrusion
Misalignment at installation, incorrect lubricant applied, operating beyond design envelope, delayed filter change, inadequate startup procedure
No alignment standard enforced, no lubrication program ownership, production pressure overrides operating limits, no MTBF tracking by equipment type
Level four causes are the ones that drive MTBF. A facility that replaces a failed bearing without determining that the root cause was a missing alignment verification step during installation will continue to see bearings fail at the same rate on every similar pump. The systemic causes at the bottom of the funnel are harder to address because they require organizational changes, but they are also the only level of analysis that produces a permanent MTBF improvement rather than a temporary parts replacement.
Where to Focus MTBF Improvement Effort
Not all reliability improvements deliver equal value. Some actions require significant capital and long lead times for modest MTBF gains, while others can be implemented in weeks with a large impact on failure frequency. The matrix below maps common rotating equipment reliability actions by the effort required to implement them and their impact on MTBF, helping teams prioritize where to start and where to invest next.
Deprioritize
Complete equipment redesign, major process changes with uncertain payoff, replacing equipment that is not a bad actor, upgrading to premium materials where corrosion rate is already acceptable
Strategic Investments
VFD installation on high-cycle pumps, upgraded dry gas seal systems on compressors, permanent online vibration monitoring networks, bearing condition monitoring with automated alerting
Maintain
Current PM tasks that are already effective, existing spare parts stocking levels that are adequate, standard lubrication routes that are being followed correctly
Quick Wins
Laser alignment on all pump installations, lube oil quality verification and contamination control, correcting operating procedure violations, filter change interval optimization
MTBF Improvement Typical Ranges After Program Implementation
The ring indicators below show typical before and after MTBF as a percentage of industry benchmark targets for each equipment type. The before values represent where most facilities start when they first begin tracking MTBF by equipment type. The after values represent what is typically achievable within twelve to eighteen months of implementing a structured reliability program that addresses the quick-win and strategic actions from the improvement matrix.
Alignment corrections, seal flush optimization, and lube contamination reduction drive the largest gains on pump populations.
Valve plate material upgrades, rod load monitoring, and liquid carryover elimination produce the most significant compressor MTBF gains.
Boroscope inspection programs, operating limit enforcement, and fuel quality controls close the gap on turbine reliability targets.
Rotating Equipment MTBF — Common Questions
What is a good MTBF target for rotating equipment in oil and gas facilities?
MTBF targets vary significantly by equipment type and service severity. Centrifugal pumps in clean service frequently achieve 18 to 24 months MTBF in well-managed programs, while sour gas compressors may target 12 to 18 months due to the inherent aggressiveness of the service environment. The right approach is to benchmark current MTBF against industry databases for the same equipment type and service conditions, then set improvement targets that close a realistic portion of that gap in each annual planning cycle rather than chasing a single number. What matters more than the absolute target is that MTBF is tracked monthly by equipment type so the trend is visible and corrective actions can be directed where they will have the most effect. Teams wanting to establish equipment-specific benchmarks can Book a Demo to see how iFactory structures MTBF tracking by asset class.
How is MTBF different from MTTR and which one should reliability teams focus on?
MTBF measures how frequently equipment fails by dividing total operating time by the number of failure events, while MTTR measures how long it takes to restore equipment to service after a failure. Both metrics matter for overall availability, but MTBF has a disproportionately larger impact because a failure that takes eight hours to repair but only happens once a year has far less production consequence than a failure that takes two hours to repair but occurs monthly. Improving MTTR through better spare parts management, faster mobilization, and improved repair procedures has real value, but the ceiling on availability improvement through repair speed alone is limited by how often failures occur. Improving MTBF by preventing failures eliminates both the repair time and the production impact entirely, which is why the most effective reliability programs prioritize failure prevention over repair acceleration. The iFactory Support team can help configure dashboards that track both metrics side by side.
What are the most common root causes of low MTBF on centrifugal pump populations?
Mechanical seal failure is the single largest MTBF driver on most pump populations, and the root causes are almost never the seal itself but the conditions the seal operates in — dry running from insufficient NPSH, shaft misalignment from improper installation practices, excessive vibration from hydraulic unbalance or worn wear rings, and contaminated seal flush fluid that erodes seal faces. Bearing failures rank second and are frequently a downstream consequence of the same alignment and vibration issues that damage seals, compounded by lubrication contamination, incorrect lubricant viscosity, or bearings that were damaged during installation. The pattern in most facilities is that these root causes are correctable with existing technology and practices — they persist not because the solution is unknown but because no one is systematically tracking which root cause is responsible for which failure and driving that root cause to closure.
How long does it take to see measurable MTBF improvement after starting a reliability program?
Facilities that focus first on the high-impact, low-effort items from the improvement matrix — correcting alignment practices on all pump installations, verifying and enforcing lubrication procedures, eliminating known operating boundary violations, and optimizing filter change intervals — typically see a measurable MTBF increase within three to six months. Reaching the full improvement potential usually takes twelve to eighteen months as the program progresses from quick wins into more structural changes such as seal system upgrades, permanent condition monitoring installations, and operating procedure modifications that require engineering review and management approval. The critical enabler is monthly MTBF tracking by equipment type so the trend is visible to both the reliability team and operations management, which maintains the organizational commitment needed to sustain the program through the longer-lead-time improvements.
Can we improve MTBF without investing in condition monitoring equipment?
Basic maintenance practice improvements — proper shaft alignment using laser tools, correct lubricant selection and contamination control, clean operating conditions with effective filtration, and strict adherence to defined operating envelopes — can typically deliver a twenty to thirty percent MTBF improvement without any condition monitoring capital expenditure. These are the quick-win actions that should be implemented first regardless of whether condition monitoring is planned. However, sustaining improvement beyond that initial gain usually requires some form of condition monitoring to detect developing failures early enough to plan interventions before catastrophic damage occurs. Vibration monitoring on bearings, temperature trending on seals and bearings, and performance monitoring on differential pressure and flow are the most common starting points for condition monitoring on rotating equipment. The question for most facilities is not whether to invest in condition monitoring but when to layer it on top of the foundational practices that must be in place first.