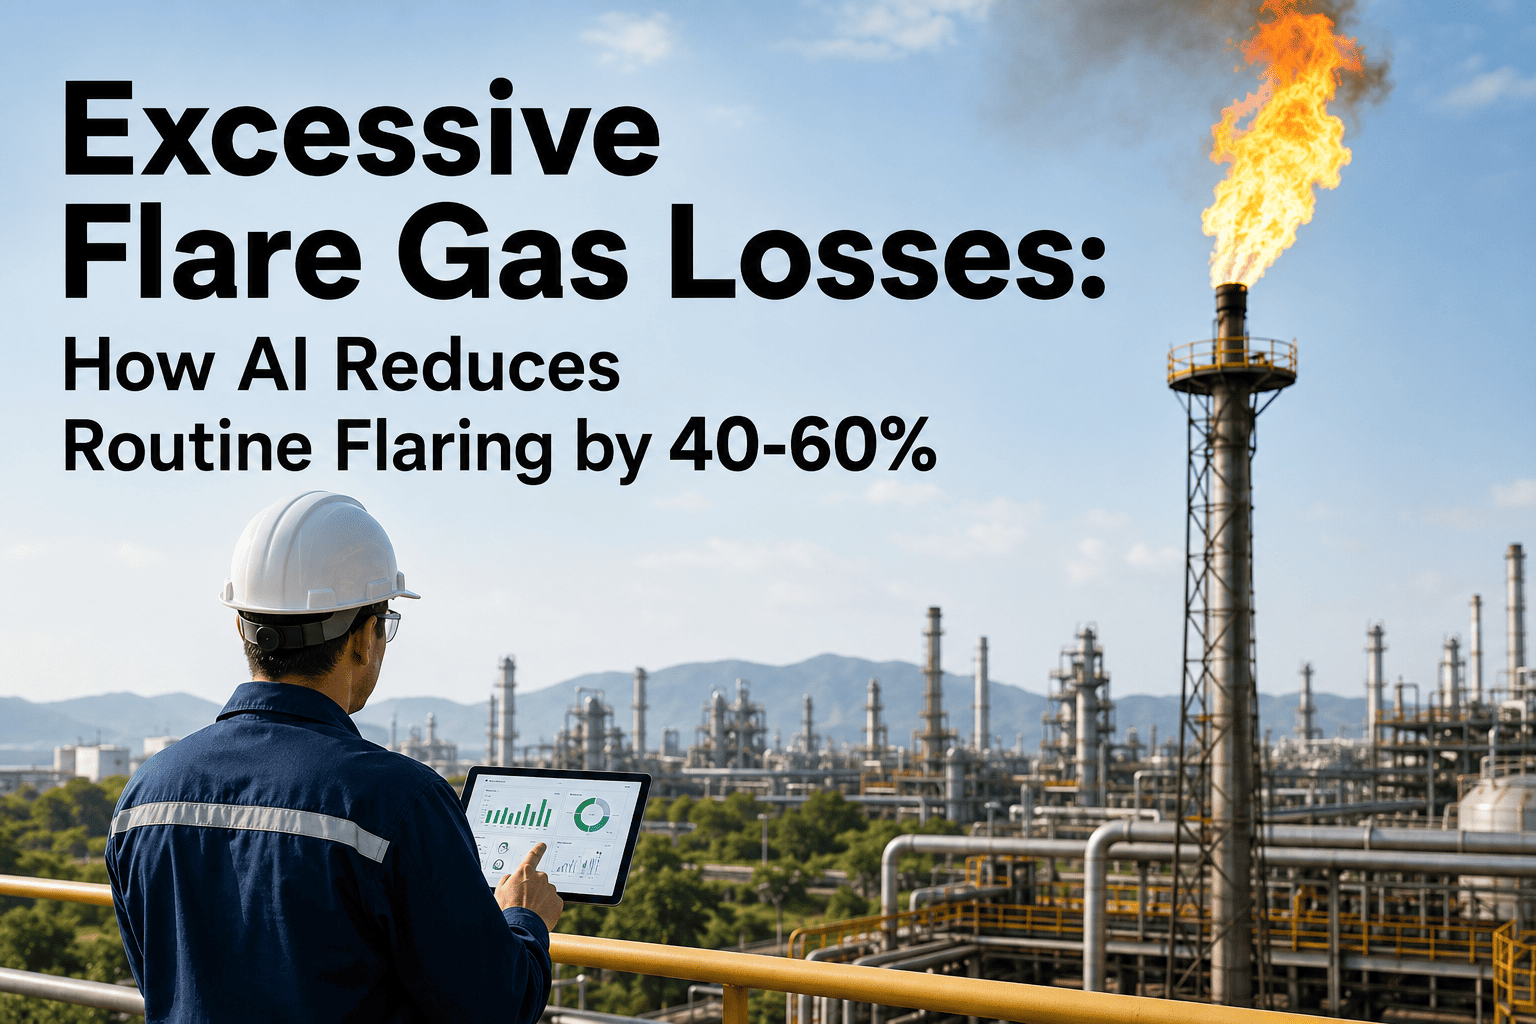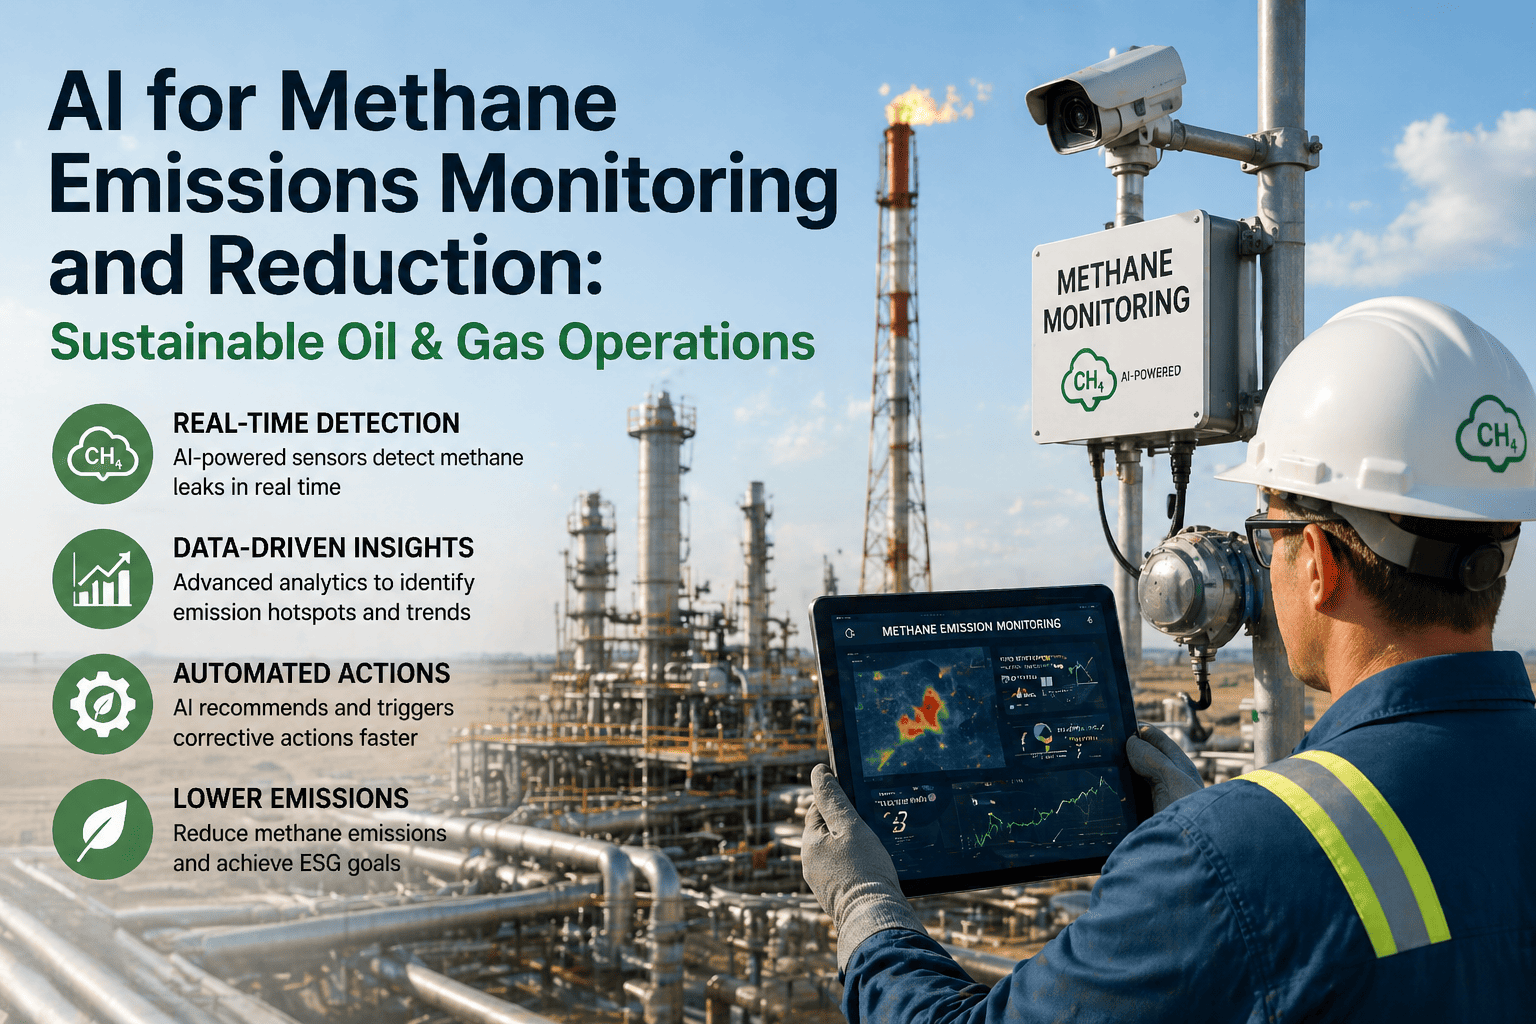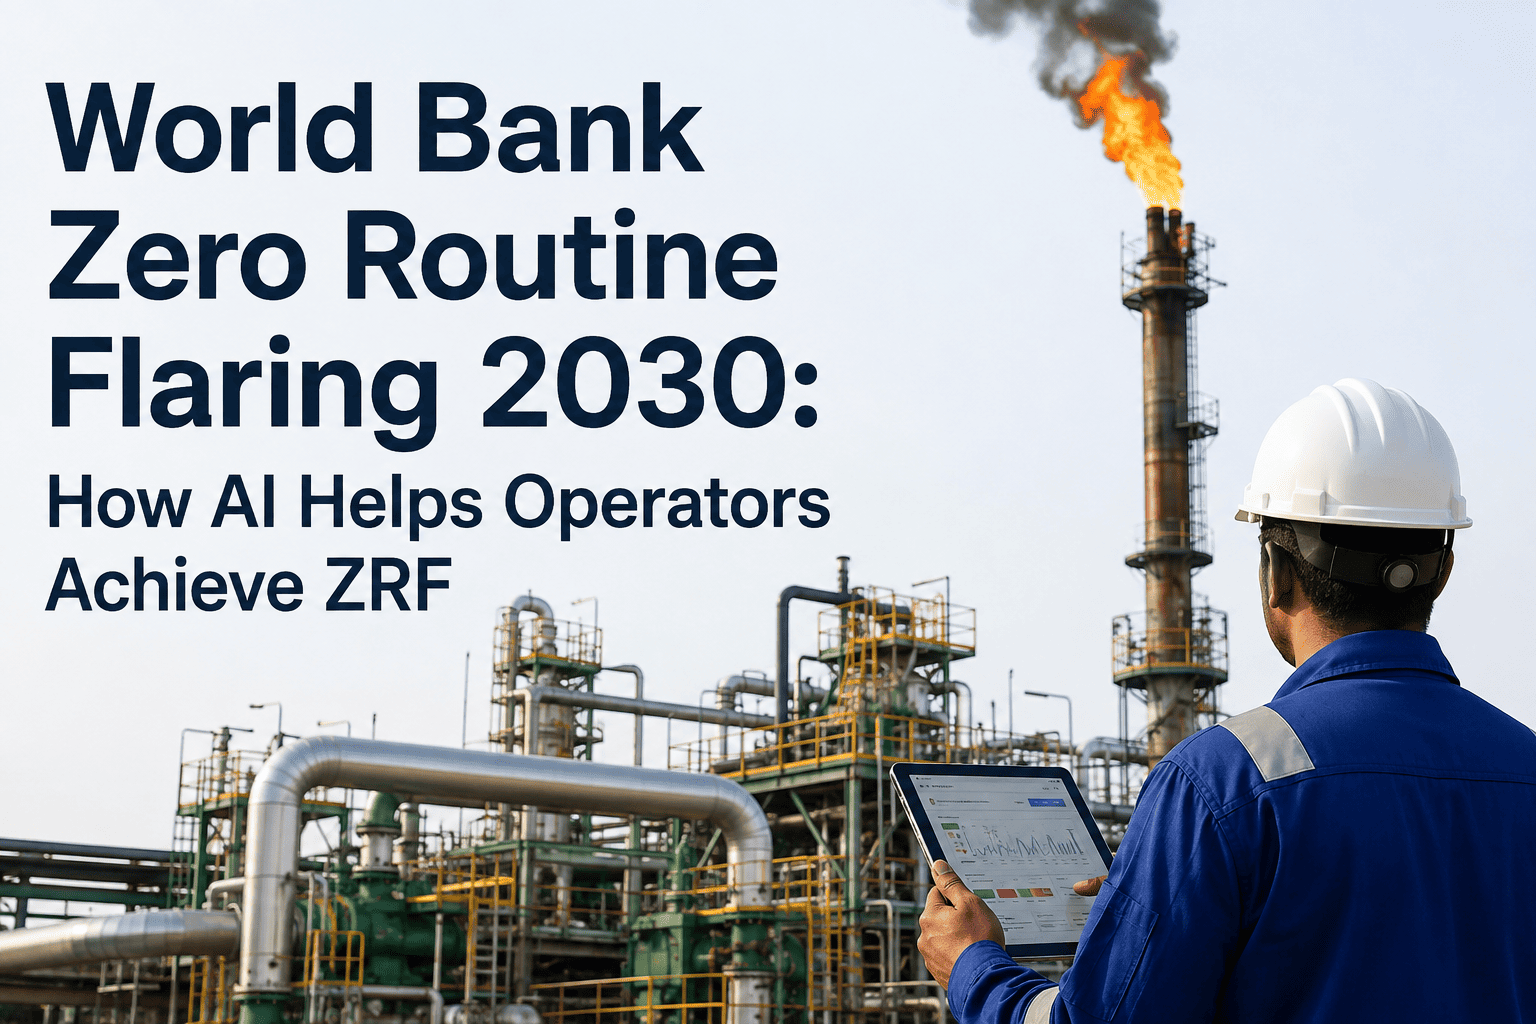
Most operators already report a flaring number every year, and most of those numbers understate the problem, because the volume that actually counts toward the World Bank's Zero Routine Flaring by 2030 initiative is not total flare volume, it is routine flaring specifically, the gas burned as a matter of normal operating design rather than as a genuine safety response. Separating the two by hand, from estimated production data and manual event logs, is exactly why so many operators can report a flaring intensity number and still have no defensible answer when asked which flares on their own asset are routine and which are not. See how AI builds that source-by-source answer at ifactory support.
Know Which Flares Are Routine Before 2030 Makes the Question Mandatory
AI that identifies flare sources, classifies routine versus non-routine events, quantifies recoverable gas volume, and tracks every site's progress against the World Bank Zero Routine Flaring 2030 target in real time.
An Annual Flaring Number Is Not the Same as a Routine Flaring Answer
Ask most operations teams for their total flare volume last year and they can produce it within minutes, usually from metering estimates rolled up at the facility level. Ask which portion of that volume was routine, meaning gas flared by design during normal production rather than during an upset, maintenance event, or genuine safety response, and the conversation slows down considerably. That distinction is not a technicality. It is the exact line the World Bank's initiative is built around, and it is the line regulators, investors, and lenders increasingly expect an operator to draw with evidence rather than estimation.
The gap exists because routine and non-routine flaring look identical from a distance. A flare stack burning gas from a well test looks the same on a satellite pass as one burning associated gas continuously because no gathering line was ever built to the site. Without source-level classification, both get grouped into one intensity number, which means the sites actually driving routine flaring, and the ones where a gas capture project would pay for itself fastest, stay invisible inside an average.
Routine Flaring vs Safety Flaring: Why the Difference Matters
Every flare stack exists partly as a safety device, so the presence of flaring on its own tells you nothing about whether an asset is on track for the ZRF target. What matters is why the gas is being burned, and that reason falls into two very different categories that require entirely different responses.
The World Bank Zero Routine Flaring Timeline
The initiative did not appear as a sudden compliance deadline, it has been building toward 2030 with endorsement milestones along the way, and the pressure to show measurable progress increases with every year that passes without a visible downward trend.
How Flares Actually Get Identified and Measured
Progress toward the target depends entirely on how flaring is detected in the first place, and the three common methods produce very different pictures of the same asset.
| Method | Update Frequency | Source-Level Detail | Limitation |
|---|---|---|---|
| Satellite / VIIRS Detection | Nightly passes | Flare location, not routine vs non-routine cause | Cannot distinguish a well test flare from continuous associated-gas flaring |
| Annual Estimate / Reporting | Once per year | Fleet or facility level only | No visibility into which specific site drives the total |
| Continuous AI Monitoring | Real time | Per-flare classification with cause attribution | Requires flow or optical sensing integrated at the stack |
None of these methods are mutually exclusive, and the strongest programs combine all three rather than replacing one with another. Satellite data still provides a useful independent check on whether ground-based sensing is catching every active source, annual reporting remains the format most regulators and investors expect to receive, and continuous AI monitoring is what actually generates the source-level classification and trend data that make the other two credible. Treating continuous monitoring as an add-on layer over existing detection, rather than a wholesale replacement, tends to be the fastest path to a defensible program.
Find Out Which of Your Flares Are Actually Routine
Bring your current flare inventory and reporting method to the call. We will walk through how AI source-level classification would break down your fleet's routine and non-routine volumes.
How AI Turns Flare Data Into a 2030 Roadmap
Meeting the target is not a single project, it is a continuous pipeline that starts with knowing where gas is being burned and ends with tracking whether the fleet is actually moving toward zero.
Where Recovered Gas Actually Goes
Identifying routine flaring only matters if there is a realistic path to stop it, and the right path depends heavily on the site's existing infrastructure, gas volume, and distance from a pipeline.
Annual Reporting vs Continuous AI Tracking
The method used to track progress determines whether a fleet actually moves toward zero or simply reports a number once a year with no visibility in between.
| Factor | Annual Manual Reporting | Continuous AI Tracking |
|---|---|---|
| Source Attribution | Fleet or facility average | Per-flare, with routine vs non-routine cause |
| Detection of New Routine Flaring | Discovered at next annual review | Flagged as soon as a pattern emerges |
| Progress Evidence for Lenders | Single point-in-time disclosure | Continuous trend line against the 2030 target |
| Capital Prioritization | Based on estimated volumes | Based on measured, ranked recoverable volume by site |
What a Fleet's Progress Toward Zero Actually Looks Like
Not sure how much of your current flaring would actually classify as routine? Talk to our team and we will help you find out.
A Common Starting Point: The Fleet Nobody Has Ranked
Most operators approaching this are not starting from zero, they already have flare data, they simply have never had it ranked by cause and volume at the site level. A typical starting point looks like this: an annual sustainability report shows a fleet-wide flaring intensity figure, satellite monitoring confirms flares exist across dozens of sites, and nobody can say with confidence which five or ten of those sites are responsible for most of the routine volume. Capital for gas capture projects gets allocated based on which site complained loudest or which asset team asked first, not based on where the recoverable gas actually is.
The shift that actually moves the needle starts with source-level classification across the full fleet, not a pilot on the largest facility. Once every flare is tagged as routine or non-routine and sized by recoverable volume, a ranked list emerges on its own, usually showing that a small number of older, unconnected sites account for a disproportionate share of the routine total. That ranked list is what turns a vague 2030 commitment into a funded, sequenced capital plan, and it is also what a lender or regulator wants to see instead of a single blended percentage.
Four Mistakes That Stall Progress Toward 2030
Why This Goes Beyond a Sustainability Metric
It is easy to treat zero routine flaring as a reporting exercise aimed at satisfying an external commitment, but the gas being flared routinely is also gas that was already paid for through drilling and completion costs and is simply being burned instead of monetized. Every cubic foot routed to a fuel gas system, an NGL recovery unit, or a sales line instead of a flare stack is revenue or cost offset that would otherwise be lost permanently. Framed that way, the business case for source-level classification stops being purely about the 2030 deadline and starts looking like a straightforward capital allocation problem, one where the sites with the most routine flaring are frequently also the sites where a modest infrastructure investment pays for itself the fastest.
Who Actually Owns Progress Toward Zero Routine Flaring
A ranked list of routine flare sources only becomes a funded project once someone is accountable for acting on it, and that accountability tends to split across a few distinct roles rather than sitting with one person.
Frequently Asked Questions
Get a Source-Level Flaring Breakdown for Your Fleet
Bring your current flare inventory and reporting method to the call. We will walk through how AI would classify your routine versus non-routine flaring today, and what a realistic path to 2030 looks like.