A power plant's quality story runs from the coal yard to the ash silo. Wet or contaminated coal hurts combustion, combustion drives tube wear and unburned carbon, and water chemistry decides how fast tubes corrode. Most plants check each step with periodic samples. This guide shows where AI vision and predictive models add real value between samples, and where they do not. Start with a plant review.
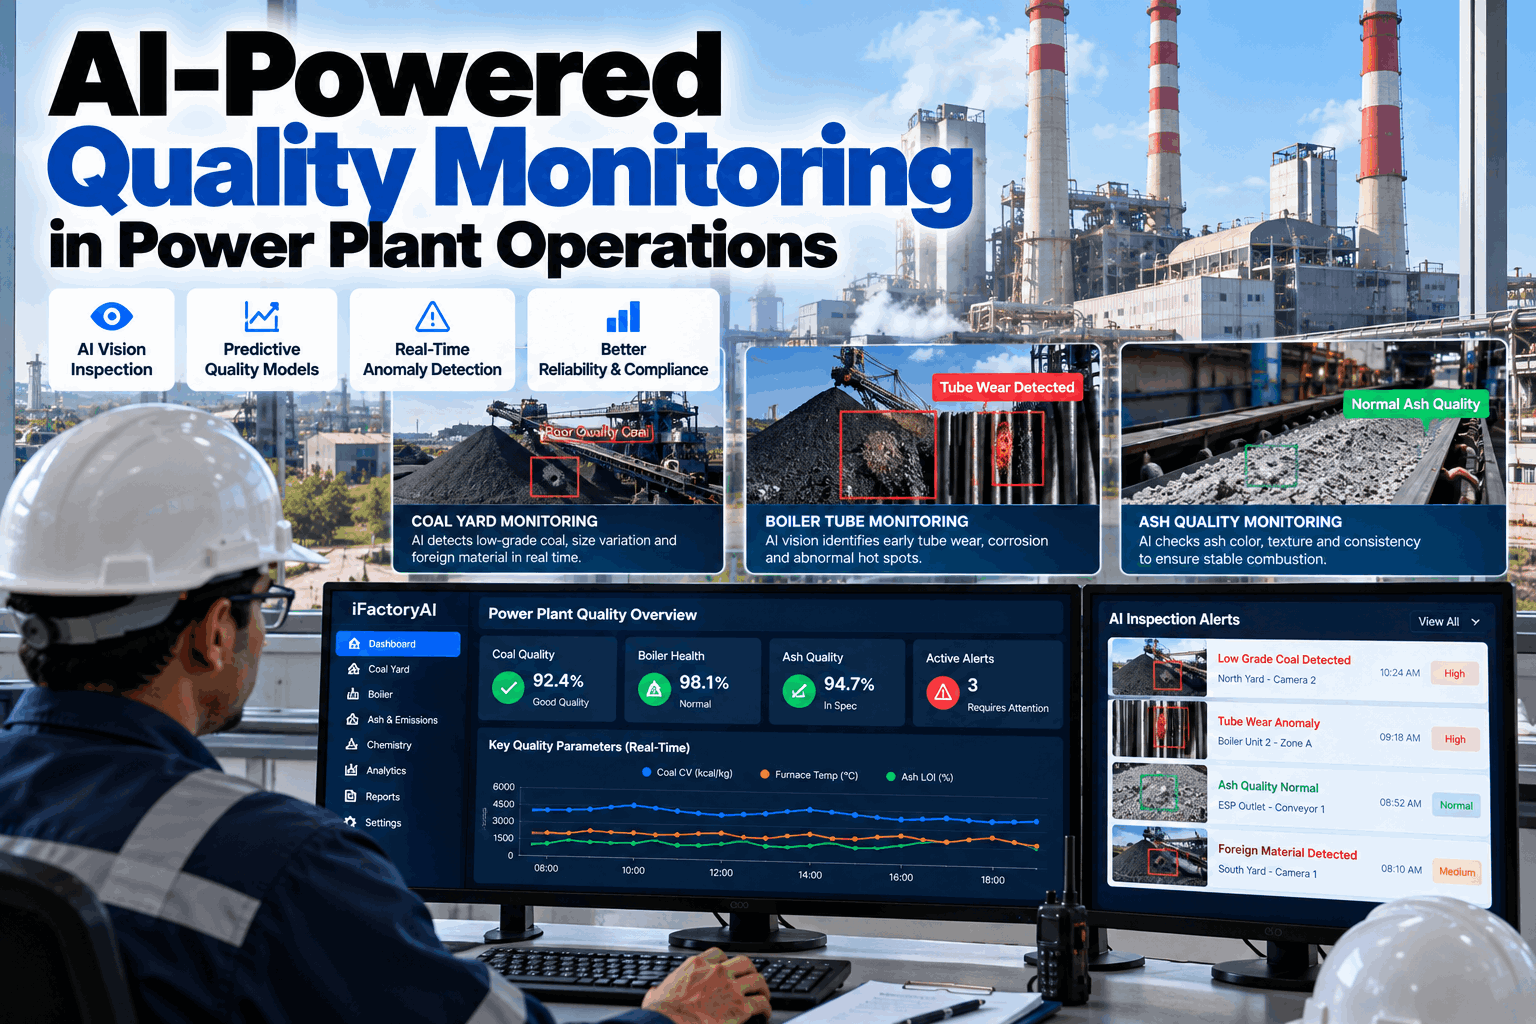
AI-Powered Quality Monitoring in Power Plant Operations
Watch coal, combustion, boiler tubes, cycle chemistry and ash as one connected chain. AI vision and predictive models flag drift between lab samples, so the chemistry and quality team acts before an outage or a rejected ash load.
- Where AI quality monitoring is proven in power plants
- Coal yard, boiler tube, chemistry and ash use cases
- What data each use case really needs
Where AI Quality Monitoring Really Works
Some use cases are proven. Others still need careful testing.
AI is not equally useful at every step. It works best where there is plenty of data, a clear signal and a decision that can change the outcome. It is weaker where data is sparse, failure is rare or the physics are already well modelled. Use the scorecard below to set realistic expectations before choosing where to start, and revisit it as your data grows. Our power plant team can score your own use cases the same way.
Where failures are rare, AI is better at ranking risk than predicting a date. A ranked list of tube zones to inspect at the next outage is useful and honest. A failure date with no history behind it is neither.
Coal Yard: Catch Problems Before They Reach the Boiler
Bad fuel causes problems that show up hours later in the furnace.
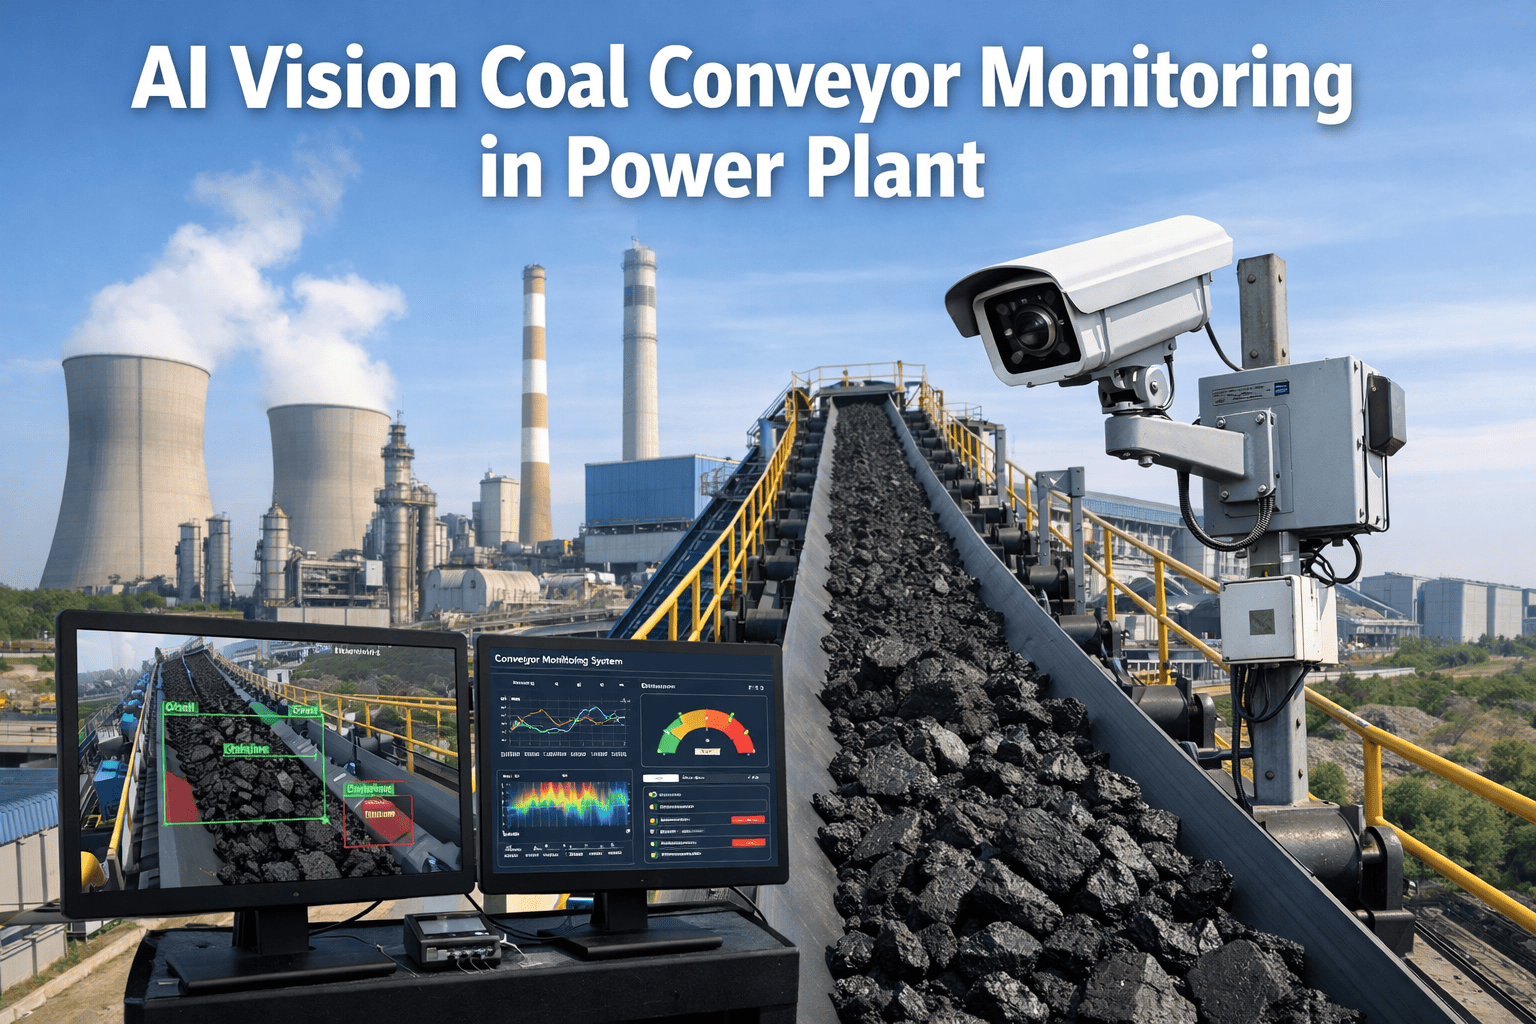
Stones, tramp metal and wood in coal damage crushers and mills and upset combustion. Wet coal reduces mill output and flame stability. Hot spots in stockpiles can lead to spontaneous heating. AI vision watches belts and piles continuously, which periodic walk-downs cannot do. Plan camera coverage in a coal yard review.
Foreign objects on belts
Vision spots stones, metal and wood and triggers removal before the crusher.
Stockpile hot spots
Thermal cameras track surface temperature and flag areas that keep rising.
Wet or sticky coal
Belt images and mill data together point to high-moisture coal before mill output falls.
Stockpile volume
Drone or fixed-camera surveys estimate pile volume for stock and blending plans.
Coal quality problems often show up later as mill trips, flame instability or high LOI. Tagging each belt event with time and source lets the AI connect a furnace problem back to the coal that caused it. Over months, that link also shows which suppliers or mine seams cause the most trouble, which helps fuel buyers and blending plans.
Boiler Tubes: Find the Wear Before the Leak
Tube leaks remain the top cause of lost availability in coal-fired units.
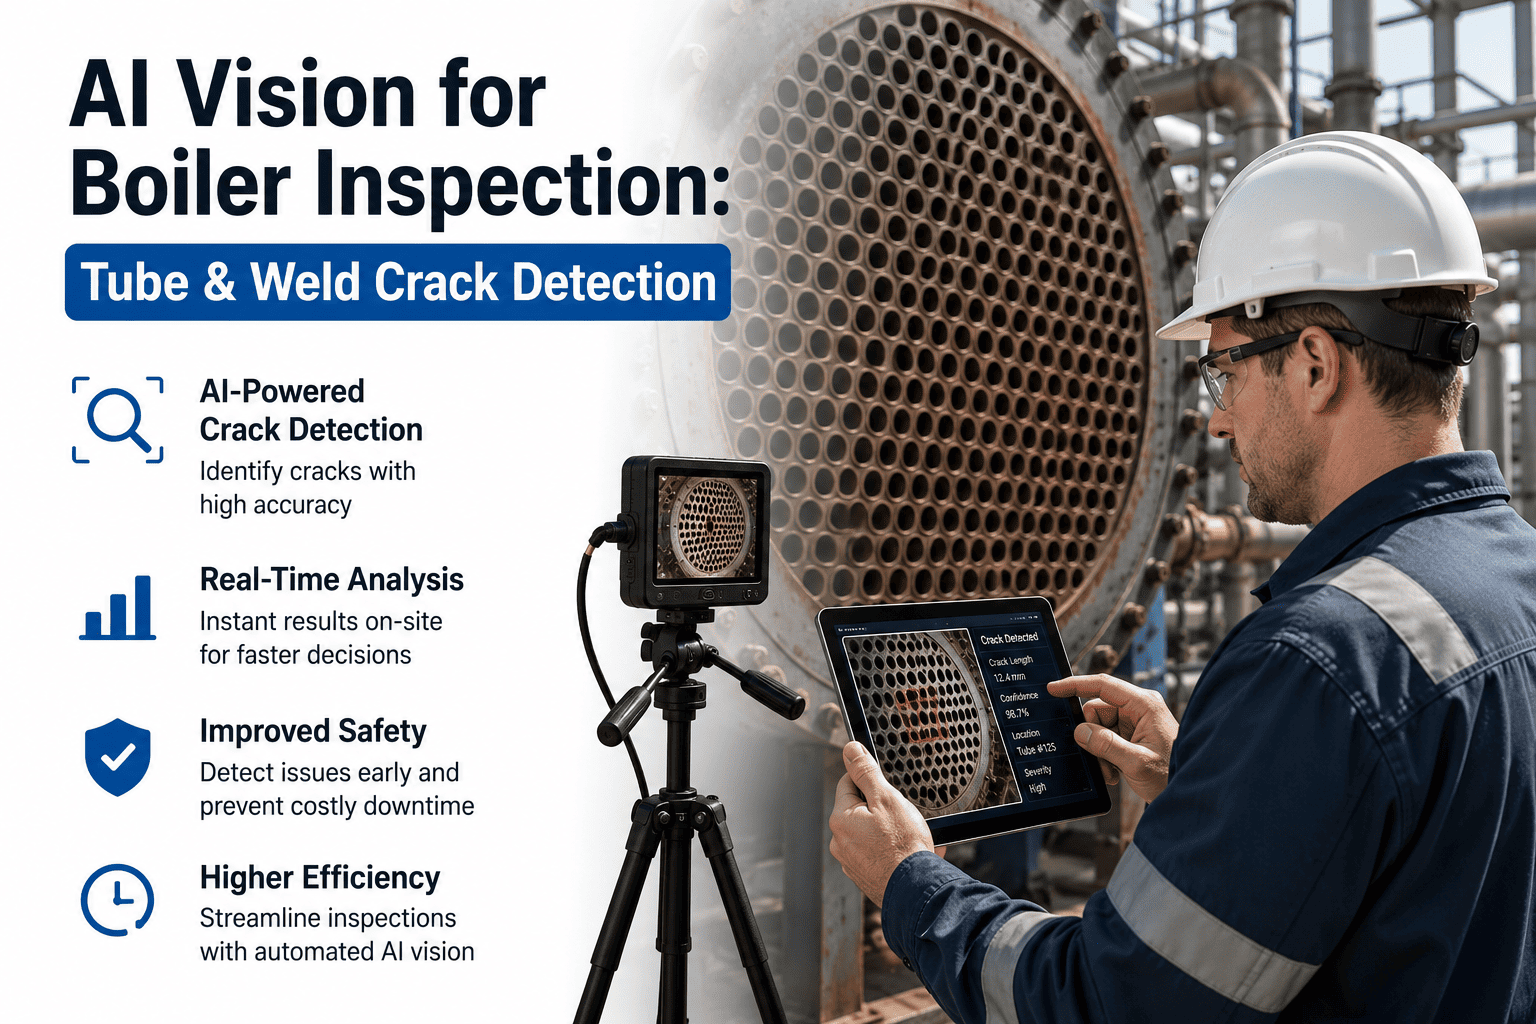
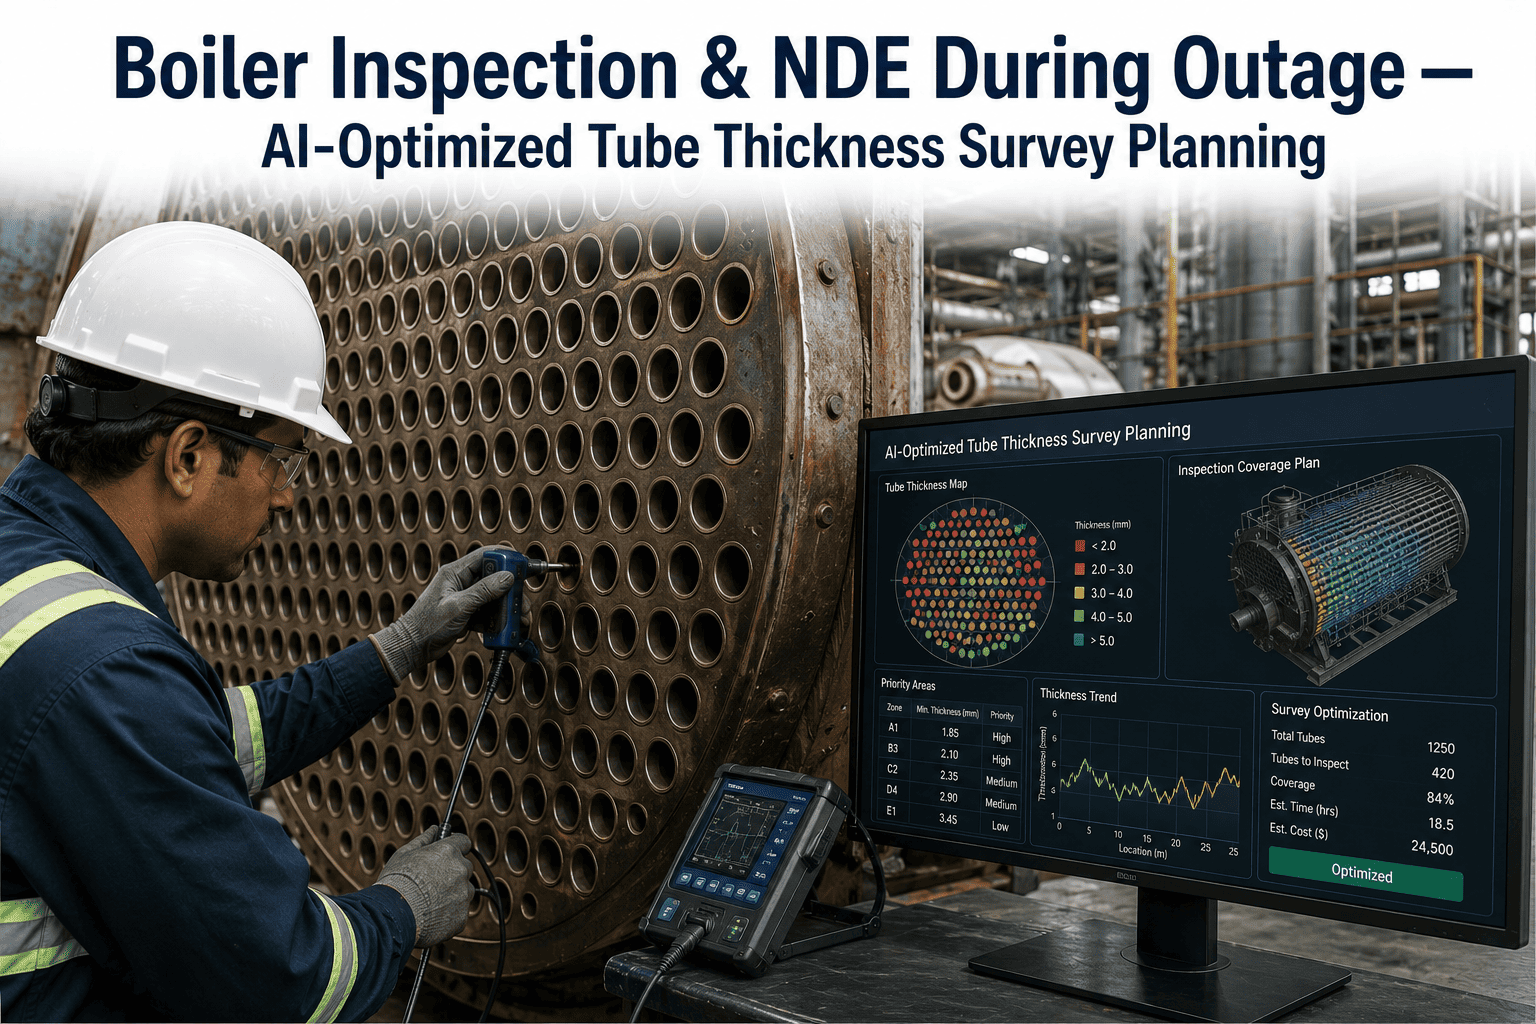
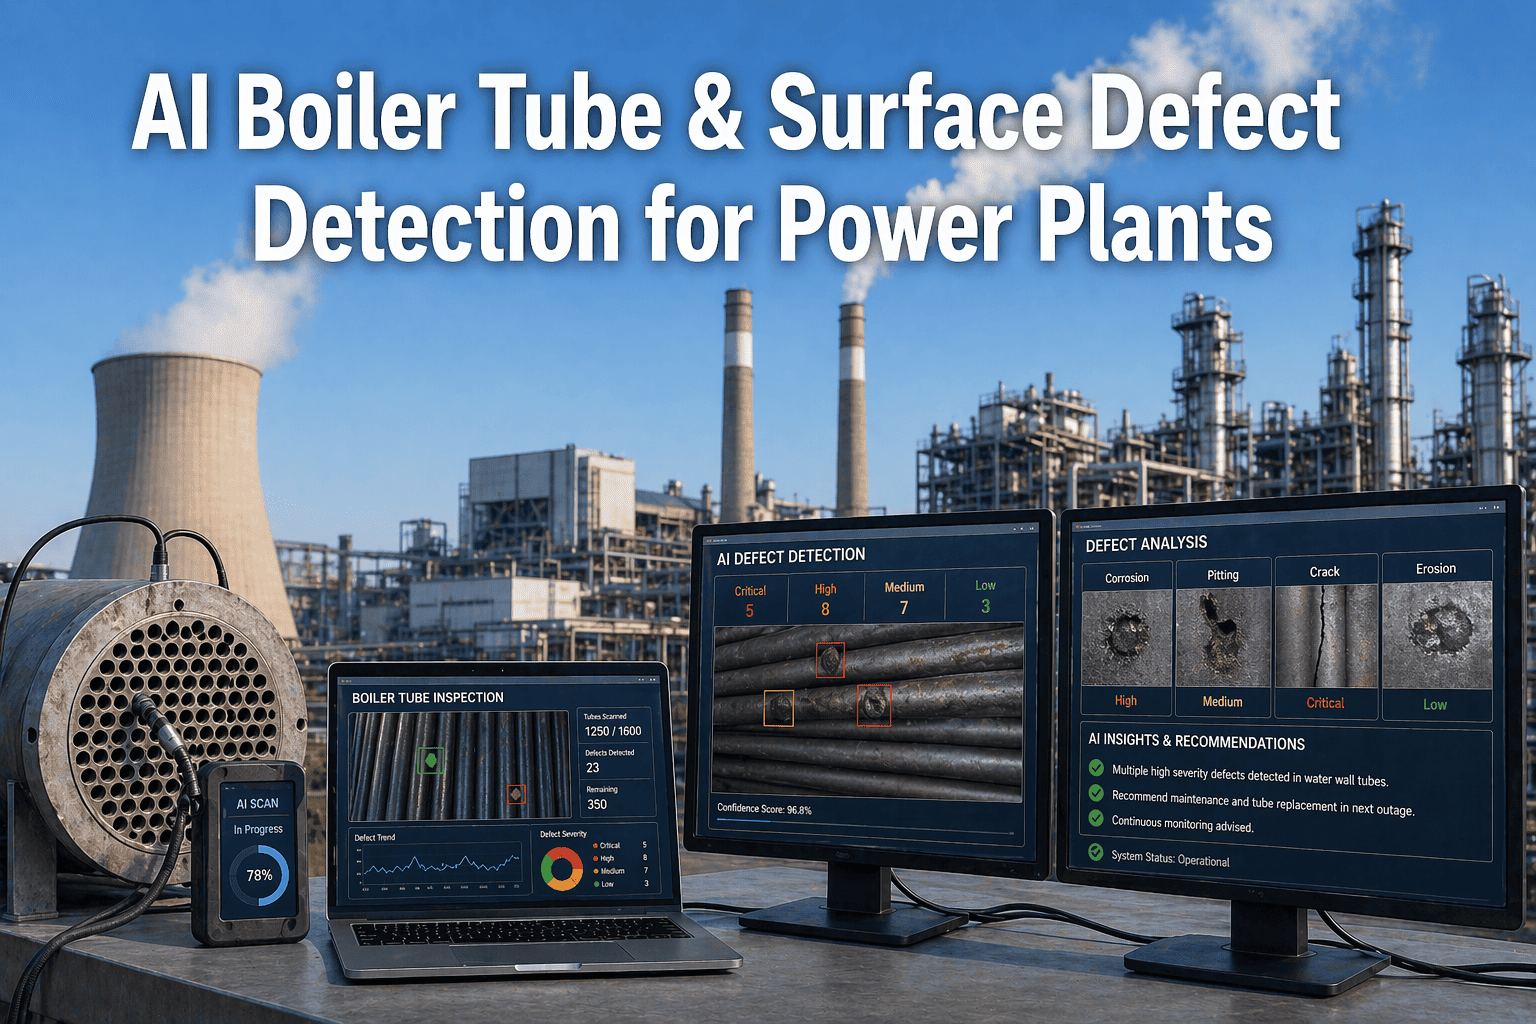
Industry surveys reported by POWER name fly ash erosion and sootblower erosion as the most likely causes of tube failures, with fatigue and weld flaws also significant. Waterwalls leak most often, followed by convection and pendant superheat sections. AI helps by joining the scattered data that hints at wear: thickness surveys, sootblower history, flue gas conditions, inspection images and leak detection. Questions on tube data go to our boiler team.
Data joined for each tube zone
- Ultrasonic thickness surveys from past outages
- Sootblower operation counts and steam pressure
- Flue gas velocity and ash loading by load range
- Drone or crawler inspection images
- Acoustic leak detection signals
- Past leak locations and root causes
Because fly ash and sootblower erosion lead the failure list, zones near sootblowers and in high-velocity gas paths deserve the closest watch. Linking sootblower logs to thickness loss is often the quickest way to find where wear is speeding up. It can also show where sootblowing is more frequent than the deposits really need, which saves steam as well as tubes.
What One Avoided Tube Leak Is Worth
A single forced outage from a tube leak can cost more than a year of monitoring. Finding the weak zone at a planned outage turns an emergency into routine work.
Fly Ash Quality: Keep Every Load Sellable
LOI drift turns a saleable product into a disposal cost.
Fly ash sold for concrete must meet buyer limits on loss on ignition, which reflects unburned carbon. ASTM C618 sets a maximum of 6%, but many state agencies cap it at 3 to 4% and ready-mix producers generally want it below about 3%, because carbon interferes with air entrainment. Low-NOx burners and coarse coal grinding can push LOI up. Review your ash quality data in an ash quality review.
Predict between samples
AI estimates LOI from coal, mill, burner and oxygen data while the lab result is pending.
Find the cause
Rising LOI is linked to coal fineness, burner tilt, air settings or a change in coal source.
Route the ash
Loads likely above the buyer limit are flagged before they reach the sales silo.
Concrete producers value steady LOI almost as much as low LOI, because swings change the dose of air-entraining agent they need. Reducing variation can keep a buyer even when average LOI barely moves. Sharing a daily LOI trend with the ash marketer also helps plan which loads go to which customer.
Cycle Chemistry: Spot Excursions Early
Water chemistry decides how fast tubes and turbines corrode.
Online analyzers measure pH, cation conductivity, dissolved oxygen, sodium and silica around the steam cycle. The chemistry team reviews trends, but small shifts across several analyzers are easy to miss, and a failing analyzer can look like a real excursion. AI watches all channels together, separates analyzer faults from real events and points to the likely source. Questions about chemistry monitoring go to our support desk.
A drifting probe, a blocked sample line or a failed reagent pump can look exactly like a chemistry excursion. Tracking analyzer health, sample flow and calibration dates beside the readings stops the team from chasing false alarms and missing real ones.
AI Quality Monitoring Mistakes to Avoid
AI fails when it is asked to replace the lab instead of support it.
The best results come when AI fills the gaps between lab samples and inspections, not when it tries to replace them. Plants that keep the lab and the models talking to each other see the models improve over time. A short rollout plan session helps pick a first use case.
What works
- Start where data is plentiful, such as belts and analyzers
- Calibrate predictions against regular lab results
- Rank risk where failure history is thin
- Give each alert an owner and a clear action
What fails
- Cutting lab sampling because a model exists
- Promising exact failure dates with no history
- Ignoring analyzer health and camera cleaning
- Alerts sent to a dashboard nobody watches
Every lab result is a free check on the model. Feeding lab values back keeps predictions honest, and a growing gap between prediction and lab is itself an early sign that something in the process has changed.
How iFactory Supports Power Plant Quality Teams
Vision, predictive models and chemistry data on one on-prem platform.
iFactory connects cameras, online analyzers, the DCS, historians and lab systems to an on-prem AI server inside your network. Vision models watch coal belts and stockpiles, predictive models estimate ash LOI and rank tube wear, and anomaly detection watches cycle chemistry. Fit questions go to our solutions team.
Coal yard vision
Foreign objects, stockpile heating and volume watched by fixed and thermal cameras.
Tube wear ranking
Thickness, sootblower and gas data joined to rank zones for the next inspection.
Ash LOI prediction
LOI estimated between lab samples, with likely causes and load routing.
Chemistry anomalies
All analyzers watched together, with analyzer faults told apart from real events.
Lab integration
Lab results flow back to the models to keep predictions calibrated.
Cause tracing
Furnace, ash and chemistry events traced back through combustion to the coal.
Results depend on your sensors, lab data and how alerts are acted on. We measure detection rates, prediction accuracy against lab values and alert response on your own data during the pilot, rather than promising a general figure.
Turnkey AI: Delivered, Connected and Live in 6–12 Weeks
You do not build this. It arrives ready.
iFactory ships as a pre-configured NVIDIA AI server with the software pre-loaded, racked and ready. Rack it, plug in power and Ethernet, and the AI is live on your network. Our team handles cabling, network setup, camera, DCS, SCADA, PLC and lab system integration, operator training and 24×7 remote monitoring. Plant data stays on your network. For a scope matched to your units, request a turnkey quote.
Ship, network and data
Server installed. Cameras, analyzers, DCS, historian and lab data connected.
Model training and pilot
Vision and predictive models trained on your plant data. Pilot live on one use case.
Go-live and training
Quality board live. Chemistry and operations teams trained. 24×7 monitoring begins.
Frequently Asked Questions
What does AI quality monitoring cover in a power plant?
It covers the chain from fuel to by-products: coal on belts and in stockpiles, combustion, boiler tube wear, cycle chemistry and fly ash quality. AI vision and predictive models fill the gaps between periodic samples and inspections.
Can AI predict exactly when a boiler tube will fail?
Usually not with confidence, because tube failures are rare and have many causes. AI is better at ranking tube zones by risk, so inspections at the next outage go to the places most likely to leak.
Why does fly ash LOI matter?
LOI reflects unburned carbon. ASTM C618 allows up to 6%, but many buyers and agencies want 3 to 4% or less, because carbon interferes with air entrainment in concrete. Ash above buyer limits often has to be disposed of instead of sold.
Does AI replace lab analysis?
No. It estimates quality between lab samples and flags drift sooner. Lab results remain the reference and are fed back to keep the models accurate.
What cameras does coal yard vision need?
Usually fixed cameras over the main belts, thermal cameras covering stockpiles and good lighting. Dust covers and a cleaning routine matter as much as the camera itself.
How does AI help with cycle chemistry?
It watches all online analyzers together, tells analyzer faults apart from real excursions and points to the likely source, such as a condenser leak or air in-leakage, so the chemistry team can confirm with targeted grab samples.
Does this apply to gas-fired or biomass plants?
Partly. Cycle chemistry monitoring applies to any steam cycle, including combined-cycle heat recovery steam generators. Biomass plants share fuel yard and ash concerns, while coal yard vision and fly ash LOI are mainly relevant where coal or co-firing is used.
How do we start?
Start with one use case that has plenty of data, such as coal belt vision or chemistry anomalies. A 6-week pilot connects the data, trains the model and shows results on your own unit. To plan it, contact our team.
Put AI Where It Pays Back First
In thirty minutes we look at your units, your data and your biggest quality losses, and rank where AI is likely to help. You keep the notes whether or not you go further with iFactory.
- 1Two years of tube leak history and causes
- 2Recent fly ash LOI results and buyer limits
- 3Your list of online chemistry analyzers
- 4Coal yard layout and camera coverage
- 5The last quality issue that cost you an outage