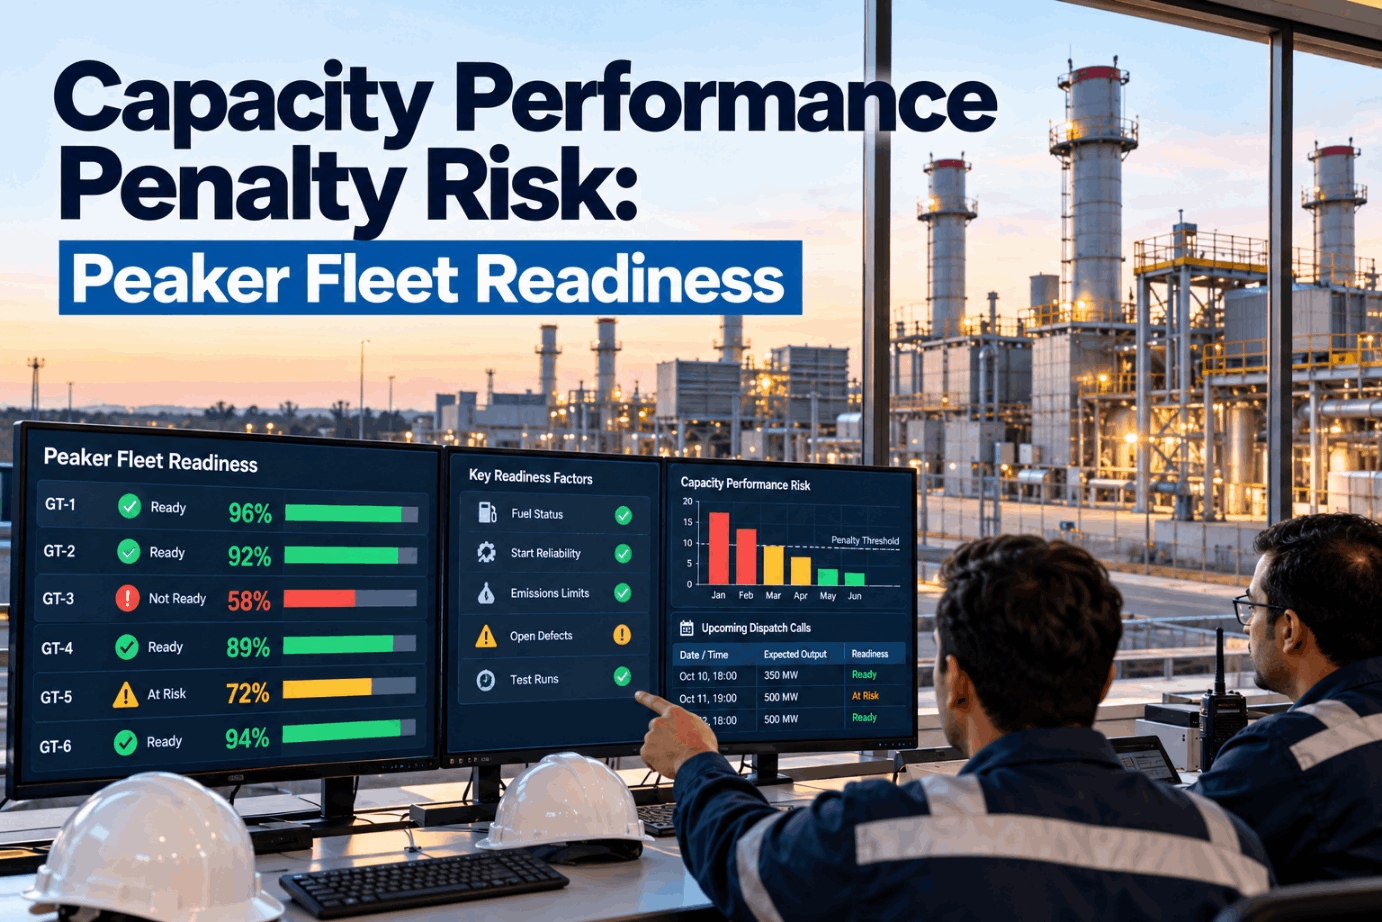
A peaking plant can sit idle for weeks and still carry a large capacity obligation. In PJM, that obligation is tested when the grid is short, often in the worst weather of the year. If a unit fails to start or cannot reach its committed output, it can face non-performance charges for every interval of the shortfall. Capacity performance penalty risk is easier to manage when the fleet knows each evening which units are truly ready: fuel, starts, emissions limits and open defects. Review your fleet with our readiness team.
Capacity Performance Penalty Risk: Peaker Fleet Readiness
A daily readiness score for every peaking unit, built from open defects, test results, fuel status and permit limits, so the team knows which units may fail an emergency call before the call comes.
- One score per unit, refreshed daily
- Reasons shown, not just a number
- Voice answers for the evening call
Why Peaker Readiness Is a Market Risk
Capacity revenue is paid for being there when called.
A peaking unit earns capacity revenue for being available during the hours that matter most. In PJM's Capacity Performance design, those hours are emergency events, and they tend to arrive in extreme heat or cold. That is when equipment is most stressed, fuel is hardest to get and staff are stretched. A peaker may run only a few hundred hours a year, so a fault can sit unnoticed for weeks. The plant believes the unit is available. The first real test is the emergency itself. This turns maintenance status into a commercial question. An open defect, a low oil tank or a unit close to its permit hours is not only an operations issue. It is a possible penalty if an emergency is declared. Our power specialists can review how readiness is tracked across your fleet today.
Available on paper
- Unit shows as available in the outage system
- Defects sit in a work order backlog
- Fuel and permit hours checked by other teams
- First real test is the emergency call
Ready in practice
- One readiness score per unit, every day
- Defects that could stop a start flagged first
- Fuel and permit status in the same view
- Gaps fixed before alerts, not after
How PJM Capacity Performance Assesses Units
Performance is measured interval by interval during emergencies.
PJM measures capacity resources during Performance Assessment Intervals, or PAIs. A PAI is a real-time settlement interval in which PJM has declared certain emergency actions for a zone or area. Hot and cold weather alerts on their own are not triggers. In each PAI, a resource's expected performance is its committed capacity multiplied by a balancing ratio, which reflects how much of the area's committed capacity was needed. If actual output falls short, the shortfall is charged. Resources that deliver more than expected can earn bonus payments funded by those charges. Netting across a portfolio is generally not allowed. Walk through your own units in a working session.
Emergency action
Declared by PJM for a zone or area.
Committed MW × ratio
Balancing ratio set for each interval.
Expected minus actual
Reduced by any excused MW.
Shortfall × rate
Rate and annual cap set in the tariff.
Simplified summary based on PJM training material and fact sheets. Rules, rates and caps have been revised since 2022. Read the current PJM tariff and manuals and take your own advice before acting.
What Winter Storm Elliott Showed
The units that failed were often thought to be available.
During Winter Storm Elliott in December 2022, PJM met demand, but a large share of its generation was on forced outage. PJM reported that at one point on 24 December almost a quarter of capacity, about 47,000 MW, was unavailable. Gas-fired units made up about 70 percent of those outages. PJM linked most of them to equipment failures likely caused by the cold, with limited gas supply also playing a part. Non-performance charges were first estimated at about $1.8 billion. After a settlement that FERC approved in December 2023, the estimated total fell to about $1.25 billion. The lesson for fleet teams is simple. Readiness has to be checked against the conditions of the event, not the conditions of a mild day. Ask our team how other fleets prepare for winter peaks.
Many Elliott outages came from cold-related equipment problems and fuel limits. These are the kinds of issues a daily readiness check can bring to light earlier, though no check can remove the risk.
Five Readiness Factors for Each Unit
A unit is ready only when all five line up.
Unit readiness tracking works best when it pulls the factors that decide whether a peaker can answer an emergency dispatch call into one score. Each factor already has a data source somewhere in the plant. The work is bringing them together, weighting them sensibly and showing the reason behind every low score. The weights should be agreed with operations, not set by software alone. Set up your factors with our implementation team.
Know Which Units Are Ready Before the Call
A readiness score for every peaker, with the reasons behind it, drawn from defects, tests, fuel and permit data and answered by voice for the evening call.
An Illustrative Exposure Calculation
A single missed start can add up fast, interval by interval.
The worked example below uses the formula and example rate shown in a 2022 PJM training slide: a Net CONE of $300 per MW-day, a 30-hour divisor and twelve five-minute intervals per hour, which gives about $304.17 per MW-interval. Rates and caps have changed since then, so treat the result as a way to see the shape of the risk, not as a forecast. Real charges depend on the tariff in force, the balancing ratio in each interval, excusals and any annual cap. Check the numbers for your own units with our market team.
Illustrative only. Not legal, financial or market advice.
Asking Which Units Are Not Ready Tonight
The evening call should start with a straight answer.
Before a hot afternoon or a cold night, the shift lead, the plant manager and the trading desk all ask the same thing: which units can we count on? With the readiness score in place, that question can be answered by voice in a few seconds, with reasons and the work that would change the answer. The AI reports and suggests. The plant team decides what to fix, what to declare and what to tell the market desk. See the voice workflow in a short demo.
Winter Readiness and Cold Weather Rules
Cold weather plans only help if the checks behind them are done.
Since Elliott and the Texas freeze of 2021, cold weather preparation has received more attention. NERC's cold weather standard, EOP-012, requires generator owners to have cold weather preparedness plans and freeze protection for components likely to freeze, with corrective action plans where gaps are found. For peakers, winter readiness also means fuel: oil stock on site, gas supply terms and the ability to switch fuels where a unit is dual-fuel. Linking these checks to the readiness score keeps them visible every day of the season. Ask our team how winter checks feed the score.
Plan
Cold weather plan for each unit.
Inspect
Heat tracing, enclosures, sensors.
Fuel
Oil stock and gas terms checked.
Test
Start tests in cold conditions.
Score
Results feed the daily score.
Peaker Fleet Readiness Checklist
Eight checks for meeting capacity market obligations.
Use this checklist to review one fleet or one plant first. Tick items already in place. Get help with any gaps from our setup team.
Readiness Mistakes That Raise Penalty Risk
Most missed calls trace back to something already known.
These are the patterns that most often leave a peaker fleet exposed when an emergency is declared. A short readiness review can find them.
What works
- Start-critical defects ranked above routine work
- Fuel and permit hours checked every day
- Outages approved before work starts
- Test starts before forecast extreme weather
What fails
- Treating "available" as the same as "ready"
- Defects waiting in a general backlog
- Permit hours found short during the event
- Winter checks done once and not repeated
How iFactory Runs Peaker Fleet Readiness
Readiness Dashboard, on your own network.
iFactory's Readiness Dashboard builds a unit readiness score from open defects, test results and fuel status, with voice answers to "which units are not ready for tonight's peak?" It runs on an on-prem AI server inside your plant.
Readiness score
One score per unit, every day.
Open defects
Start-critical work flagged first.
Test results
Start success and time to load.
Fuel status
Stock and supply in the same view.
Voice answers
Who is not ready, and why.
Reasons shown
Every low score explained.
Unit declarations, outage requests and market decisions remain with your team. Figures on this page are worked examples.
Turnkey AI: Delivered, Connected and Live in 6–12 Weeks
You do not build this. It arrives ready.
iFactory ships as a pre-configured NVIDIA AI server with the software pre-loaded, racked and ready. Rack it, plug in power and Ethernet, and the AI is live on your network. Our team handles cabling, network setup, PLC, SCADA, DCS and CMMS integration, outage, fuel and emissions record links, operator training and 24×7 remote monitoring. Data stays on your network. For a scope matched to your plant, request a turnkey quote.
Ship, network and data
Server installed. CMMS, control system, fuel and emissions records connected. Units and capacity commitments loaded.
Model training and pilot
Readiness factors and weights agreed with operations. Scores tested against recent starts for one plant.
Go-live and training
Readiness Dashboard live. Shift leads trained on voice queries. 24×7 monitoring begins.
Frequently Asked Questions
What is capacity performance penalty risk?
The chance that a capacity resource will owe non-performance charges because it delivers less than expected during an emergency interval.
What is a Performance Assessment Interval?
A real-time settlement interval in which PJM has declared certain emergency actions for a zone or area. Weather alerts alone are not triggers.
How are non-performance charges worked out?
The shortfall against expected performance in each interval is multiplied by a charge rate set in the tariff, subject to excusals and an annual cap.
What happened in Winter Storm Elliott?
Large forced outages in December 2022 led to about $1.8 billion in estimated charges, cut to about $1.25 billion after a FERC-approved settlement.
What goes into a readiness score?
Open defects, recent start results, fuel status, permit hours and weather readiness, weighted as agreed with your operations team.
Does the AI declare units unavailable?
No. It flags units that may not be ready and shows why. Your team decides what to declare and what to fix.
Does this apply outside PJM?
Other markets have their own capacity rules. The readiness factors are the same, but penalty terms must be read for each market.
Does this replace our CMMS?
No. Work orders stay in your system of record. The dashboard reads them alongside fuel, test and emissions data.
How do we start?
Start with one plant and its peaking units. A 6-week pilot connects defects, starts and fuel data and sets up the score. To plan it, contact our team.
Go Into the Next Peak Knowing Your Fleet
In thirty minutes we map your peaking units against defects, fuel, starts and permit hours and show where readiness gaps sit. You keep the map either way.
- 1A list of units and capacity commitments
- 2Open work orders on peaking units
- 3Start logs from the last season
- 4Fuel stock and permit hour records
- 5One start that failed when it mattered