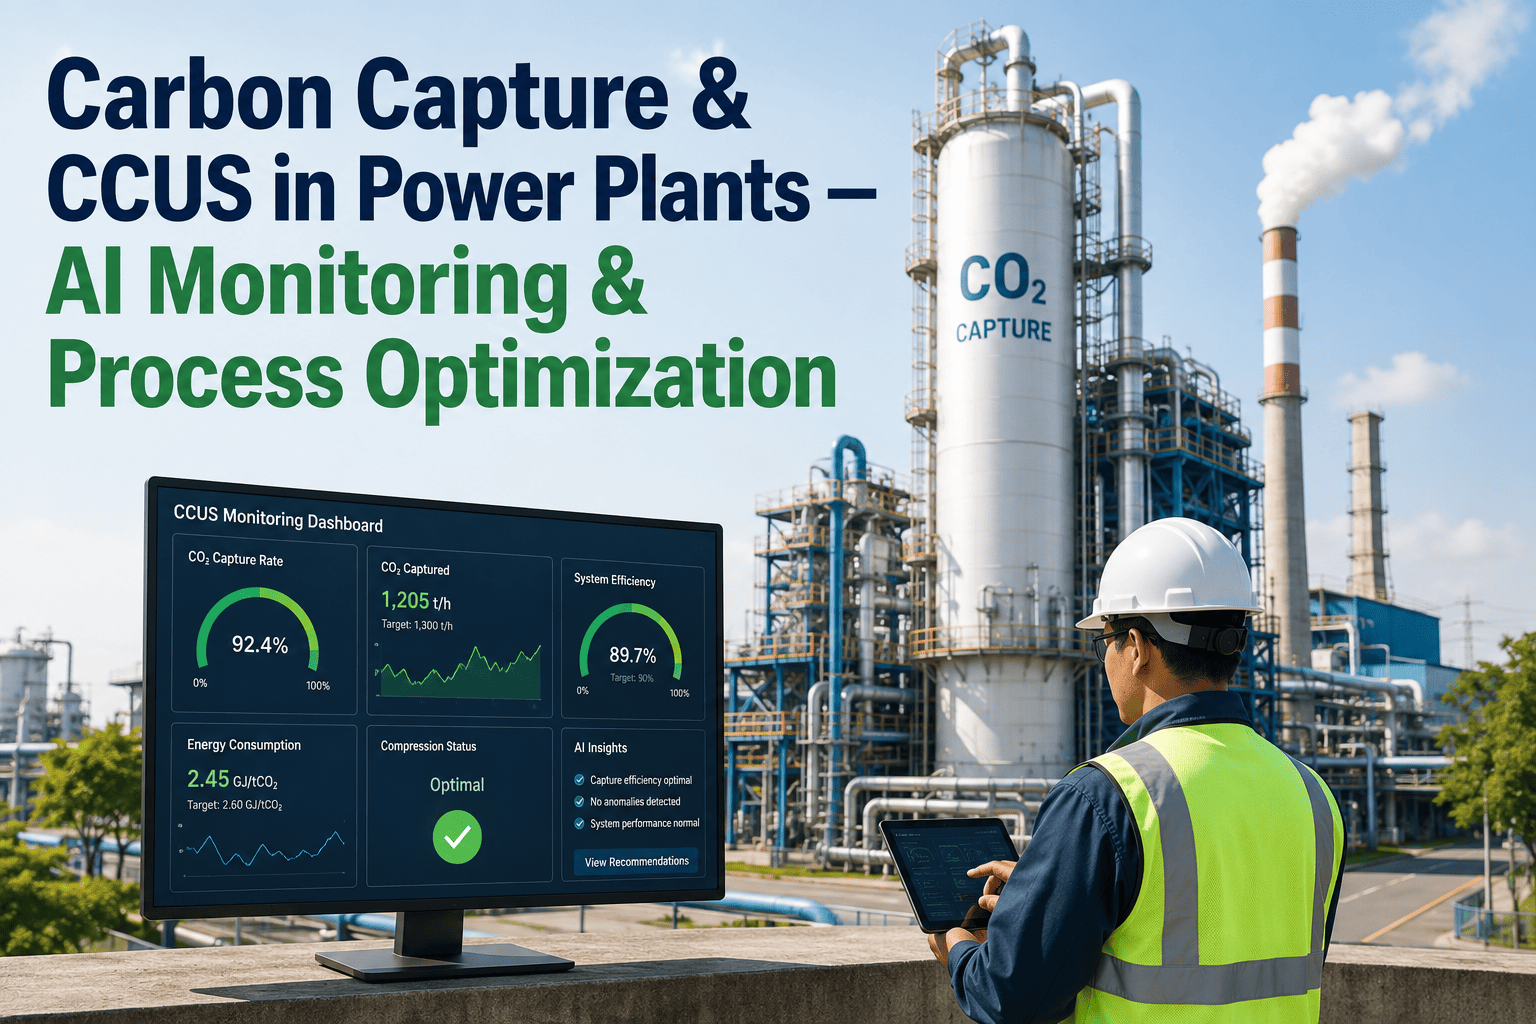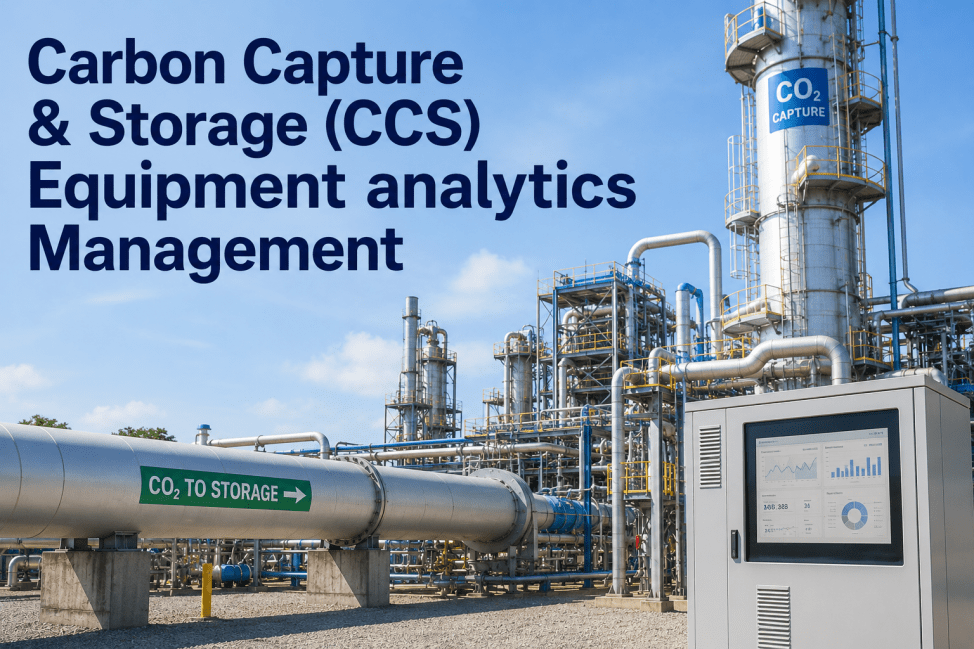
A power plant evaluating carbon capture rarely struggles with the concept, the struggle starts once the technology is running and the plant has to prove, continuously, that the capture rate it promised on paper is the capture rate actually happening in the stack. Solvent degrades faster than expected, the energy penalty creeps upward as heat exchangers foul, and the gap between rated performance and actual performance becomes visible only when a compliance report is due rather than while there's still time to correct it. iFactory tracks capture unit performance, solvent condition, and energy consumption against the original design case continuously, so a drifting capture rate shows up as an operating trend rather than a surprise on a regulatory filing. You can book a demo to see it running against your own capture process data.
Track Capture Performance the Way You Already Track the Rest of the Plant
iFactory ties capture rate, solvent condition, and energy penalty to one continuous record per unit, so the gap between the design case and actual field performance gets caught early instead of at the next compliance deadline.
The Design Case Is a Starting Point, Not a Guarantee
Every capture project begins with an engineering case built around a rated capture percentage, a projected energy penalty, and an expected solvent or sorbent life. Those numbers hold up under lab and pilot conditions, but full-scale operation introduces variables the design case can't fully anticipate: flue gas composition shifting with fuel quality, solvent losing absorption capacity faster than modeled, and heat integration underperforming as exchangers foul over months of continuous service.
Fuel switching is a particularly common source of drift that design cases underestimate. A plant blending in a different coal source, or a gas plant adjusting supply mix, changes flue gas volume and contaminant load in ways that stress the capture solvent differently than the original test burn did. None of that shows up as an obvious operational problem in the near term, but it accumulates as accelerated solvent degradation that a design case built around a single reference fuel never modeled.
The gap tends to widen slowly enough that it doesn't trigger an obvious alarm. A capture rate slipping from a rated ninety percent to the mid-eighties over a year of operation still looks like a functioning plant on a daily dashboard, but it represents a meaningful shortfall against whatever regulatory or contractual capture target the project was built to meet, and it compounds every day it goes uncorrected.
Four Capture Technologies, Four Very Different Operating Profiles
The right capture technology depends heavily on whether a plant is retrofitting existing combustion equipment or designing new capacity around capture from the start, and each pathway carries a distinct cost, energy penalty, and maturity profile worth understanding before committing capital.
Retrofit projects in particular face a narrower set of practical choices than a greenfield design would, since available space, existing steam availability for solvent regeneration, and flue gas routing all constrain which technology fits without a disproportionate rebuild. That's part of why post-combustion amine capture remains the default choice for most retrofits despite its energy penalty, it integrates onto an existing plant footprint in a way oxyfuel or pre-combustion approaches generally cannot.
| Technology | Typical Capture Rate | Energy Penalty | Maturity |
|---|---|---|---|
| Post-Combustion Amine | 85-95% | High, driven by solvent regeneration heat demand | Commercially proven, most widely deployed retrofit option |
| Oxyfuel Combustion | Up to 95%+ | High, driven by air separation unit power demand | Demonstrated at scale, fewer commercial installations |
| Pre-Combustion Capture | 85-90% | Moderate, applied before combustion in gasification cycles | Proven in IGCC applications, limited to specific plant designs |
| Direct Air Capture | Not flue-gas dependent | Very high per ton captured due to dilute CO2 concentration | Early commercial stage, growing rapidly on policy support |
See Where Your Capture Unit Actually Stands Against Design
iFactory compares live capture rate, solvent condition, and energy penalty against the original design case, so a drifting unit gets flagged before a compliance report does. Book a demo and see it against your own process data.
Three Factors That Explain Most of the Cost Variation
Published cost-per-ton figures for carbon capture vary widely across projects, and most of that variation traces back to three operating factors that either compound a project's economics or work in its favor depending on how closely they're managed.
What makes these three factors worth tracking together rather than separately is that they interact. A solvent degrading faster than expected increases the energy penalty at the same time, since more regeneration heat is needed to achieve the same capture rate from a weaker solvent. Treating energy penalty and solvent condition as one linked trend, rather than two separate reports reviewed on different schedules, catches that interaction much earlier than either measurement would on its own.
Capture Projects Operate Inside a Specific Compliance Framework
Capture economics and reporting obligations are shaped directly by the policy framework a project sits under, and staying inside that framework requires documentation that holds up to review, not just a capture rate that looked good at commissioning.
Reporting requirements also tend to compound rather than replace one another, a facility claiming a 45Q credit is typically also subject to standard greenhouse gas reporting, and if the CO2 is used for enhanced oil recovery, ISO 27916 accounting layers on top of both. A performance record structured to satisfy the strictest of these requirements generally satisfies the others as a byproduct, which is usually more efficient than building separate reporting processes for each framework independently.
Capture Is Only Half the Story, Utilization Determines the Rest
Once CO2 is captured, what happens to it next shapes both the economics and the regulatory pathway of the entire project, and most large capture projects end up combining more than one utilization or storage route rather than relying on a single outlet.
Which pathway makes sense depends heavily on geography and existing infrastructure as much as it does on the chemistry involved. A plant near mature oil fields has a straightforward enhanced oil recovery market available, while a plant without nearby injection infrastructure may find dedicated geologic storage or an emerging synthetic fuels offtake a more practical route, even if the underlying economics per ton look less favorable on paper.
What Changes When Capture Performance Lives in One Record
A quarterly compliance report and a continuous performance record can technically be built from the same underlying measurements, but only one of them shows a drifting capture rate early enough to correct it before it affects a filing.
The gap matters most when a shortfall coincides with a reporting deadline that offers no flexibility on timing. A capture rate that has been quietly declining for months and only gets flagged during the quarterly review leaves an operations team with no runway to correct it before the filing goes out, turning what could have been a routine solvent adjustment into a documented compliance shortfall that has to be explained after the fact.
Teams Whose Numbers Have to Hold Up to Outside Review
Carbon capture performance touches operations, finance, and compliance simultaneously, which is why a defensible performance record tends to matter to more roles than the process engineers running the unit day to day.
Each of these groups tends to ask a different question of the same underlying data, an operator wants to know if today's readings are within normal range, a finance team wants to know if the unit still qualifies for its expected credit value, and a compliance officer wants a defensible answer if a regulator asks about a specific reporting period months later. One continuous record that all three can query independently removes the delay of routing the same question through several different people and systems.
Questions Operations and Compliance Teams Ask First
Give Every Capture Unit a Performance Record That Holds Up
iFactory ties capture rate, solvent condition, and energy penalty together for every unit in your fleet, so drift gets caught while it's still correctable. Book a demo and see it running on your own process data.