Carbon Emissions Tracking & ESG Reporting for Power Generation"

By Talon on June 10, 2026

carbon-emissions-tracking-esg-reporting-power-generation

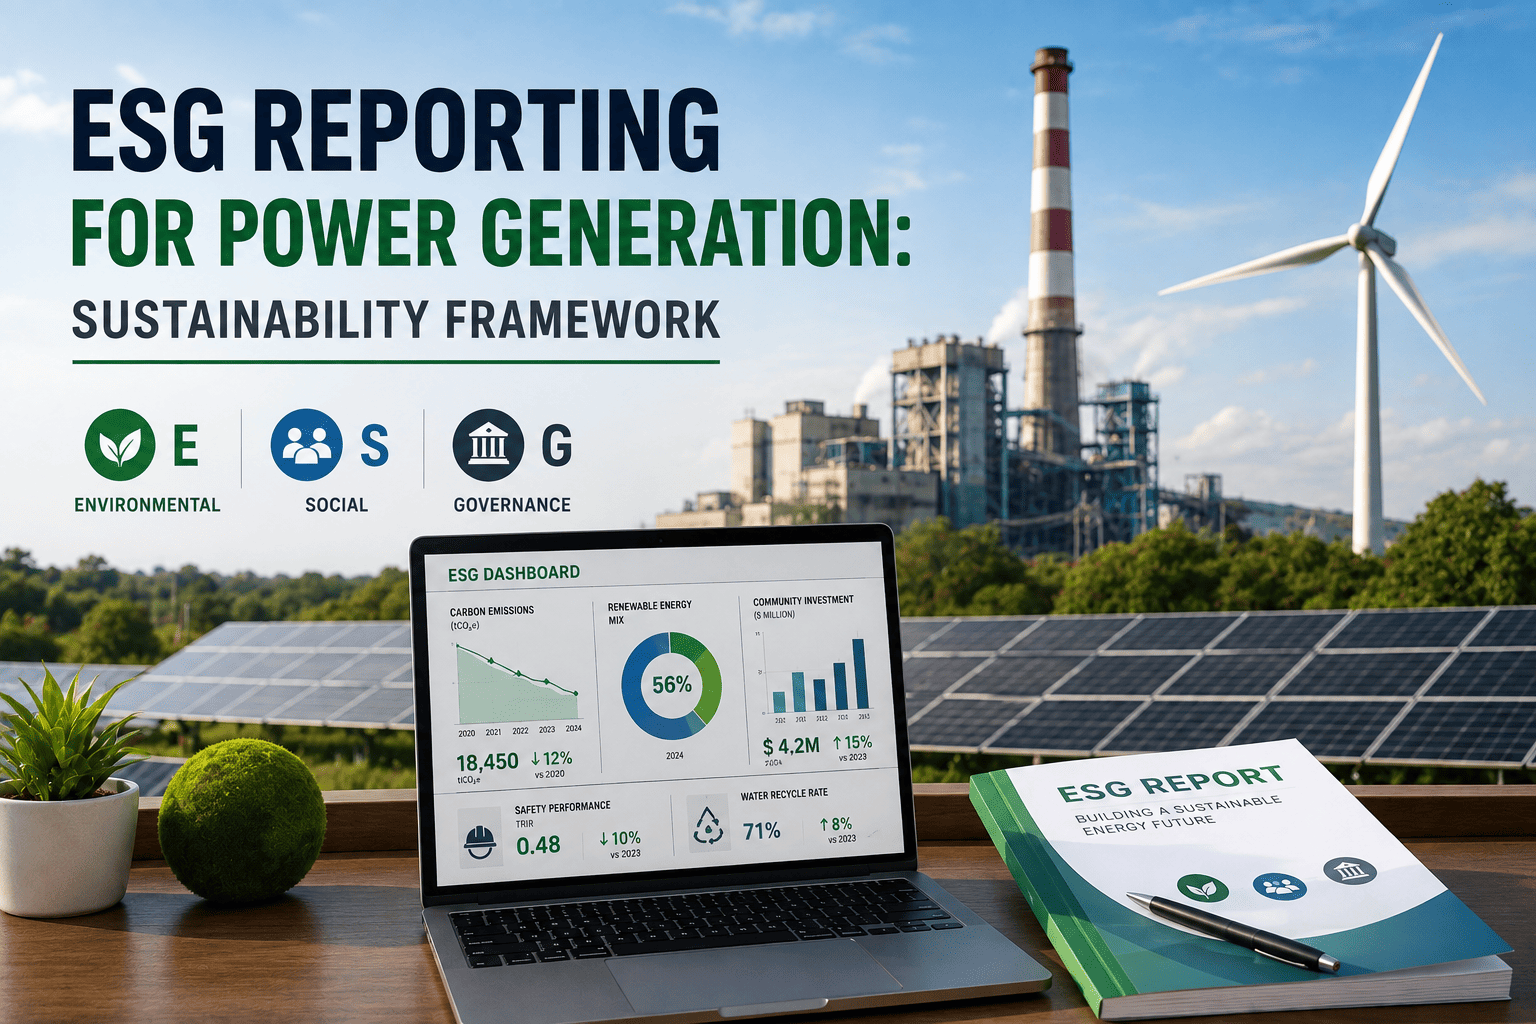
Power generation is the single largest source of greenhouse gas emissions in the United States, accounting for approximately 25% of total GHG output, and the regulatory pressure to measure, report, and reduce those emissions has never been more intense. The SEC Climate Disclosure Rule, updated EPA Greenhouse Gas Reporting Program requirements, and voluntary frameworks like TCFD and SASB are converging on a single demand: every power plant must know its carbon footprint with precision, defend it with auditable data, and demonstrate a credible reduction trajectory — or face escalating financial and reputational consequences. The challenge is that carbon accounting for a power generation facility requires aggregating data from CEMS analyzers, fuel management systems, utility meter readings, supply chain records, and dozens of spreadsheets maintained by different teams with different data standards. AI-powered carbon tracking and ESG reporting platforms solve this by ingesting every emissions data stream into a single intelligence layer that calculates Scope 1, 2, and 3 emissions automatically, maps them to any reporting framework, and generates audit-ready disclosures at a fraction of the current cycle time. This guide explains how AI-driven carbon tracking transforms power plant ESG reporting from a manual compliance burden into an automated strategic capability. Book a demo

CARBON TRACKING · ESG REPORTING · POWER GENERATION · 2026
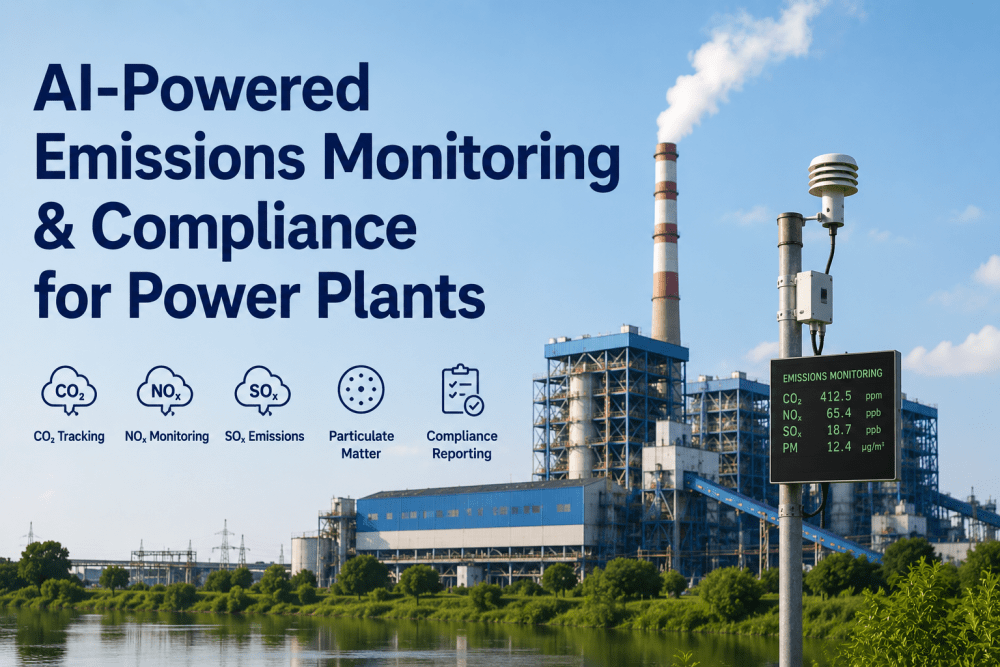
AI-Powered Carbon Emissions Tracking and ESG Reporting for Power Plants
Automate Scope 1, 2, and 3 emissions tracking across your generation fleet. Generate audit-ready ESG reports aligned with SEC, EPA, GHG Protocol, SASB, TCFD, and GRI frameworks — without manual data reconciliation.
25%Of U.S. GHG Emissions from Power Generation

90%Faster ESG Report Generation with Automated Tracking

3-5Reporting Frameworks per Plant Required

1Unified Platform for Full Carbon Lifecycle

Common Carbon Reporting Challenges in Power Generation

Power plant sustainability and compliance teams face a persistent set of data management challenges that make accurate carbon accounting far more difficult than it should be. Understanding these obstacles is the foundation of any effective carbon tracking program. Each challenge below represents a point of failure that AI-powered platforms are specifically designed to eliminate.

Data FragmentationCarbon data lives across CEMS analyzers, fuel management systems, utility bills, DCS historians, and procurement databases — each with its own format, update frequency, and accuracy level. Consolidating manually is error-prone and consumes hundreds of engineering hours per reporting cycle.
Manual Calculation Spreadsheet-based carbon calculations introduce formula errors, unit conversion mistakes, and version control problems. A single incorrect emission factor applied across a 500 MW plant's fuel consumption data can misstate annual CO2 emissions by thousands of metric tons.
Regulatory UncertaintyThe SEC Climate Disclosure Rule final rule, evolving EPA GHG reporting requirements, and state-level carbon accounting mandates create a moving target. Platforms must adapt to changing reporting boundaries, emission factor updates, and disclosure format changes without manual reconfiguration.
Scope 3 Data GapsScope 3 emissions — fuel supply chain, purchased goods, capital equipment, and customer end-use — require data from suppliers and customers that is rarely available in consistent formats. Most power plants estimate Scope 3 with error margins exceeding 30%.
Audit Trail WeaknessThird-party verification under ISO 14064 requires a complete audit trail from raw data to reported emissions. Manual processes leave gaps in data lineage, emission factor sourcing, and calculation methodology documentation that can delay or compromise verification.

Carbon Accounting Framework: Scope 1, 2, and 3 Emissions

The GHG Protocol Corporate Standard defines three scopes of emissions that collectively represent a power generation facility's full carbon footprint. Each scope requires different data sources, calculation methodologies, and reporting processes. AI-powered platforms automate all three from a single connected data model.

Scope 1: Direct Emissions
GHG Protocol — Stationary Combustion and Fleet
Full Automation
Emission SourcesFuel combustion in gas turbines, steam turbines, boilers, emergency generators, and plant fleet vehicles — all sources directly owned or controlled by the facility
Data SourcesCEMS analyzers for CO2 concentration and stack flow; fuel management for consumption, heating value, and carbon content; DCS for unit operating hours and load profiles
Calculation MethodFuel-based method (fuel consumption × emission factor) preferred when fuel data is available. Continuous emissions monitoring method (CEMS CO2 × stack flow) used when CEMS data meets QA/QC standards
Automation BenefitAuto-ingest fuel and CEMS data, apply correct EPA or GHG Protocol emission factors, calculate monthly and annual totals, flag data gaps for manual review before they affect reports
iFactory IntegrationReal-time CEMS and DCS data ingestion; automated fuel-based and CEMS-based calculation with cross-validation; audit-ready data lineage for every computed emission ton
Scope 2: Indirect Energy Emissions
GHG Protocol — Purchased Electricity, Steam, Heat
Automated Calculation
Emission SourcesPurchased electricity imported from the grid, purchased steam or heat from third-party sources, and any other indirect energy consumed but not generated on site
Data SourcesUtility meter data (smart meters, interval meters, utility bills); purchased steam or heat meter readings; REC and offset certificate records for market-based method
Calculation MethodLocation-based method (grid average emission factor × purchased MWh) and market-based method (specific utility or REC factor × purchased MWh) both required for GHG Protocol and SEC reporting
Automation BenefitAuto-sync utility meter data, maintain up-to-date eGRID or utility-specific emission factors, compute both location and market-based totals, track REC retirement against claims
iFactory IntegrationUtility API or meter data ingestion; automated eGRID factor updates; dual-location and market-based calculation; REC tracking and retirement verification for verified claims
Scope 3: Value Chain Emissions
GHG Protocol — All Other Indirect Emissions
AI-Enhanced Estimation
Emission SourcesFuel extraction and transport (Category 3), purchased goods and services (Category 1), capital equipment (Category 2), upstream transportation (Category 4), and customer end-use of electricity (Category 11) for investor-owned utilities
Data SourcesFuel supplier emissions data, procurement spend data by category, capital project records, transmission and distribution loss data, customer consumption profiles
Calculation MethodSpend-based method (procurement spend × EEIO emission factors) for upstream categories. Average-data method (fuel consumed × upstream emission factor) for fuel supply chain. Customer end-use calculated from delivered MWh times customer emission factors
Automation BenefitAuto-classify procurement spend into emission categories, apply EPA EEIO or EXIOBASE factors, estimate fuel supply chain emissions from fuel consumption data, flag high-emission suppliers for engagement
iFactory IntegrationERP procurement data ingestion with AI-based spend classification; automated EEIO factor application; supplier-specific data collection workflows; scope 3 estimation with confidence bands for audit documentation
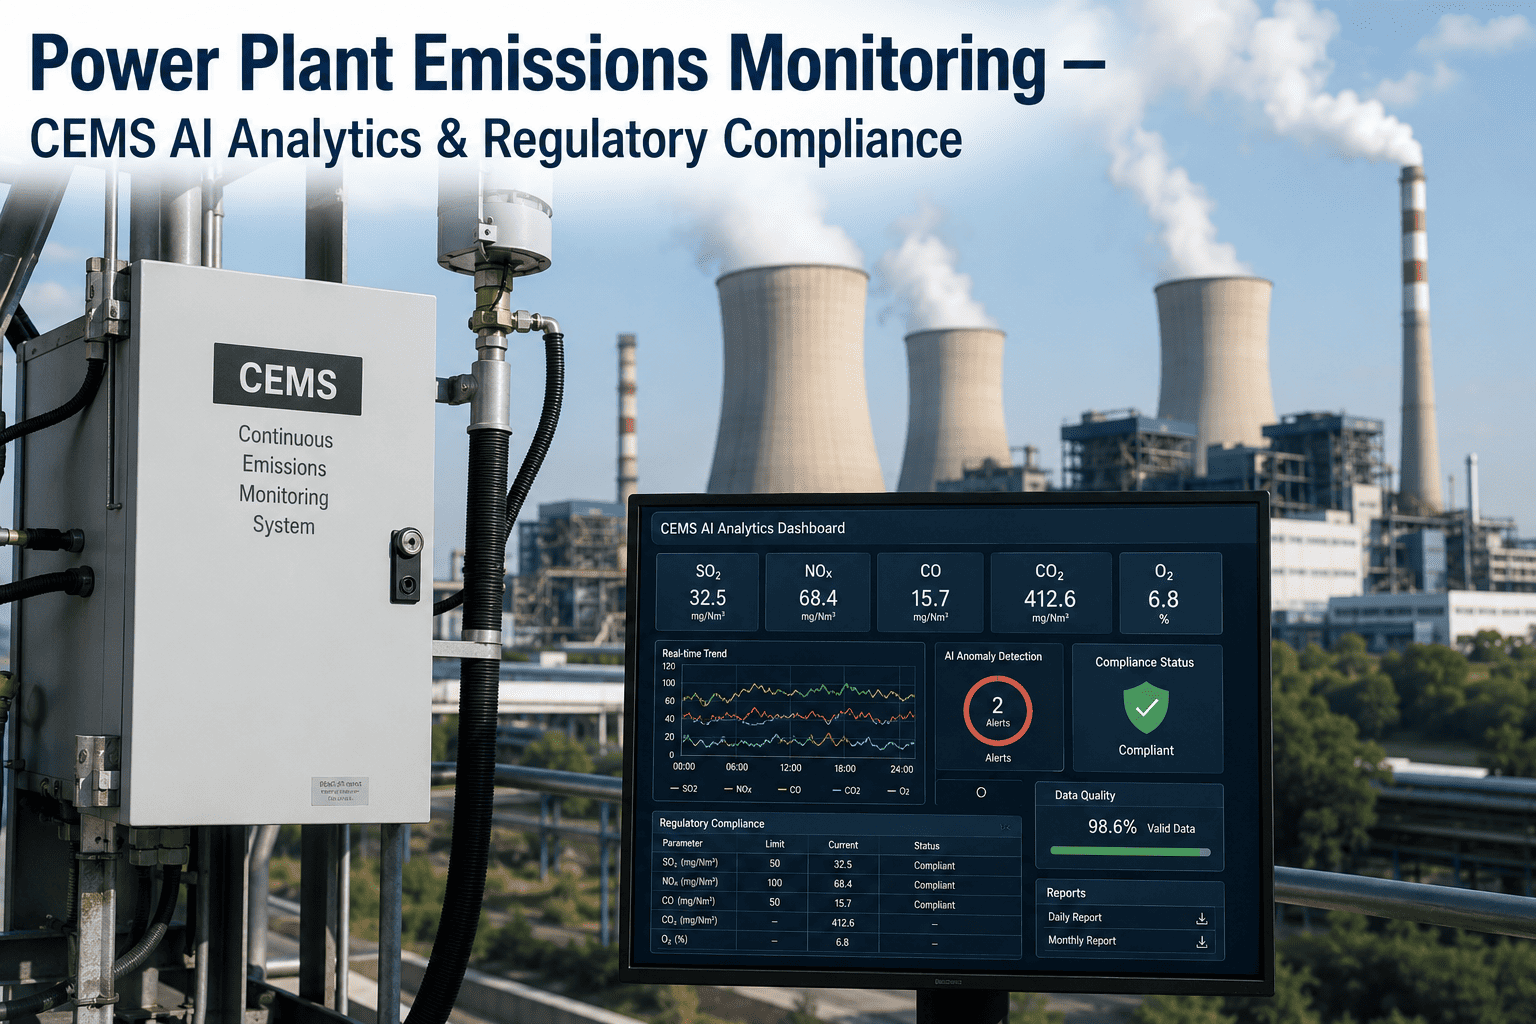
The power generation industry has spent decades perfecting continuous emissions monitoring for regulatory compliance. Carbon accounting for ESG reporting requires the same data discipline applied to a broader boundary — every ton of CO2 equivalent across every scope, every fuel source, every purchased megawatt-hour, and every supply chain category. AI-powered platforms make that scope expansion practical instead of overwhelming.Book a Demo

Key Carbon KPIs and ESG Benchmarks

An effective carbon tracking platform is only as valuable as the metrics it calculates with accuracy and auditability. These are the twelve KPIs that power plant sustainability teams monitor across reporting cycles — and the benchmarks that differentiate credible decarbonization programs from green claims. Each metric is calculated automatically from validated plant data, mapped to the relevant reporting framework, and documented with a complete audit trail for third-party verification.

Carbon KPI What It Measures Reporting Framework Industry Benchmark
CO2 Emission Rate Metric tons CO2 per MWh generated (Scope 1) GHG Protocol, EPA, SEC <0.4 tCO2/MWh
Scope 1 Total Total direct CO2e from all owned sources GHG Protocol, CDP, SEC Verified annually
Scope 2 Total Total indirect CO2e from purchased energy (location + market) GHG Protocol, SASB, SEC Dual reporting
Scope 3 Total Total value chain CO2e across applicable categories GHG Protocol, TCFD, SEC Estimated + improving
GHG Intensity Total CO2e per MWh or per revenue dollar SASB, TCFD, GRI Declining YoY
Carbon Neutrality Progress Percentage of emissions covered by verified reductions or offsets Voluntary, SBTi SBTi-aligned trajectory
Renewable Energy Share Percentage of total energy consumption from renewable sources GHG Protocol, SASB, GRI Increasing per target
Verified Emissions % Percentage of reported emissions covered by third-party verification ISO 14064, SEC 100% of Scope 1+2
Report Timeliness Days from period end to report submission CDP, SEC, Investor req. <30 days
Offset Credit Quality Percentage of offsets from verified, additional, permanent sources Voluntary carbon market 100% verified
SBTi Alignment Emissions trajectory vs. Science Based Targets initiative pathway SBTi, TCFD 1.5°C pathway
Data Completeness Percentage of required data points available and validated All frameworks 98%+
What carbon tracking looks like without an AI-powered platform

Sustainability engineer exports monthly CEMS CO2 data from the CEMS workstation to CSV. Requests fuel consumption data from operations team, who pulls it from the DCS historian. Receives utility invoices from accounts payable via email. Procurement data for Scope 3 arrives as a spreadsheet from supply chain team. Engineer manually combines all data in Excel, applies emission factors copied from EPA website, calculates scope totals using vlookup formulas, formats tables for the GHG Protocol report, and saves the file as "Q3_Carbon_v3_FINAL_revised.xlsx". Process takes 3-5 full-time days per reporting period. Error risk: high. Audit trail: nonexistent. Verification readiness: requires weeks of retroactive documentation.

90%
Faster Report Generation
→
100%
Audit-Ready Records
→
1
Unified Carbon Platform
→
5
Reporting Frameworks Supported

What Sustainability Leaders Say About Automated Carbon Tracking

The transition from manual spreadsheet-based carbon accounting to AI-powered platforms is transforming how power generation sustainability teams operate. Here is what industry professionals with decades of combined ESG and carbon management experience have to say about the shift.

Turn Your Plant's Carbon Data into Audit-Ready ESG Reports — Automatically
iFactory deploys in weeks on your existing power plant infrastructure. Pre-built integrations for CEMS analyzers, DCS historians, utility meters, and ERP systems. No manual data entry required. Full support for GHG Protocol, SASB, TCFD, GRI, SEC, and ISO 14064 frameworks.

Frequently Asked Questions

What data sources does iFactory connect to for automated carbon tracking?
The platform connects to all major CEMS analyzer brands via OPC-UA and Modbus, DCS historians including OSIsoft PI and AspenTech IP.21, utility meters via API or meter gateway, fuel management systems, ERP platforms (SAP, Oracle) for procurement data, and manual upload interfaces for data sources without API connectivity.
How does the platform handle the dual location-based and market-based Scope 2 reporting requirement?
The platform automatically computes both location-based Scope 2 emissions using the latest eGRID subregion emission factors and market-based Scope 2 emissions using utility-specific emission rates and retired REC or certificate data. Both calculations are performed from the same utility meter data with clear methodology documentation for each result. The platform tracks REC retirements against reported market-based claims and flags any discrepancies between retired certificates and claimed reductions. Output reports include both values in the format required by GHG Protocol, SEC, and SASB disclosure frameworks.
What is the typical implementation timeline for the carbon tracking platform?
Initial Scope 1 tracking with CEMS and DCS integration typically deploys in 4-6 weeks, including data source connection, calculation configuration, and dashboard deployment. Scope 2 adding utility meter integration deploys in weeks 6-8. Scope 3 with procurement data integration and AI-based spend classification deploys in weeks 8-12. Full multi-framework ESG report generation is typically operational within 12-16 weeks from kickoff. The phased deployment approach ensures that Scope 1 tracking — which covers 80-90% of a power plant's total emissions — is generating value before the full scope deployment is complete.
How does the platform support third-party verification under ISO 14064?
The platform generates a complete verification evidence library for every reporting period, including data lineage from source system to reported total, emission factor sourcing documentation with original source references, calculation methodology records for every emission line item, data quality flags and any estimated or proxy values used, and uncertainty assessment in accordance with ISO 14064-1 requirements. The verifier receives role-based platform access to review the evidence library, run audit queries on any reported value, and download source documentation — eliminating the weeks of retroactive documentation gathering that manual processes require.
Does iFactory support multi-site and fleet-wide carbon tracking for utilities with multiple generating assets?
Yes. The platform is designed for multi-site, multi-unit deployments with hierarchical data aggregation. Individual unit emissions are calculated at the unit level from dedicated CEMS and fuel data. Unit totals roll up to plant-level carbon accounts. Plant totals roll up to fleet-level sustainability reports. Corporate sustainability teams see fleet-wide carbon footprints, emission intensity trends, and SBTi trajectory compliance across all assets — all calculated from source-validated unit-level data. Report generation supports any aggregation level from single unit to entire fleet, enabling both regulatory compliance at the unit level and corporate ESG reporting at the enterprise level.

Conclusion: The Future of Carbon Tracking Is Automated, Unified, and Audit-Ready

The pressure on power generation to measure, report, and reduce carbon emissions is not subsiding — it is accelerating. SEC climate disclosure requirements, EPA GHG program updates, SBTi commitment deadlines, and investor demand for standardized ESG data are converging on a single operational reality: every power plant needs a carbon accounting infrastructure that is as reliable and automated as its financial accounting systems. The era of spreadsheet-based carbon tracking, manual data reconciliation, and reactive report generation is ending — not because sustainability teams lack diligence, but because the volume of data, the number of frameworks, and the verification standards have outgrown manual processes.

.
CARBON TRACKING · ESG REPORTING · SUSTAINABILITY · iFACTORY AI
Ready to Transform Your Power Plant's Carbon Tracking from Manual to Automated?
iFactory is the AI-powered carbon tracking platform that connects CEMS data, utility meters, fuel systems, and procurement data to audit-ready ESG reports. Deployed in weeks. Compatible with every major reporting framework. No manual data entry required.

Share This Story, Choose Your Platform!