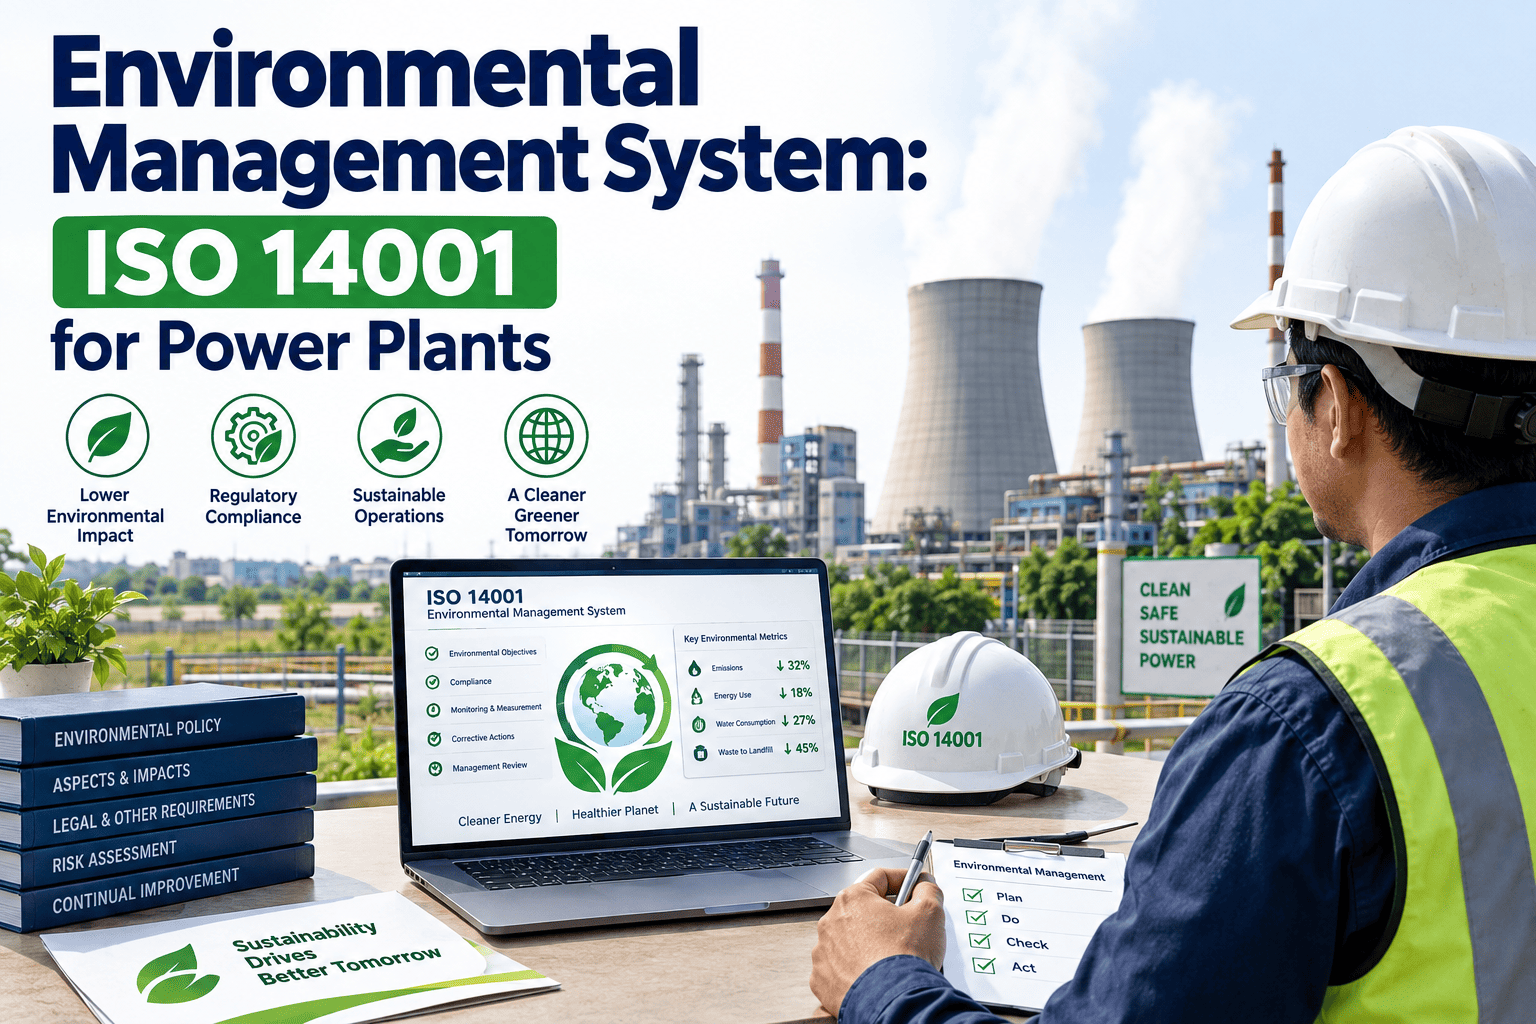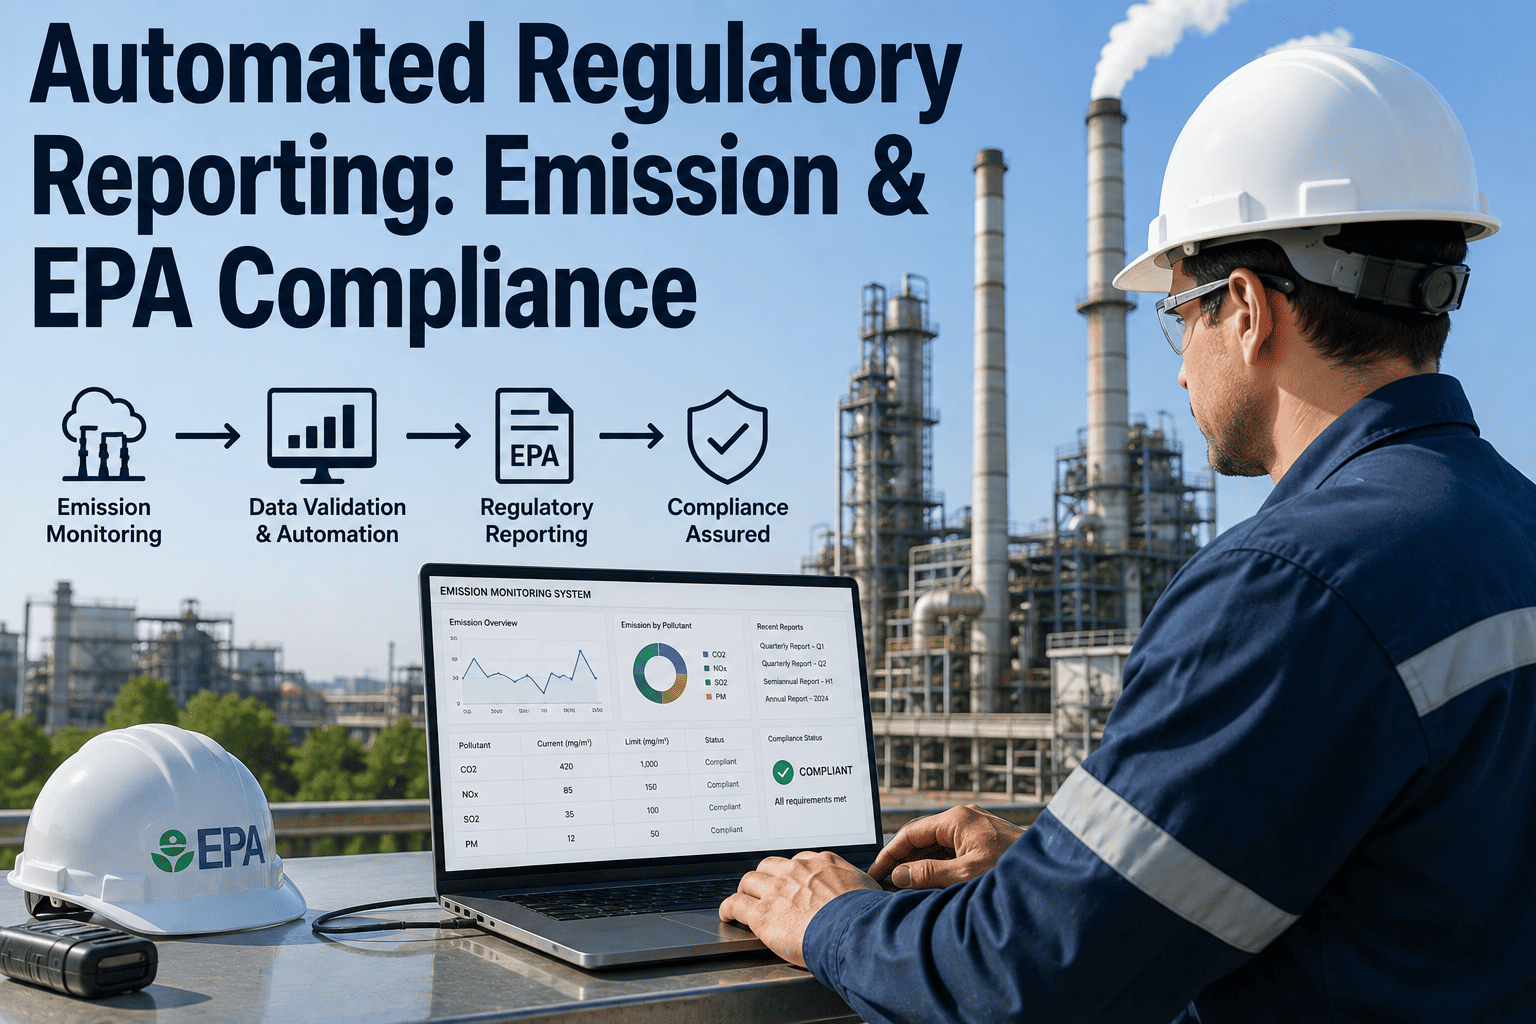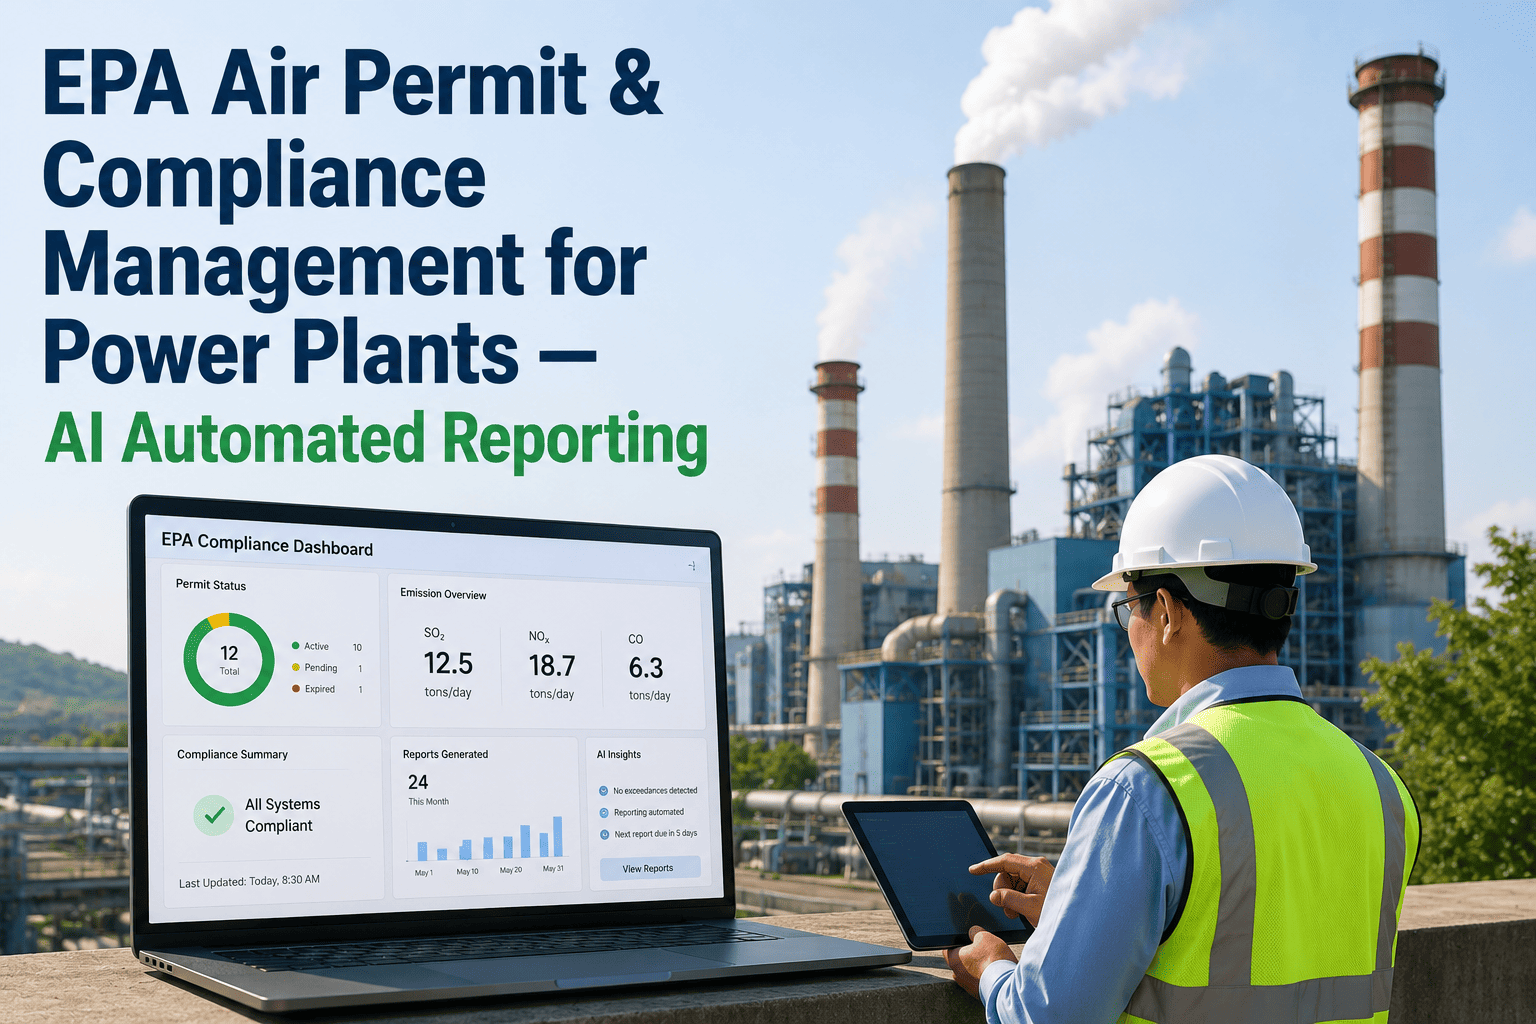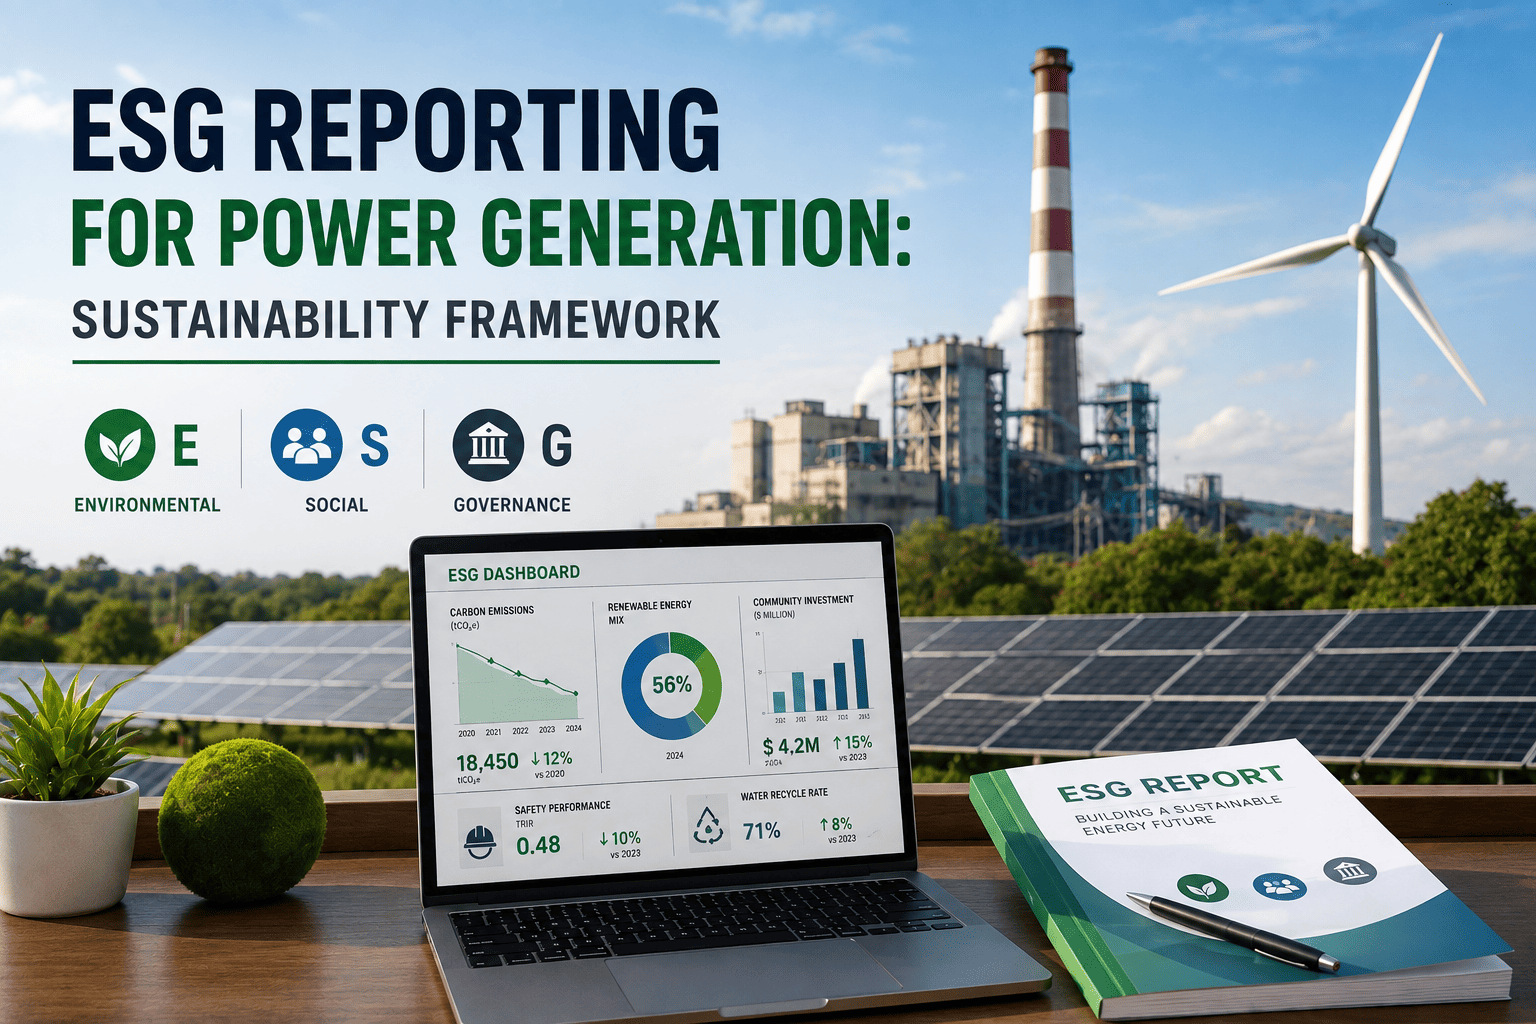
Power generation companies sit at the center of the ESG reporting challenge because every metric that investors, regulators, and communities care about traces directly back to how electricity is produced, transmitted, and sold. Emissions intensity, water withdrawal per megawatt-hour, workforce safety rates, board-level climate governance, and transition risk disclosures all have to come from plant-level data that lives in scattered systems across operations, environmental compliance, HR, and finance. Most generating companies are building their ESG reports by manually extracting data from those silos every quarter, which is slow, error-prone, and impossible to audit. iFactory connects to your plant data sources and structures ESG reporting around the frameworks your investors and regulators actually ask for, turning weeks of spreadsheet assembly into a repeatable, auditable process.
You are assembling ESG reports from spreadsheets. Your investors can tell.
iFactory structures plant-level ESG data around GRI, SASB, TCFD, and CDP frameworks so your sustainability disclosures come from live systems, not quarterly data scavenger hunts.
Power generation sits under more framework scrutiny than almost any other sector
No industry faces a more complex ESG reporting environment than power generation. The sector is the single largest source of greenhouse gas emissions in most economies, which means every major sustainability reporting framework has sector-specific metrics designed specifically for how generating companies operate. The challenge is not just collecting data but understanding which framework requires which metric, how those metrics overlap, and where gaps exist in your current data infrastructure that will become disclosure failures when the next reporting cycle arrives.
Requires disclosure on total direct and indirect GHG emissions, water withdrawal by source, NOx and SOx emissions, particulate matter, waste generation, workforce composition by gender and contract type, occupational health and safety metrics including fatality and lost-time injury rates, community engagement processes, and anti-corruption training. GRI is the most comprehensive framework and forms the baseline that most other frameworks reference or build upon for power sector entities.
Focuses on financially material sustainability factors including GHG emissions per MWh generated, sulfur dioxide and nitrogen oxides emissions intensity, water consumed per MWh, coal ash management practices, grid resilience and reliability metrics, capital expenditure on low-carbon generation capacity, and nuclear safety indicators. SASB is specifically designed for investor communication and is increasingly referenced in SEC climate disclosure requirements for registered power generation companies.
Requires governance around climate risks and opportunities, scenario analysis showing how different warming pathways affect your generation portfolio value, physical and transition risk identification for each asset class in your fleet, and metrics tracking progress toward any disclosed climate targets. TCFD has moved from voluntary to effectively mandatory for listed generators in many jurisdictions and directly feeds into SEC and ISSB climate disclosure rules.
Combines quantitative emissions and energy data with qualitative governance and strategy questions. For power generators, CDP scoring heavily weights emissions reduction initiatives, renewable capacity additions, coal fleet retirement plans, and science-based target validation. A low CDP score directly affects how institutional investors and lenders view your creditworthiness and long-term viability as the energy transition progresses.
The ESG data gap between what frameworks ask for and what your plants can easily provide
Every ESG reporting framework asks for data that exists somewhere in your organization. The problem is that it exists in different systems, owned by different departments, collected at different frequencies, and structured in formats that were never designed to be combined into a single disclosure. The gap between what the framework requires and what your team can pull together in the reporting window is where ESG reporting fails, producing either delayed filings, restated numbers, or metrics that are so aggregated they lose the granularity investors expect.
Gap percentages represent the typical difference between framework disclosure requirements and data readily available from plant-level systems at power generation companies, based on iFactory implementation data across thermal and renewable fleet operators.
Environmental, social, and governance data all originate at the plant level
ESG frameworks organize disclosures into three pillars, but in a power generation company, all three pillars draw from the same operational reality. Environmental metrics come from emissions monitoring, fuel tracking, and water systems at each plant. Social metrics come from workforce management, safety incident tracking, and community interaction records that are managed at the facility level. Governance metrics originate from board and corporate-level processes but are validated by how climate risks are actually managed at each generating asset. Treating ESG data collection as a corporate-only exercise, disconnected from plant operations, is why most reporting programs struggle to produce auditable data.
Stop building ESG reports from spreadsheets pulled together under deadline pressure
iFactory connects your plant systems to a structured reporting layer that maps live data to GRI, SASB, TCFD, and CDP requirements automatically.
Which metrics overlap across GRI, SASB, TCFD, and CDP
One of the most frustrating aspects of ESG reporting for power generators is that the four major frameworks ask for many of the same metrics but in different formats, at different granularity levels, and with different boundary definitions. Without a mapping layer that shows exactly where overlaps and gaps exist, your team ends up calculating the same metric three different ways for three different reports, or worse, reporting inconsistent numbers across frameworks that investors compare side by side. The table below maps the most critical power generation metrics across all four frameworks so you can see exactly where efficiency gains are possible and where your current data infrastructure has real gaps.
| Metric | GRI | SASB EM-EU | TCFD | CDP |
|---|---|---|---|---|
| Scope 1 GHG emissions | 305-1 Total by source | EM-EP-110a.1 Intensity per MWh | Required metric | Required C6.1 |
| Scope 2 GHG emissions | 305-2 Location and market-based | EM-EP-110a.1 Purchased power | Required metric | Required C6.2 |
| GHG emissions intensity | 305-4 Intensity ratio | EM-EP-110a.1 Core metric | Recommended metric | Required C6.3 |
| Water withdrawal | 303-3 By source | EM-EP-130a.1 Per MWh | Physical risk indicator | Water questionnaire |
| NOx and SOx emissions | 305-7 NOx, 305-8 SOx | EM-EP-110a.2 Intensity | Transition risk indicator | C3.7 Pollutants |
| Coal ash management | 306-3 Waste by type | EM-EP-140a.1 Disposal method | Physical risk indicator | C3.12 Waste |
| Workforce safety TRIR | 403-9 Work-related injury | Not sector-specific | Not required | C5.1 Safety |
| Board climate oversight | 2-9 Governance structure | Not directly required | Required disclosure | C0.2 Governance |
| Climate scenario analysis | 201-2 Financial implications | Not directly required | Core recommendation | C2.1a Scenarios |
| Low-carbon capex ratio | Not directly required | EM-EP-410a.1 Capex disclosure | Opportunity metric | C4.3a Investments |
This mapping reveals that a single well-structured data point, such as Scope 1 GHG emissions by generating unit, can satisfy disclosure requirements across all four frameworks simultaneously. The problem is not that the data does not exist at your plants. The problem is that nobody has built the translation layer between plant-level emissions monitoring systems and the specific format, boundary, and calculation methodology that each framework requires. That translation layer is exactly what iFactory provides, and it eliminates the redundant calculation work that consumes most of the ESG reporting cycle at power generation companies today.
GHG accounting is the foundation of every power generation ESG report
Greenhouse gas emissions are the single most scrutinized metric in power generation ESG reporting, and the area where data quality issues cause the most reputational and regulatory damage. Getting emissions accounting right requires more than multiplying fuel consumption by emission factors. It requires understanding the specific calculation methodologies each framework prescribes, managing the boundary definitions between your operations and third-party power purchases, handling biogenic carbon from biomass co-firing correctly, and maintaining calculation documentation that can withstand third-party assurance. The complexity scales with the diversity of your generating fleet, because each fuel type and generation technology has different emission factor sources, different measurement approaches, and different framework-specific treatment rules.
Direct emissions from owned generation
Indirect emissions from purchased energy
Value chain emissions beyond direct operations
Environmental metrics that investors increasingly weight as heavily as carbon
Carbon emissions dominate ESG headlines, but institutional investors and ESG rating agencies have been expanding their focus to a broader set of environmental performance indicators that directly affect the long-term asset value of generating facilities. Water stress at thermal plants, air quality compliance trends, waste management practices, and biodiversity impacts around generation sites all factor into ESG scores that influence capital access and insurance pricing. These metrics are harder to standardize than carbon because they are highly site-specific, but that site-specificity is exactly what makes them material to investors evaluating individual generation assets rather than aggregate fleet performance.
Water withdrawal intensity per MWh
Thermal plants using once-through cooling withdraw significantly more water per MWh than recirculating or dry-cooled plants, and water stress in the watershed where the plant operates determines whether this metric is material. SASB requires water consumed per MWh, while GRI asks for withdrawal by source type including surface water, groundwater, and municipal supply. Plants in water-stressed regions face both operational risk from cooling water restrictions and disclosure risk from investors tracking water stewardship as a climate adaptation indicator.
Criteria pollutant emissions intensity
NOx, SOx, and particulate matter emissions per MWh are required by both GRI and SASB and are increasingly used by ESG raters as a proxy for environmental management quality. CEMS data provides continuous measurement at most large units, but aggregating to the intensity metrics frameworks require, especially when plant configurations include both CEMS-monitored and non-CEMS sources, introduces calculation complexity that manual processes struggle to handle consistently across reporting periods.
Coal combustion residual management
Coal ash disposal method, closure status of impoundments, and beneficial reuse percentage are specifically required by SASB and increasingly requested by CDP and GRI reporters. The EPA CCR rule has driven significant compliance investment, but translating closure progress and disposal method data into the format ESG frameworks require is a separate workflow that most environmental compliance teams have not had time to build. iFactory captures CCR data from your existing compliance tracking and structures it for ESG disclosure.
Operations in or near sensitive areas
GRI requires disclosure of operations in or adjacent to protected areas and areas of high biodiversity value, including the nature of any significant impacts and mitigation measures. For hydroelectric facilities and plants near waterways, this includes aquatic ecosystem impacts from thermal discharge, flow alteration, and habitat fragmentation. Most generators have environmental impact assessments from permitting but have not structured that information for recurring ESG disclosure, creating a gap that is visible to investors who compare your disclosure depth against peers.
From plant systems to framework-ready disclosures in one layer
iFactory does not replace your emissions monitoring systems, your CEMS, your HR platform, or your safety management software. What it does is sit above those systems as a data orchestration layer that extracts the metrics those systems produce, translates them into the specific format, boundary, and calculation methodology that each ESG framework requires, and makes the results available for reporting, audit trail, and trend analysis. The value is not in new data collection but in eliminating the manual translation work that currently consumes your ESG reporting team for weeks every quarter.
Map frameworks to your data sources
Every disclosure requirement in GRI, SASB, TCFD, and CDP is mapped to the specific plant system or data source that can supply the underlying metric. This mapping becomes the permanent blueprint your team follows for every reporting cycle, so you never start from scratch.
Automate metric calculation with framework rules
Each metric is calculated using the specific methodology the framework prescribes, including the correct emission factors, boundary definitions, and intensity denominators. When a framework updates its methodology, the calculation rule updates in one place and applies to all reporting periods.
Validate data quality before disclosure
Automated checks flag data gaps, outliers, and inconsistencies before your team sees the numbers. Missing CEMS data periods, fuel flow meter discrepancies, and boundary mismatches between reporting periods are caught and surfaced for resolution rather than discovered during external assurance.
Generate framework-specific reports
Output is structured exactly as each framework's questionnaire or template requires, eliminating the reformatting work that currently happens between your internal analysis and the actual filing. GRI content index, SASB disclosure table, and TCFD recommended disclosures are generated from the same underlying data.
Track year-over-year trends with audit trail
Every reported metric is stored with its full calculation chain, data sources, and any restatement history. When an auditor asks how a specific number was calculated for reporting period three years ago, the answer is available in minutes rather than requiring reconstruction from archived spreadsheets.
Identify disclosure gaps before investors do
iFactory continuously compares your current data coverage against the full set of framework requirements and flags metrics where you have partial data, estimated data, or no data at all. This gap analysis lets you prioritize data infrastructure investments based on what will have the most impact on your ESG scores.
What the ESG reporting module tracks for your fleet
Multi-scope GHG accounting
Scope 1 by generating unit and fuel type, Scope 2 location and market-based, Scope 3 for purchased fuels, capital goods, and downstream transmission losses, all calculated with framework-specific methodologies.
Water withdrawal and consumption tracking
Withdrawal by source type, consumption by cooling system type, and intensity per MWh, with water stress mapping that highlights which plants face the highest disclosure scrutiny.
Criteria pollutant intensity metrics
NOx, SOx, and PM emissions aggregated from CEMS and non-CEMS sources, calculated as intensity per MWh generated for SASB and GRI disclosure formats.
CCR and waste management disclosure
Coal ash generation, disposal method breakdown, impoundment closure status, and beneficial reuse percentage structured for SASB EM-EP-140a.1 and GRI 306-3 requirements.
Workforce safety and diversity metrics
TRIR, LTIR, and fatality rates by facility type, workforce composition by gender and employment type, and training hours per employee aggregated from HR and safety systems.
Climate governance documentation
Board oversight structure, climate risk committee charter, executive compensation linkage to ESG targets, and scenario analysis documentation tracked and updated as governance practices evolve.
Cross-framework mapping engine
Every metric mapped to GRI, SASB, TCFD, and CDP requirements with overlap analysis showing which data points satisfy multiple framework disclosures simultaneously.
Full calculation audit trail
Every reported number traceable to source data, emission factors used, boundary definitions applied, and any manual adjustments made, stored permanently for assurance and restatement support.
Disclosure gap analysis dashboard
Real-time view of which framework metrics you can fully satisfy, which are partially covered, and which have no data source, ranked by impact on your overall ESG score.
What power generators achieve within two reporting cycles
What an ESG reporting pilot includes
Framework requirement inventory
Full catalog of GRI, SASB, TCFD, and CDP disclosure requirements mapped to your specific generating fleet composition and operating jurisdictions.
Data source mapping
Each disclosure requirement traced to the plant system, database, or manual data source that currently supplies or could supply the underlying data.
Calculation rule configuration
Framework-specific calculation methodologies configured for each metric, including emission factors, boundary definitions, and intensity denominators.
Historical data backfill
Previous reporting period data loaded and recalculated using consistent methodology to establish a clean baseline trend from day one.
10 to 14 week pilot cycle
Covers one full reporting cycle including data extraction, calculation, validation, framework output generation, and gap analysis for your highest-priority framework.
On-premise deployment
Runs on plant-network hardware, keeping emissions data, workforce metrics, and governance documentation inside your network perimeter.
ESG reporting for power generation, explained plainly
Your ESG data exists. It just is not reaching your disclosures in one piece.
iFactory connects your plant systems to GRI, SASB, TCFD, and CDP frameworks so your sustainability reports come from live data, not deadline-driven spreadsheets. Book a demo and see what structured ESG reporting looks like.