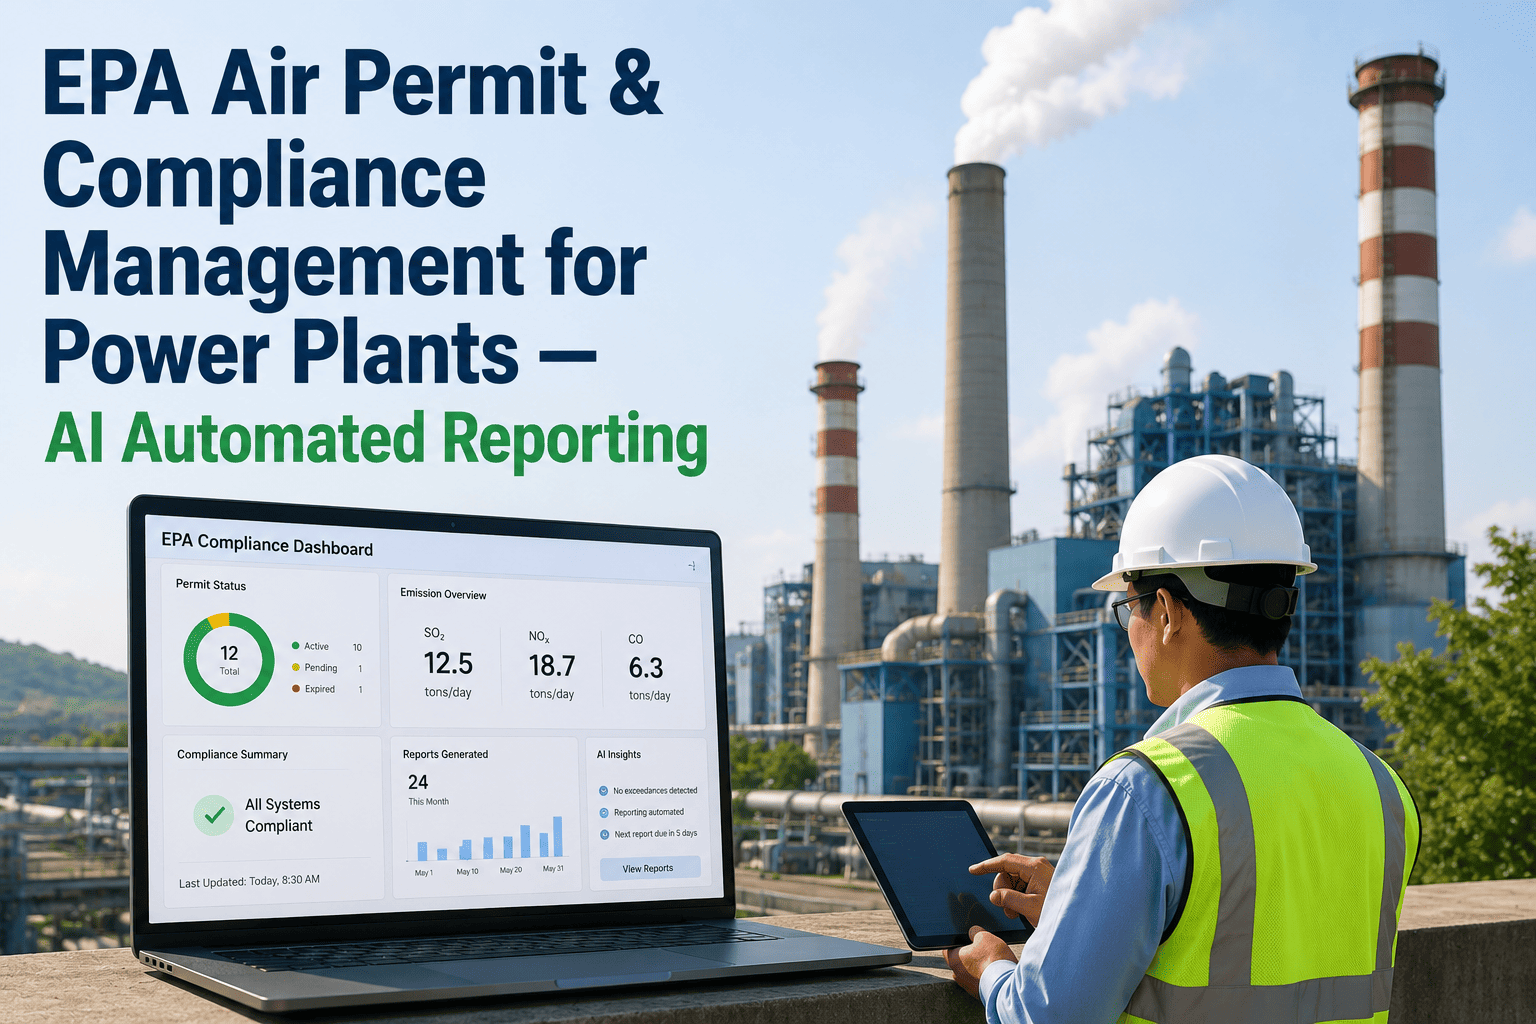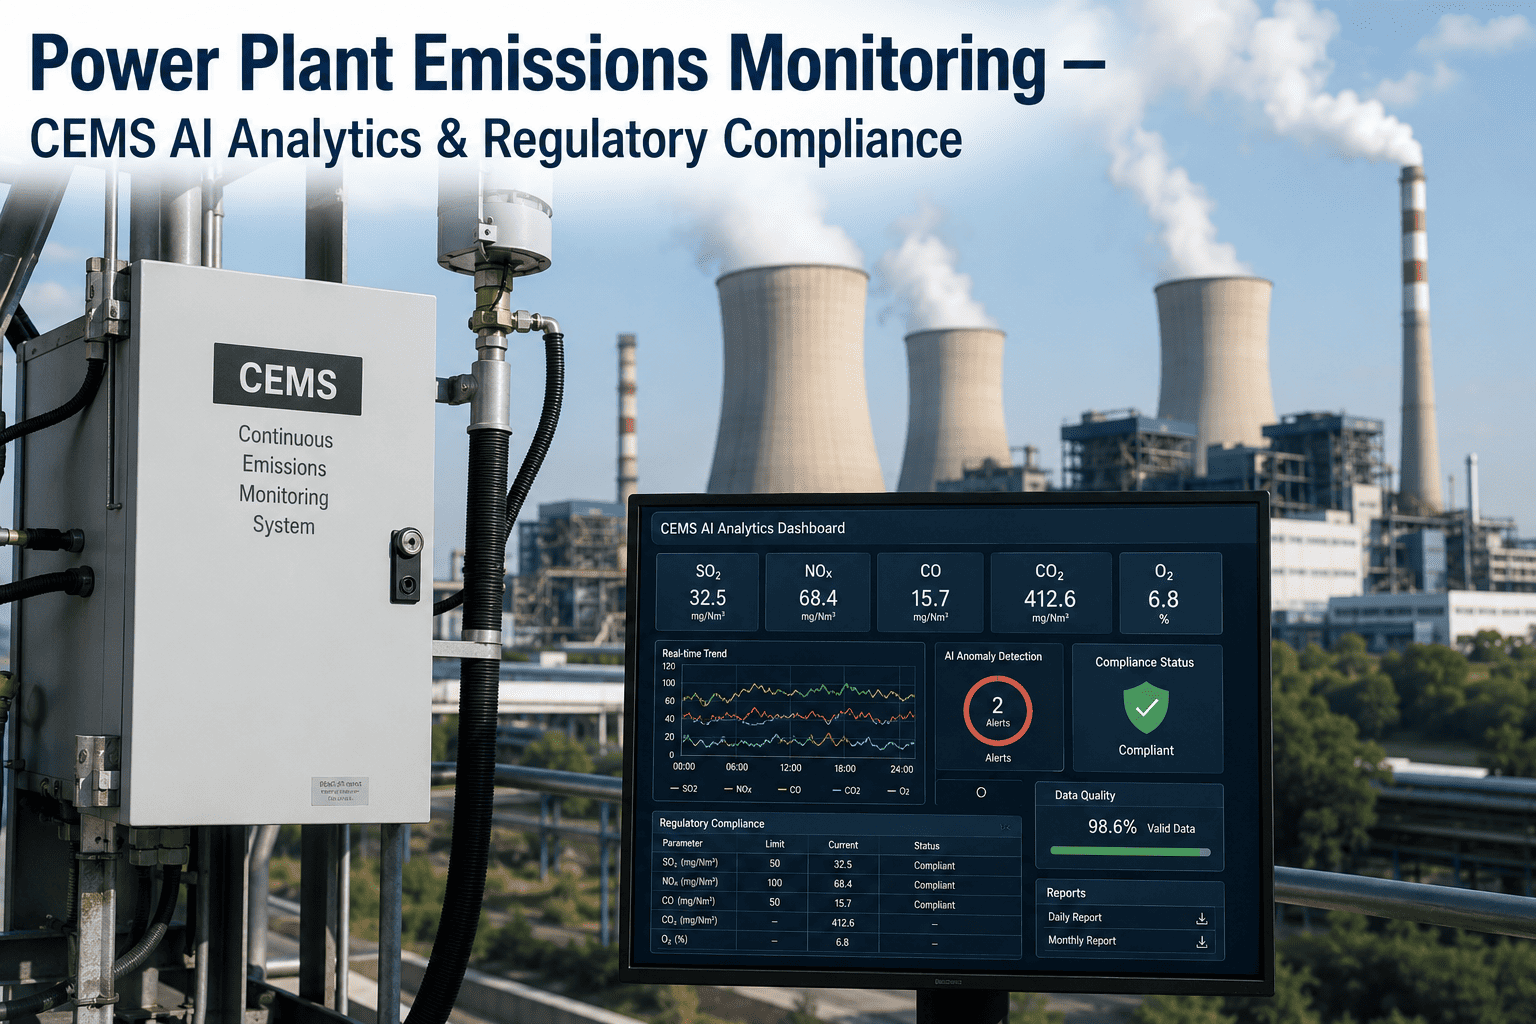
Emissions reporting deadlines do not move for a plant that is still pulling CEMS data by hand. Every quarter, environmental compliance teams at coal and gas-fired plants export analyzer data, reconcile it against DAHS logs, chase down missing or invalid data-substitution periods, and manually assemble the numbers into the exact format EPA's ECMPS, CDX, or state portal expects — a process that consumes days of skilled staff time and leaves plenty of room for the kind of small error that turns into an audit finding. The data itself is not the problem; it is already being collected. The problem is that it lives in disconnected systems that were never built to talk to each other. Plants ready to see what an integrated reporting workflow looks like against their own CEMS and DAHS setup can Book a Demo.
What Manual Emissions Reporting Actually Costs a Compliance Team
Ask most environmental compliance managers how reporting season goes and the answer is rarely about the emissions themselves — it is about the process of getting the data into a filable state. Four cost categories show up again and again on plants still running a manual or semi-manual reporting workflow.
Deadline and Penalty Exposure
Quarterly Part 75 submissions, annual Title V certifications, and GHGRP filings all carry hard deadlines. A late or rejected submission tied to a data reconciliation delay is one of the more avoidable compliance risks a plant carries — and one of the most expensive.
Skilled Staff Hours Diverted
Environmental engineers and compliance specialists are among the most specialized roles on a plant's staff. Spending their time manually reconciling spreadsheets against DAHS exports is a poor use of that expertise compared to substantive compliance and process work.
Data Reconciliation Errors
Every manual transfer between systems — analyzer to DAHS, DAHS to spreadsheet, spreadsheet to submission portal — is a point where a unit conversion, timestamp, or missing-data substitution can be entered incorrectly, often invisibly, until an auditor catches it.
Audit and Enforcement Risk
EPA and state regulators increasingly cross-check submitted data against source-level CEMS records. Discrepancies that trace back to manual assembly errors — not actual emissions events — still generate audit findings, notices of violation, and the staff time needed to respond to them.
From Stack to Filed Report: How the Data Actually Moves
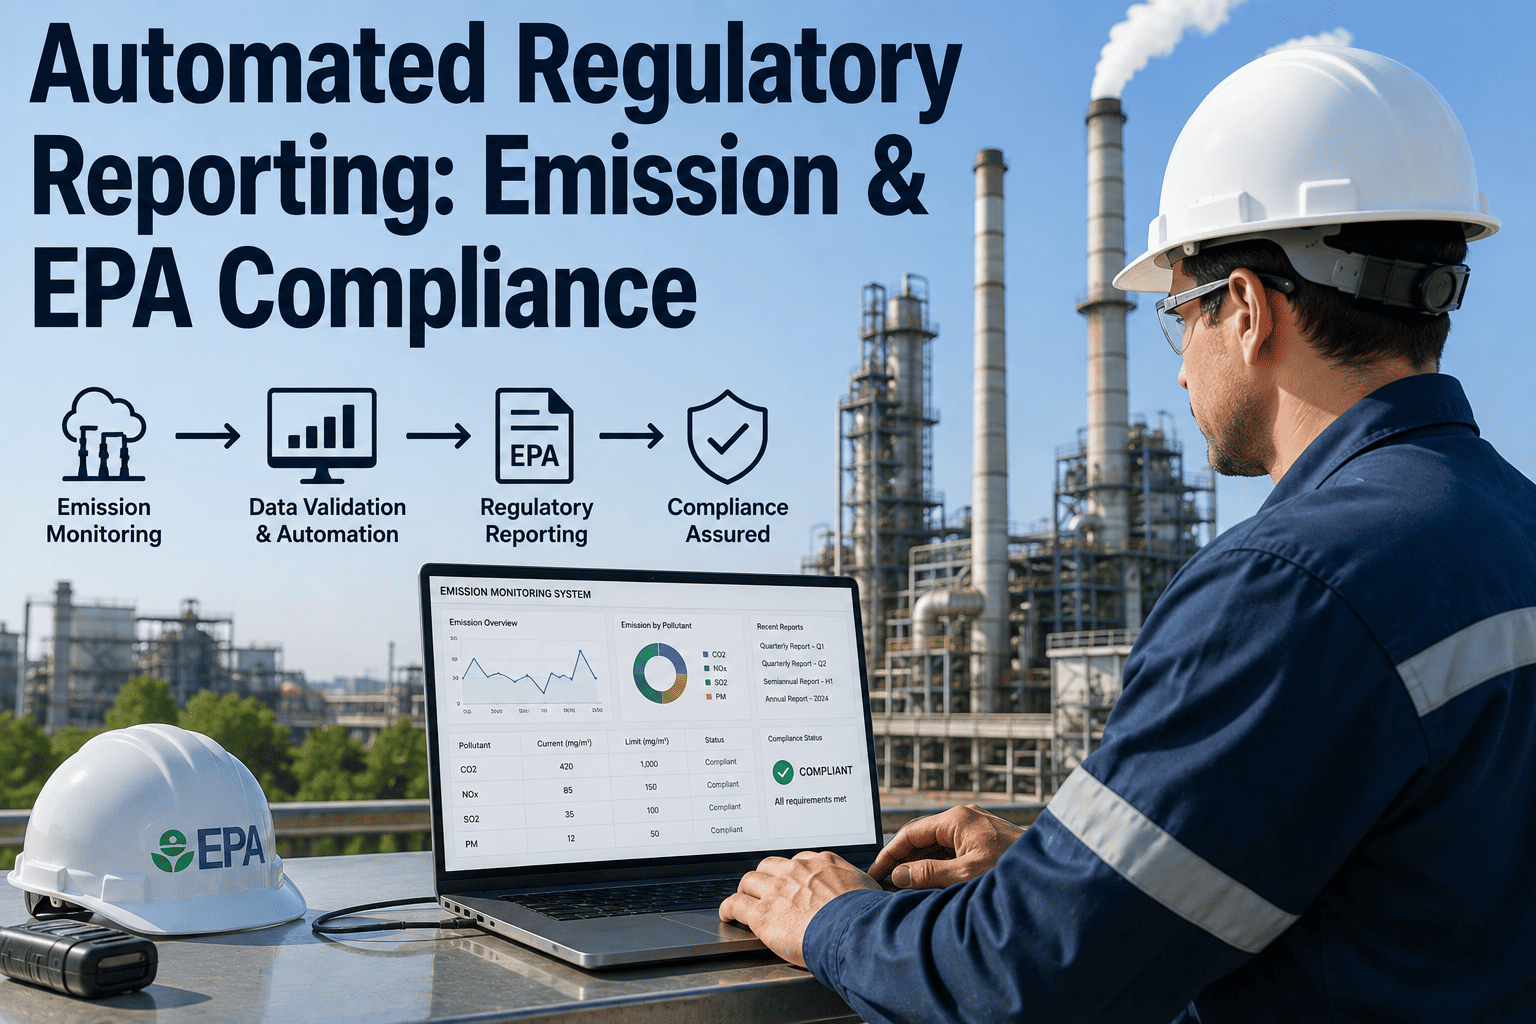
Every emissions report — regardless of which EPA program it serves — passes through the same five stages between the point of measurement and the point of submission. Automation applies at every stage, but most plants have only automated the first one or two.
Continuous stack analyzers measure SO2, NOx, CO2, opacity, and flow at the source, generating a continuous raw data stream.
The data acquisition and handling system logs, time-stamps, and applies initial quality flags to raw analyzer output.
Data undergoes range checks, calibration drift review, and missing-data substitution per Part 75 procedures before it is considered report-ready.
Validated data is rolled up into the specific averaging periods, units, and formats each reporting program requires — hourly, quarterly, or annual.
The final report is assembled in the required submission format and filed through ECMPS, CDX, or the applicable state portal.
Major EPA Reporting Programs Power Plants Manage Concurrently
Most power plants are not filing under a single program — they are managing several concurrently, each with its own data requirements, averaging periods, and submission deadlines. Fragmented data systems make it hard to see all of these obligations in one place.
| Program | Governing Rule | Reporting Frequency | Primary Data Source |
|---|---|---|---|
| Acid Rain Program / CSAPR | 40 CFR Part 75 | Quarterly | CEMS hourly SO2, NOx, CO2, flow |
| Title V Operating Permit | 40 CFR Part 70 | Annual certification, semiannual monitoring | CEMS, CMS, and permit-specific parametric data |
| Greenhouse Gas Reporting Program | 40 CFR Part 98 | Annual | CO2, CH4, N2O emissions and fuel data |
| NSPS / MATS | 40 CFR Part 60 / Part 63 | Semiannual to annual | Particulate, mercury, HCl continuous or periodic monitoring |
Manual Reporting Workflow vs. Automated Reporting Workflow
| Workflow Stage | Manual Process | Automated Process |
|---|---|---|
| Data collection | Manual export from DAHS, transferred to spreadsheets | Direct, continuous integration from DAHS and historian systems |
| Data validation | Manual review against Part 75 substitution rules | Automated QA rules applied in real time as data arrives |
| Cross-program reconciliation | Separate spreadsheet per program, manually cross-checked | Single validated data layer feeding every program's report |
| Report assembly | Manual formatting to match ECMPS/CDX submission structure | Templated report generation aligned to each program's format |
| Deadline tracking | Calendar reminders and institutional knowledge | Automated deadline and submission-status tracking |
| Audit trail | Scattered across email, spreadsheets, and file shares | Centralized, timestamped record of every data touch point |
Data Quality Issues That Turn Into Audit Findings
Most emissions audit findings do not stem from actual excess emissions — they stem from how the reported data was assembled. These four issues account for a disproportionate share of the findings compliance teams end up defending.
Missing-Data Substitution Errors
Part 75 substitution procedures are precise about which value applies during a monitor outage — applying the wrong substitution method is one of the most common and most easily automated-away errors.
Undetected Calibration Drift
An analyzer drifting out of calibration between scheduled checks can quietly bias an entire reporting period if nothing is monitoring the drift continuously between calibrations.
Timestamp Misalignment
When CEMS, DAHS, and operational data sources run on slightly different clocks, hourly averages can be built from misaligned readings — a subtle error that is nearly impossible to catch by eye.
Unit Conversion Mistakes
Manually converting between ppm, lb/mmBtu, and mass-based units across multiple report formats introduces exactly the kind of error a validated, rules-based conversion layer eliminates.
What an Integrated Reporting Platform Actually Looks Like
Automated reporting is not a single tool bolted onto an existing DAHS — it is an integration layer that sits between your source systems and your submission format, built in four distinct layers.
Source System Connections
Direct connections into CEMS, DAHS, plant historians, and fuel-flow metering — pulling data continuously instead of through periodic manual export.
Validation and QA Engine
Automated application of Part 75 substitution logic, range checks, and calibration-drift flags as data arrives, rather than in a batch review before filing.
Cross-Program Data Model
One validated dataset structured to feed Part 75, Title V, GHGRP, and NSPS/MATS reporting simultaneously, instead of separate reconciliations for each program.
Report Generation and Submission Tracking
Templated report output matched to each program's required format, with deadline and submission-status tracking built into the same workflow.
A Compliance Team's Reporting Season, Before and After
Consider a composite two-unit coal plant managing Part 75, Title V, and GHGRP reporting with two environmental engineers on staff. Before integration, the quarterly Part 75 submission alone took roughly two to three days per engineer — exporting DAHS data, manually applying substitution rules, cross-checking against the prior quarter, and formatting the ECMPS submission file. Annual Title V and GHGRP season added another full week of overlapping, largely duplicate data assembly work across separate spreadsheets. After moving to an integrated reporting workflow, the same team reported that quarterly prep time dropped to roughly half a day of review rather than active data assembly, since the validated dataset already fed every program's report format. That freed time went toward the compliance analysis and process improvement work the environmental engineering role was actually intended for — not spreadsheet reconciliation.
Getting Started: A Practical Checklist
Inventory every EPA and state reporting program your plant currently files under, along with the source system each one draws from.
Map where manual data transfer currently happens between CEMS, DAHS, spreadsheets, and submission portals.
Identify which past audit findings or near-misses traced back to data assembly errors rather than actual emissions events.
Confirm which reporting formats — ECMPS, CDX, or state-specific portals — any integration needs to output directly.
Involve environmental compliance staff early, since they know exactly where the current process breaks down fastest.
Frequently Asked Questions: Automated Emissions Reporting
What is automated regulatory reporting for emissions?
Automated regulatory reporting connects CEMS analyzers, DAHS systems, and other emissions data sources directly into a validation and report-generation workflow, removing the manual export-reconcile-format cycle that consumes most of a compliance team's reporting time. Instead of assembling each EPA program's submission separately from raw exports, the platform maintains one validated dataset that feeds every applicable report format. This does not replace the environmental engineering judgment involved in compliance — it removes the repetitive data-handling work around it.
Which EPA programs can be automated in one platform?
The most common candidates are Part 75 Acid Rain Program and CSAPR quarterly filings, Title V annual certifications and semiannual monitoring reports, the Part 98 Greenhouse Gas Reporting Program, and NSPS or MATS periodic and continuous monitoring reports. Because these programs frequently draw from overlapping CEMS and DAHS data, a single validated data layer can feed report generation for all of them rather than requiring separate manual reconciliation per program. Teams managing several concurrent programs can Book a Demo to see how their specific program mix maps to one integrated workflow.
Does automated reporting replace the DAHS system already in place?
No — an automated reporting platform typically sits alongside and integrates with the existing DAHS rather than replacing it. The DAHS remains the certified system of record for raw CEMS data acquisition and initial quality flagging; the integration layer pulls that validated data forward into cross-program aggregation and report generation, closing the gap between DAHS output and a filed submission without disrupting the certified monitoring system itself.
How does automation reduce audit findings?
Most audit findings on emissions reports trace back to how the data was assembled, not to the underlying emissions themselves — missing-data substitution errors, undetected calibration drift, timestamp misalignment, and unit conversion mistakes made during manual transfer between systems. Automating validation rules and applying them consistently as data arrives, rather than during a rushed pre-filing review, removes most of the human transcription and formatting errors that generate these findings in the first place.
How long does it take to implement automated reporting?
Implementation timelines vary with how many source systems and reporting programs are in scope, but most plants can connect core CEMS and DAHS data sources and validate the first automated report cycle within a matter of weeks, then expand to additional programs and state-specific formats from there. Support contact iFactory Support can walk through a rollout timeline for a specific plant's program mix and data infrastructure.