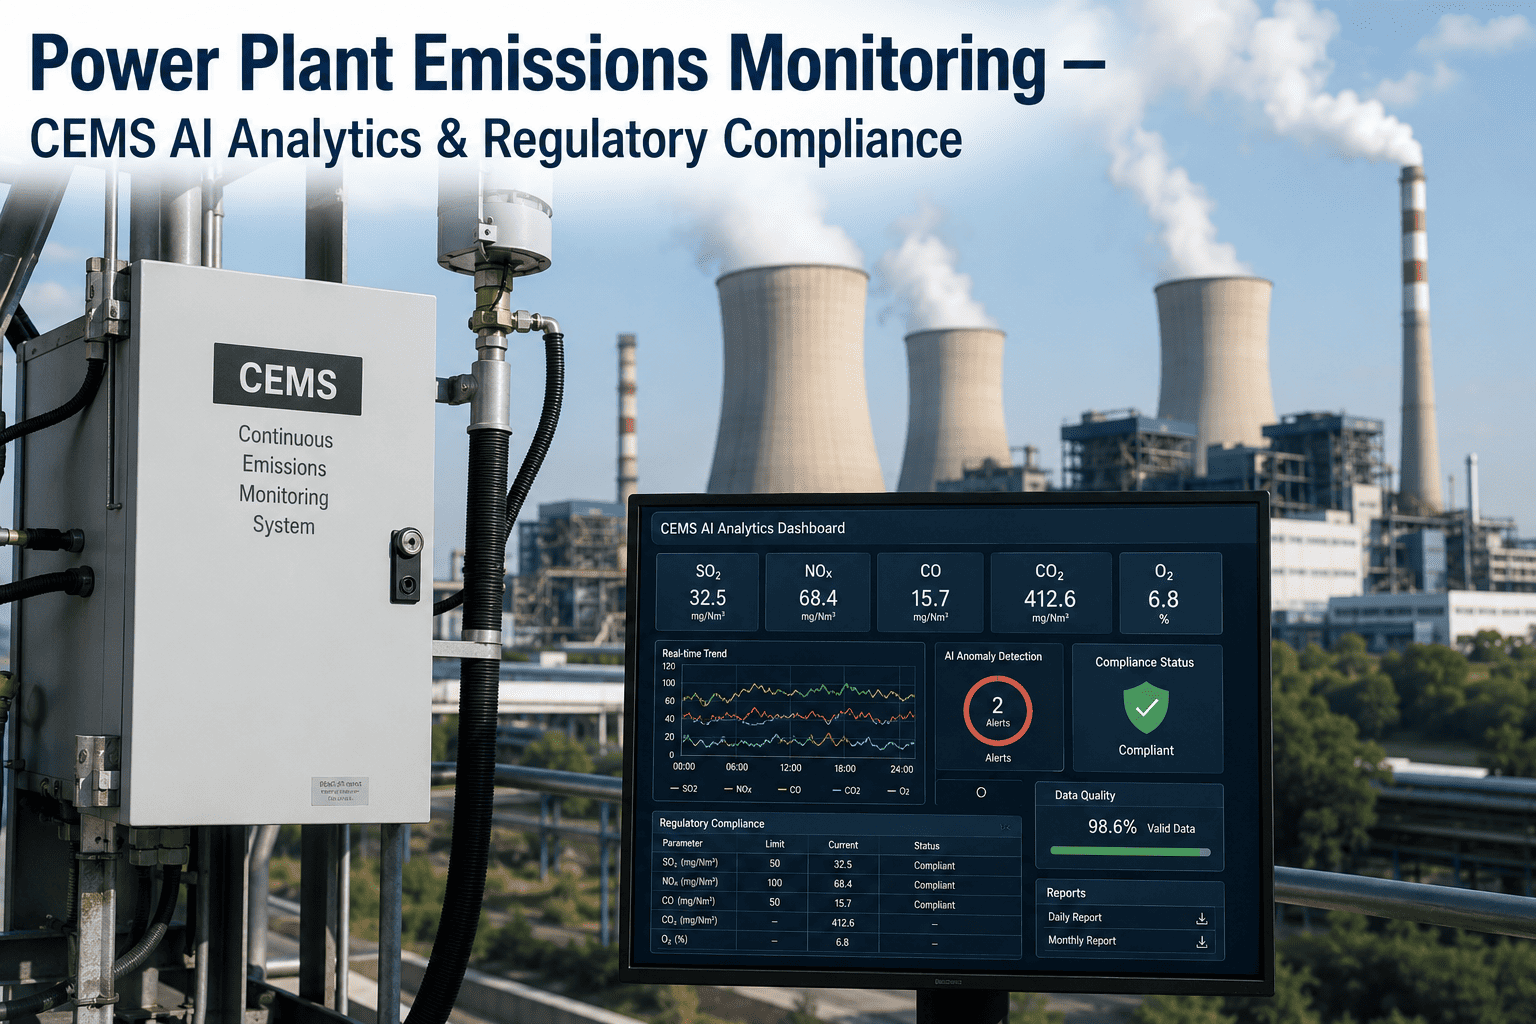
An emissions compliance program can look perfectly fine right up until a single stuck calibration valve or drifting analyzer turns a routine shift into an excess emissions report. Continuous Emissions Monitoring Systems already track NOx, SOx, CO, and particulate matter around the clock, but the raw data stream only helps if someone catches the drift, the gap, or the slow trend before it crosses a permit limit. AI-powered CEMS analytics sit on top of that existing monitoring hardware, watching analyzer health and pollutant trends continuously so EHS teams get a warning while there is still time to act instead of a violation notice after the fact. For EHS managers juggling EPA NESHAP, MATS, and state permit conditions across multiple units, that early-warning layer often makes the difference between a routine calibration and a reportable event, which is why more teams are choosing to walk through the compliance dashboard live.
CEMS AI ANALYTICS & COMPLIANCE
Catch Emissions Drift Before It Becomes a Violation
AI analytics layered on your existing CEMS continuously watch NOx, SOx, CO, and particulate readings alongside analyzer health, flagging drift and data gaps early enough to protect your permit and automate the reporting that follows.
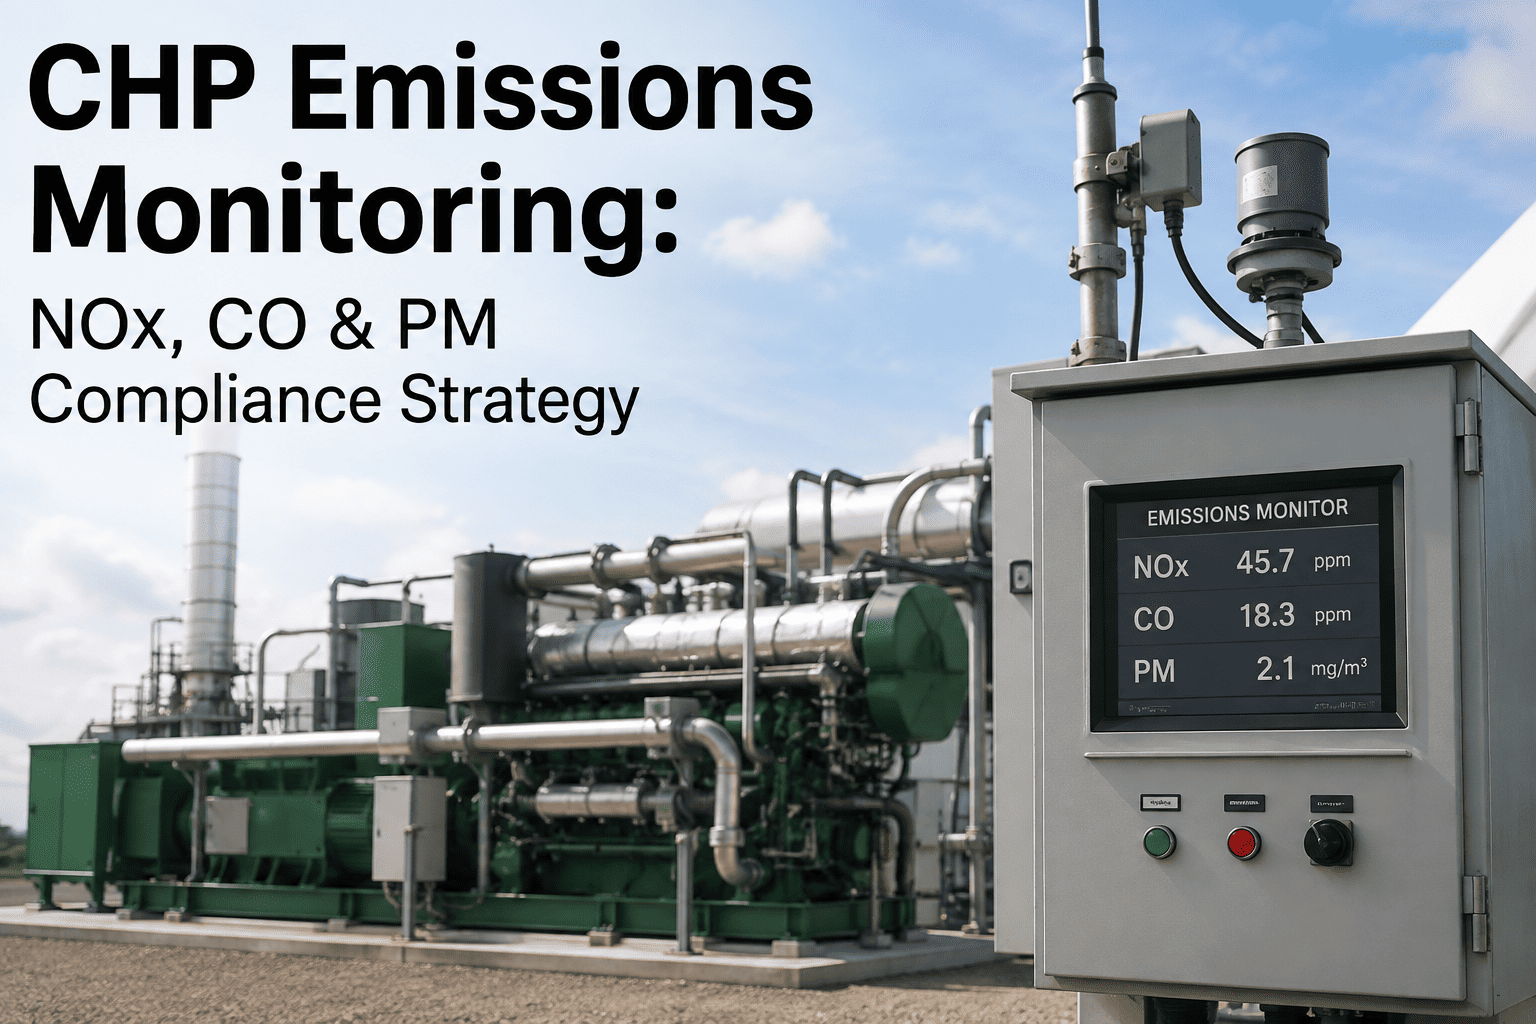
The Four Pollutants Every Coal and Gas Unit Tracks
Each regulated pollutant has its own control equipment, its own failure modes, and its own reporting obligation, which is why a single unified analytics layer matters more as the pollutant list grows.
NOx
Tracked continuously downstream of SCR or SNCR systems, with trend analysis catching reagent or catalyst issues before removal efficiency drops out of permit range.
SOx
Monitored at the FGD scrubber outlet, where slurry pH and recirculation pump performance are the most common causes of a slow upward drift.
CO
A sensitive early indicator of combustion inefficiency, often the first signal that burner tuning or fuel quality has shifted before other pollutants move.
Particulate Matter
Watched through opacity and PM-CEMS data, where mist eliminator blockage and ESP high-voltage faults are the usual root causes of a rising trend.
95% Availability
Minimum quarterly CEMS data availability required before substitute data procedures apply
4-Hour Gap
Data gap duration that can trigger an excess emissions report under most permit conditions
Quarterly RATA
Relative accuracy audit cadence for units carrying an elevated compliance risk profile
How a Small Drift Becomes a Reportable Exceedance
Most compliance failures do not start as dramatic events. They start small and grow quietly until nobody is watching closely enough to catch them in time.
1
An analyzer begins to drift out of calibration, a few percentage points at a time.
2
Readings trend upward slowly enough that a manual daily check does not flag it as unusual.
3
The trend crosses a rolling average threshold defined in the operating permit.
4
The deviation must now be reported, and repeated deviations on the same parameter draw escalating regulatory attention.
Manual CEMS Oversight vs AI-Powered Analytics
See Your Own Emissions Trends Modeled in Real Time
Walk through how drift detection and automated reporting would apply to your specific CEMS configuration and permit conditions.
What AI Analytics Add on Top of Your Existing CEMS
Predictive Drift Alerts
Analyzer and control equipment performance are trended continuously, surfacing slow drifts well before they approach a permit threshold.
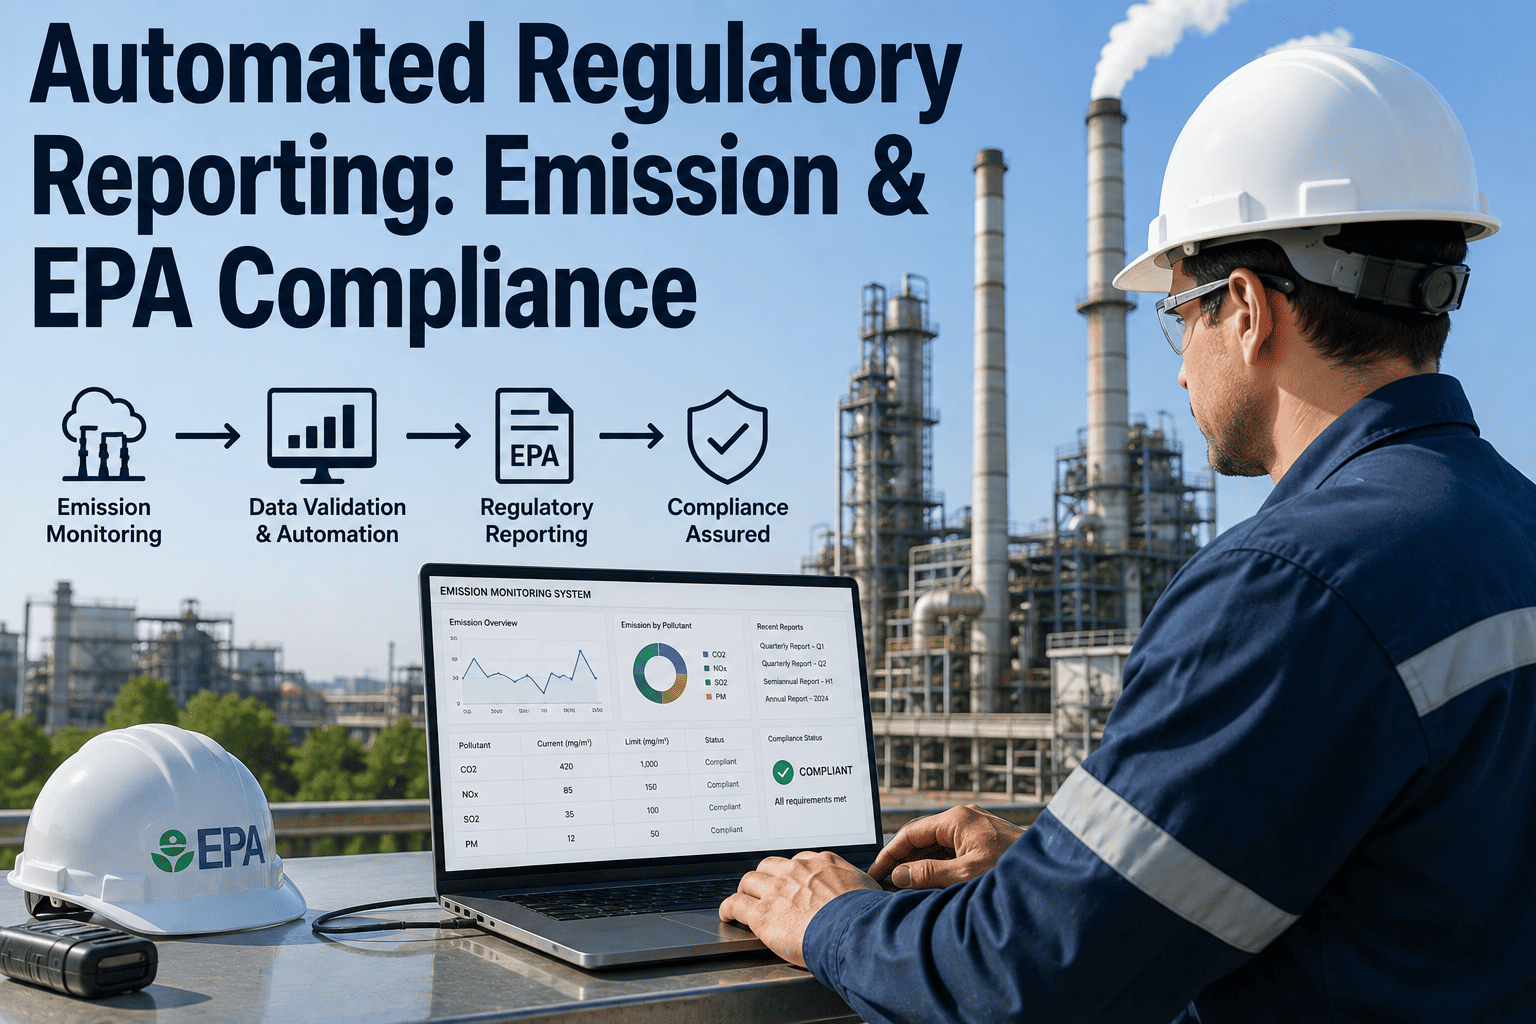
Automated Regulatory Reporting
Excess emissions reports and quarterly compliance summaries are drafted directly from validated CEMS data, cutting manual compilation time.
RATA and Calibration Scheduling
Relative accuracy audits and daily zero and span checks are scheduled automatically so deadlines are never missed under EPA 40 CFR Part 75.
Root Cause Linking
Emissions trends are connected back to the likely equipment cause, whether that is scrubber pH, catalyst activity, or ESP voltage.
Frequently Asked Questions
PROTECT YOUR PERMIT BEFORE THE NUMBERS DRIFT
Turn Your CEMS Data Into an Early Warning System
See how AI analytics can catch drift, automate reporting, and keep every regulated pollutant inside its permit limit.