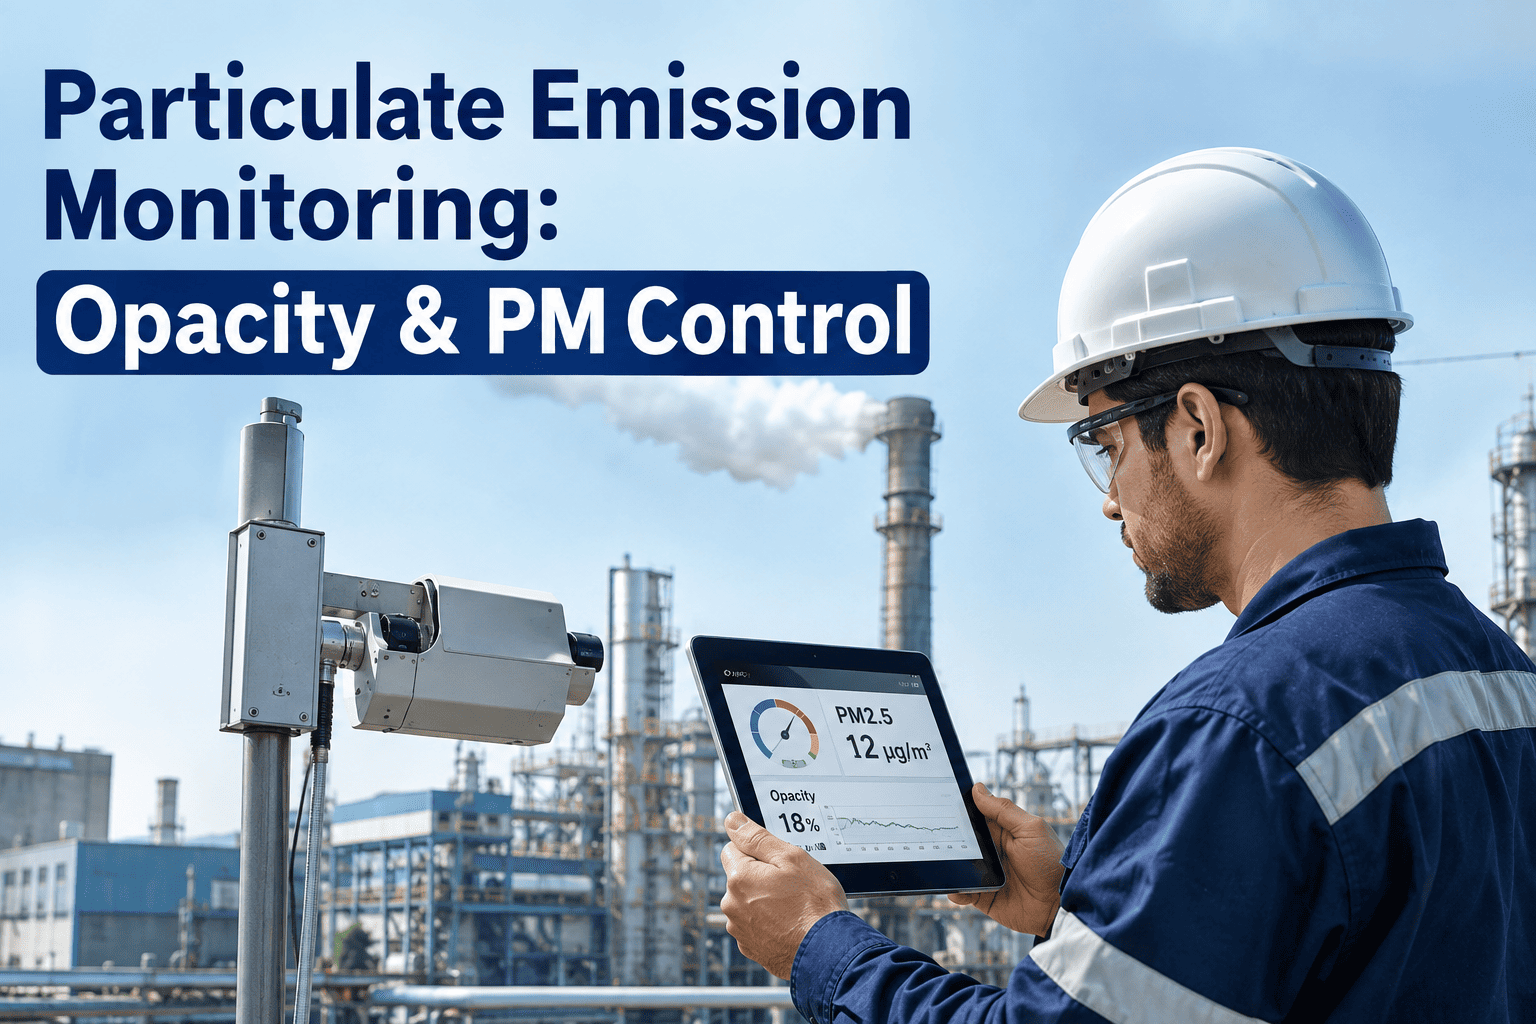
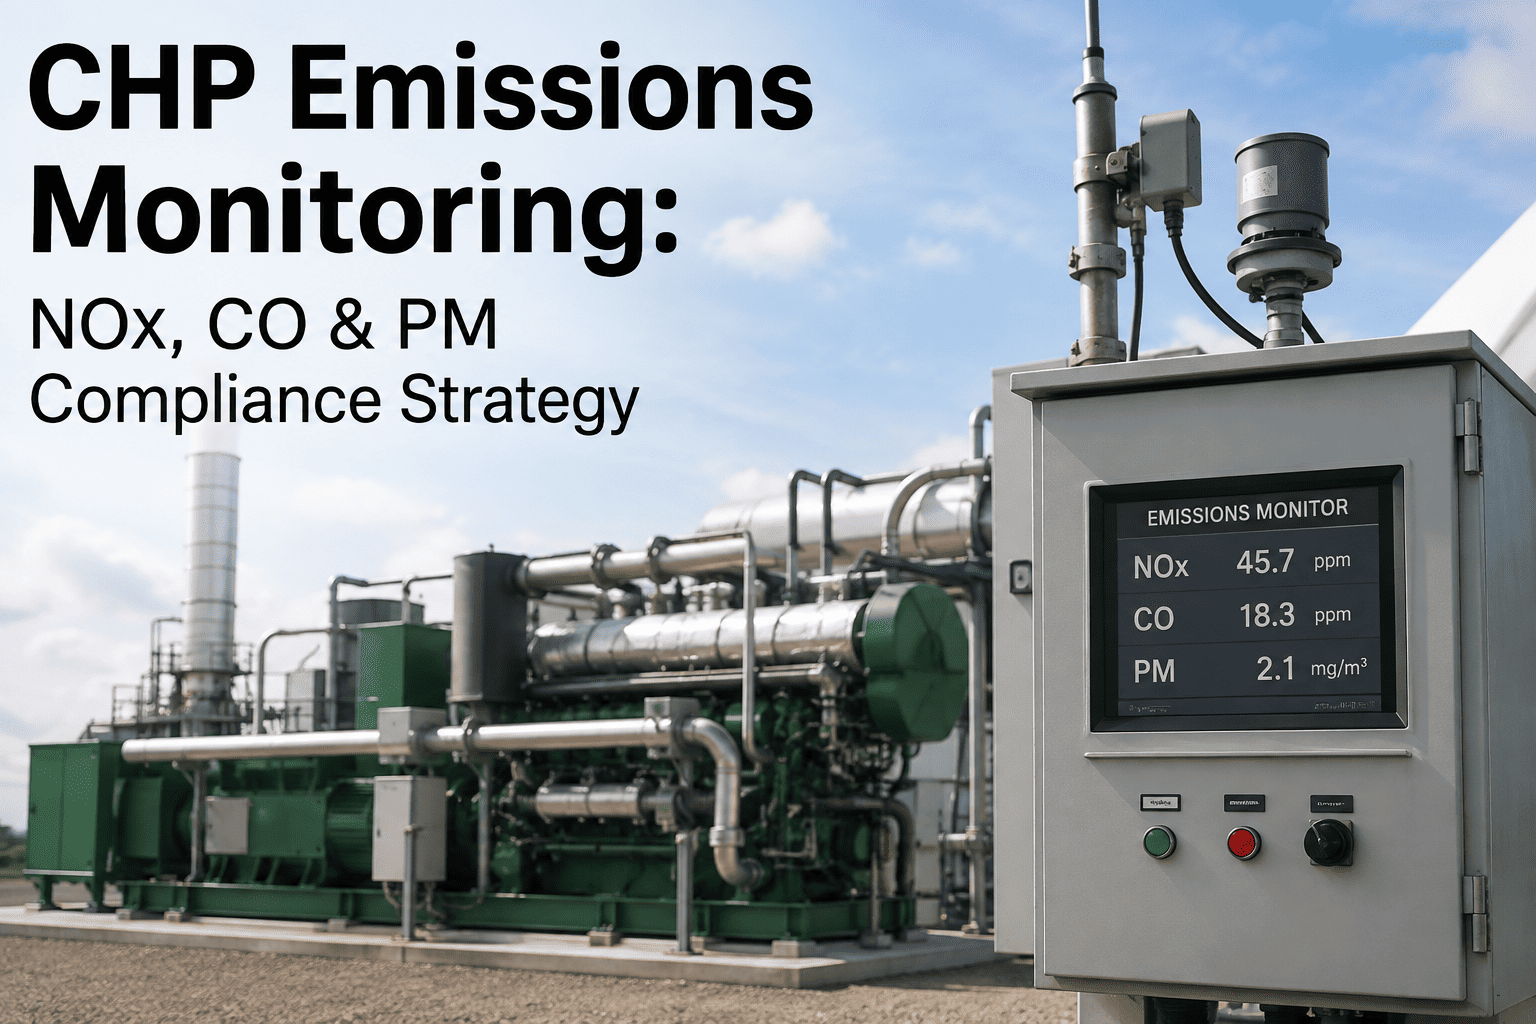
A baghouse compartment with a torn filter bag or an electrostatic precipitator running with a misaligned discharge electrode does not announce itself — the stack keeps venting, the control room keeps showing normal load, and the first real evidence of a problem often arrives as a visible opacity excursion or a failed quarterly stack test, by which point the plant is already looking at a reportable exceedance. Particulate control equipment degrades quietly, and periodic compliance testing was never designed to catch that degradation while it is still small enough to fix on a scheduled maintenance window. Continuous opacity and PM monitoring closes that gap by watching particulate performance in real time rather than waiting for the next test date, a shift covered in more detail at ifactory.
Emissions & Environmental · Particulate Control
Particulate Emission Monitoring: Opacity and PM Control That Catches Drift Before It Becomes an Exceedance
Continuous opacity monitors and PM CEMS paired with baghouse and ESP performance data turn particulate compliance from a quarterly stack test gamble into a real-time view of exactly how close the stack is running to its emission limit, every hour of every day.
The Compliance Gap
Why Periodic Stack Testing Misses the Drift That Actually Causes Exceedances
Most particulate compliance programs are still built around scheduled stack testing — a snapshot of performance captured once a quarter or once a year, under conditions chosen to be as representative as possible of normal operation. The problem is that particulate control equipment does not fail on a schedule. A bag failure, a rapping system malfunction, or an ESP field going out of service can happen the week after a clean test result, and the plant has no way of knowing performance has degraded until the stack visibly opacifies or the next scheduled test catches it months later.
1–4
Stack tests most plants run per year
Quarterly or annual testing captures a snapshot of performance, leaving long windows where degradation can develop and go completely undetected.
0
Real-time visibility a periodic test provides
A passed stack test says nothing about how the baghouse or ESP is performing the day after the test crew leaves the site.
Minutes
How quickly a bag failure can shift stack opacity
A single torn filter bag or arc-damaged ESP field can move opacity readings measurably within minutes, long before it would ever be caught at the next scheduled test.
24/7
Coverage a continuous monitor provides instead
Opacity monitors and PM CEMS watch the stack continuously, correlating every reading against baghouse and ESP operating data as it happens.
Monitoring Technology Types
Four Layers of Particulate Visibility, From the Stack to the Collector
Effective particulate monitoring is rarely a single instrument — it is a set of complementary measurements that together answer both "what is leaving the stack right now" and "why." Each layer below plays a distinct role, and the combination is what turns a compliance number into a diagnosable, actionable signal.
Continuous Opacity Monitors (COMS)
Optical instruments measure light attenuation across the stack in real time, providing the direct visible-emission reading regulators reference and the fastest early signal of a developing particulate problem.
PM Continuous Emission Monitoring Systems
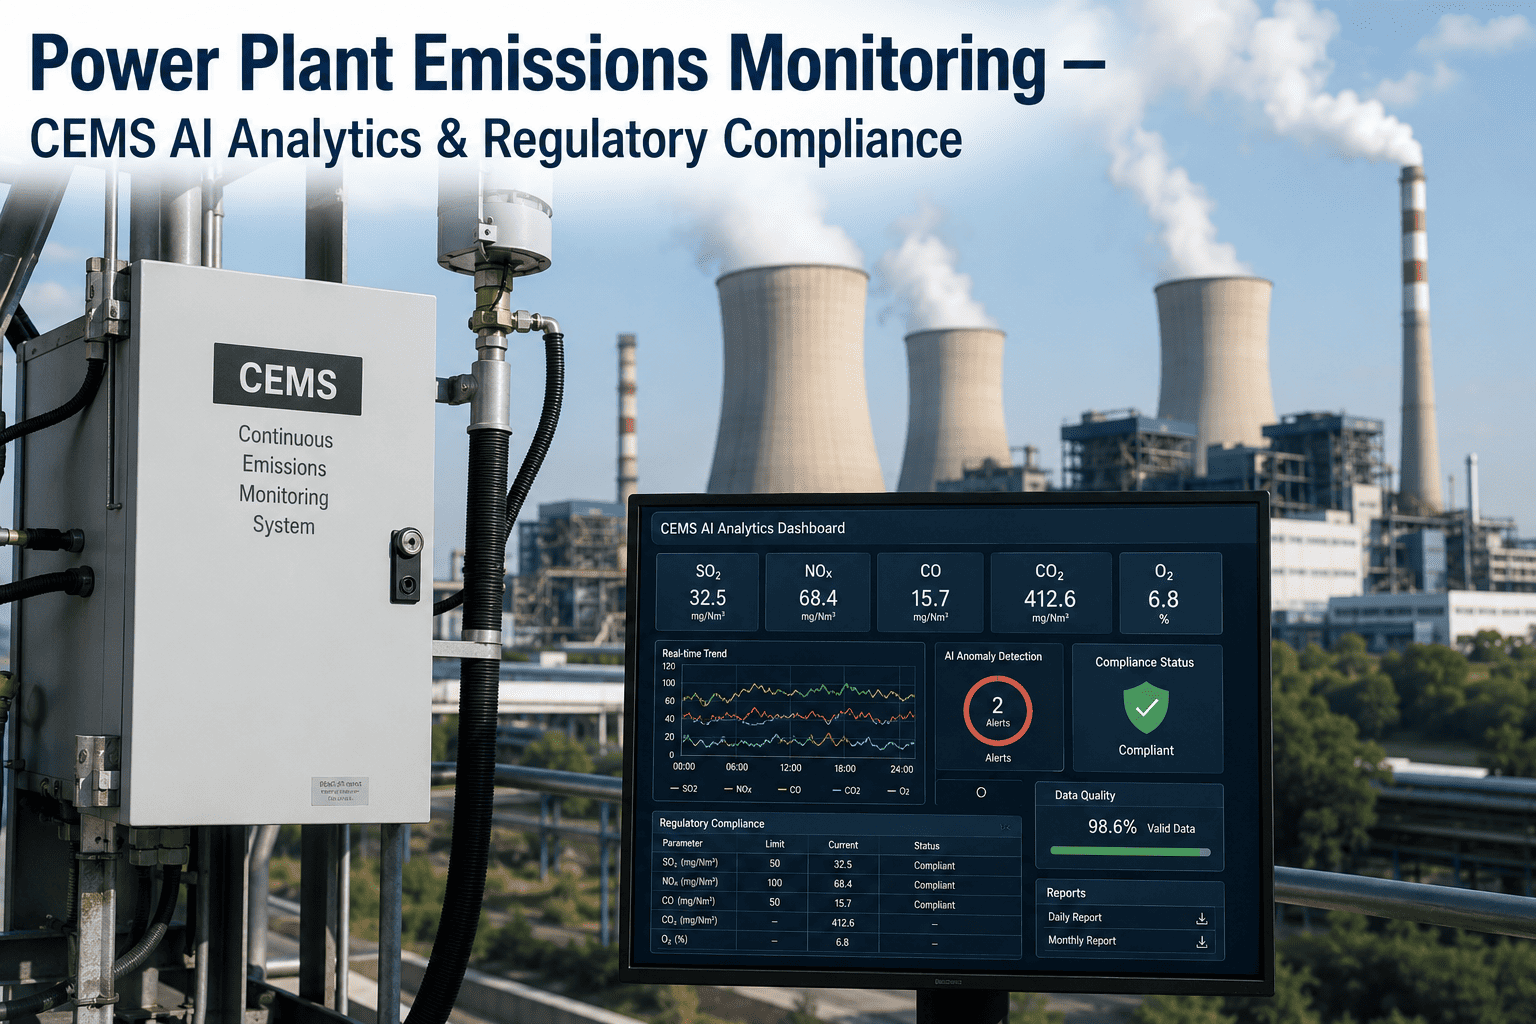
PM CEMS provide a continuous mass concentration estimate rather than an optical proxy, giving a more direct read on actual particulate loading and supporting compliance demonstration where opacity alone is insufficient.
Baghouse Performance Monitoring
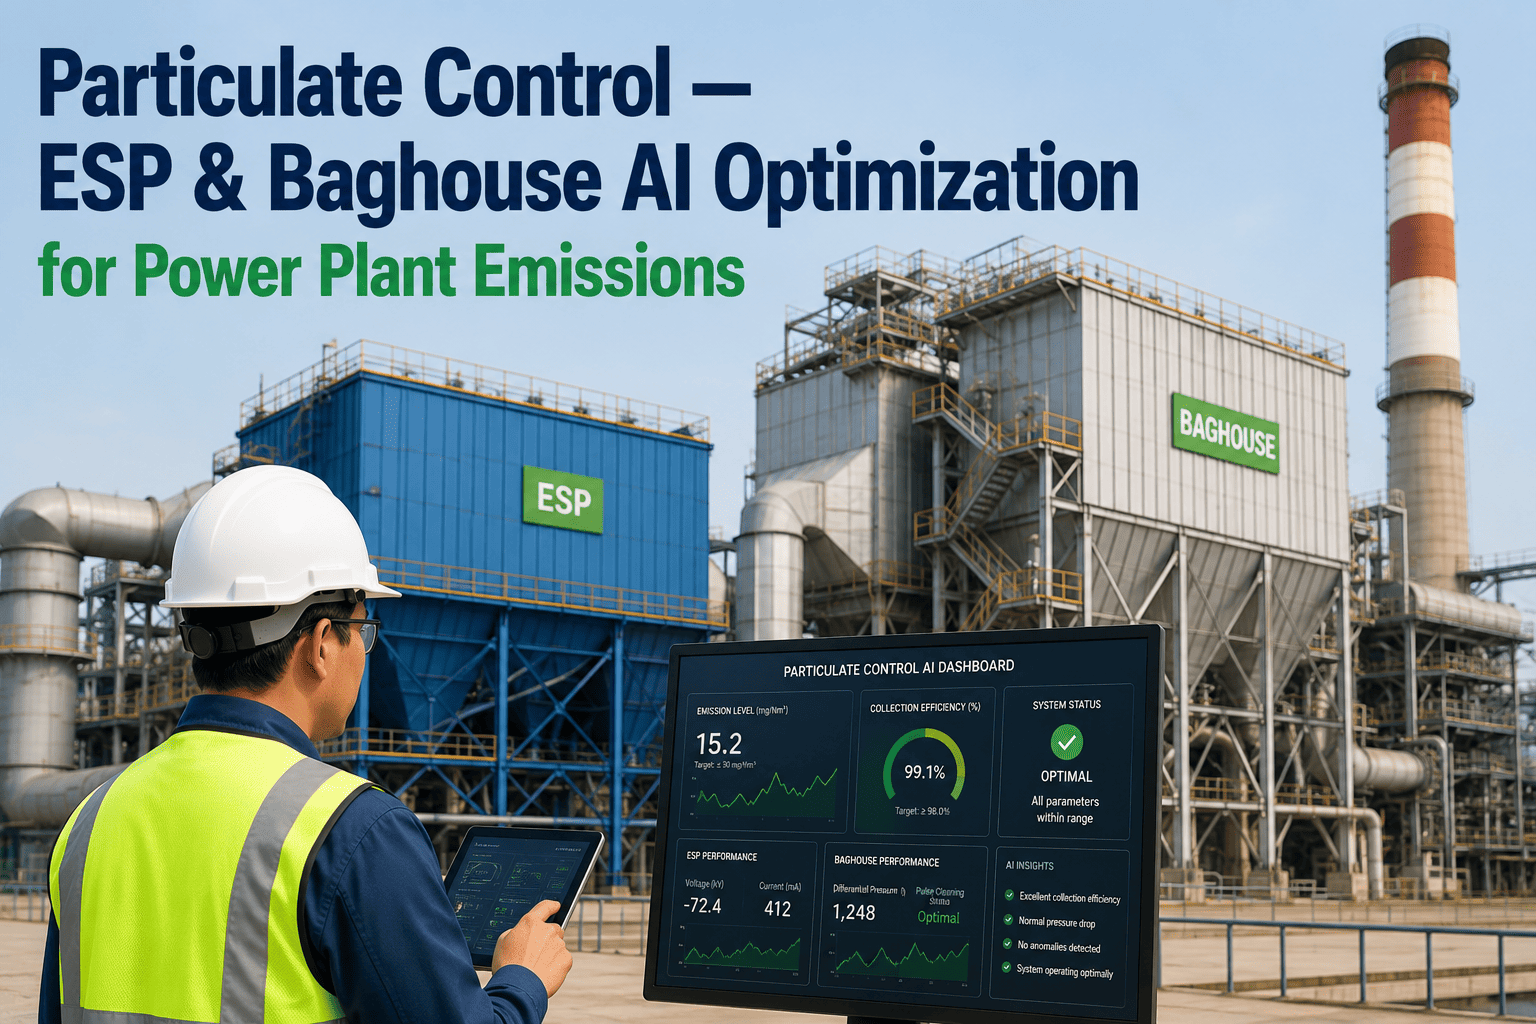
Differential pressure, compartment cycling, and bleed-through detection reveal which compartment or bag row is degrading, connecting a stack-level reading back to a specific, fixable location in the collector.
ESP Performance Monitoring
Field-level voltage, current, and spark rate data show which electrostatic precipitator field is underperforming, distinguishing a rapping or alignment issue from a broader upset affecting the whole unit.
What the Monitoring Program Actually Does
Four Capabilities That Turn Readings Into Prevented Exceedances
Instrumentation alone does not prevent an exceedance — a stack full of sensors that nobody is watching in context is no better than a quarterly test that already happened. The value comes from combining continuous readings with correlation, trending, and alerting logic that turns a raw signal into a decision an operator can act on before a limit is crossed.
A
Continuous Opacity and PM Reading
Opacity and PM CEMS values are captured continuously rather than during a scheduled window, so the plant has a real answer to "what is our particulate level right now" at any moment, not just on test day.
B
Baghouse and ESP Correlation
Stack readings are correlated against differential pressure, compartment cycling, and field-level ESP data, so a rising trend at the stack is immediately traceable back to the specific collector zone driving it.
C
Trend Detection Against Emission Limits
Every reading is tracked against the applicable permit limit with a configurable margin, surfacing a value trending toward the limit well before it actually crosses it.
D
Alert Escalation and Corrective Response
A confirmed trend routes an alert to the responsible role with the correlated collector data attached, so the response starts with a likely cause rather than a blind investigation.
Setting Up the Program
Building a Continuous Particulate Monitoring Program in Four Stages
Moving from periodic stack testing to a continuous, correlated monitoring program follows a defined sequence, applied consistently across each stack and collector so the resulting alerting logic is grounded in your plant's actual baseline rather than a generic default.
Stage 1
Baseline Correlation
Historical stack test results, opacity readings, and collector operating data are analyzed together to establish what normal correlation looks like for that specific unit.
Stage 2
Threshold Configuration
Warning and action thresholds are set against the applicable permit limit, with margin sized to give operators real time to respond before an actual exceedance.
Stage 3
Continuous Monitoring
Opacity, PM CEMS, and collector data stream continuously into the platform, updating trend charts and running against configured thresholds in real time.
Stage 4
Corrective Action Workflow
A confirmed alert routes into a tracked corrective action, closing the loop from detection through resolution and into the compliance record.
See Particulate Performance Before It Becomes an Exceedance
Every Reading Continuous. Every Excursion Correlated. Every Root Cause Traceable.
iFactory brings opacity, PM CEMS, baghouse, and ESP data together in one place, so a rising trend is caught and diagnosed hours or days before it turns into a reportable exceedance.
From Stack Reading to Corrective Action
What Happens Between "Opacity Rising" and "Issue Resolved"
01
Continuous Reading Capture
Opacity and PM CEMS values are logged continuously alongside baghouse and ESP operating parameters, building a single time-aligned dataset.
02
Cross-System Correlation
Rising stack readings are automatically checked against collector data to identify which compartment, bag row, or ESP field is most likely driving the change.
03
Trend Analysis Against Limits
The trend is evaluated against the configured warning and action thresholds tied to the applicable permit limit for that stack.
04
Threshold Breach Detection
A confirmed breach of the warning threshold triggers an alert before the value reaches the actual permitted limit, preserving response time.
05
Alert Escalation With Root Cause Context
The alert reaches the responsible operator or environmental role with the correlated collector data attached, so the likely cause is already identified.
06
Compliance Record and Audit Trail
Every reading, alert, and corrective action is written to a timestamped, auditable record supporting excess emission reporting and permit compliance demonstration.
Periodic Testing vs Continuous Monitoring
What Changes When Particulate Compliance Moves to Real Time
Periodic stack testing remains a required part of most permit programs and is not going away — what changes with continuous monitoring is everything that happens in the months between those scheduled tests, where degradation used to go completely unseen.
| Compliance Factor | Periodic Stack Testing Alone | Continuous Opacity & PM Monitoring |
| Detection frequency |
Once a quarter or once a year |
Continuous, updated in real time |
| Root cause visibility |
Test result alone, no collector correlation |
Correlated directly to baghouse or ESP data |
| Time to detect degradation |
Up to months, until the next scheduled test |
Minutes to hours from onset |
| Exceedance risk |
Discovered after the fact, often reportable |
Flagged before the limit is crossed |
| Audit evidence |
Sparse, test-day snapshots only |
Continuous, timestamped record across every reading |
Regulatory Alignment
Where Continuous Monitoring Fits Under EPA and Permit Requirements
Particulate monitoring programs sit inside a well-established regulatory structure, and continuous monitoring is increasingly treated as the strongest available evidence of ongoing compliance rather than a supplement sitting outside that structure. Understanding where each framework applies helps a plant justify investment in continuous monitoring against its existing testing obligations rather than as a replacement for them.
EPA Method 9
Visible emission observation requirements are directly supported by continuous opacity data, giving a documented, instrument-based record alongside or in place of periodic visual readings.
EPA Method 5
Reference method stack testing for particulate mass remains the compliance benchmark, and continuous monitoring data strengthens the case that conditions during that test were representative of normal operation.
NSPS and MACT Standards
New Source Performance Standards and MACT particulate limits increasingly expect continuous parametric monitoring of control equipment as part of demonstrating ongoing compliance between stack tests.
Title V Permit Reporting
Continuous, timestamped monitoring records simplify excess emission reporting and deviation documentation required under Title V operating permits, reducing the manual reconstruction burden during an audit.
Common Questions
Frequently Asked Questions
Does continuous opacity and PM monitoring replace our required stack testing?
No — reference method stack testing under Method 5 or 9 remains a required compliance activity under most permits, and continuous monitoring is designed to complement rather than replace it. What continuous monitoring changes is visibility in the months between those scheduled tests, catching degradation while it can still be corrected on a planned maintenance window instead of discovered as a failed result. Most sites find continuous data also strengthens the credibility of their periodic test results, since it demonstrates the equipment was operating normally in the lead-up to the test. Details on how the two programs fit together are covered at
ifactoryapp.com/support.
Can this work with the opacity monitors and PM CEMS we already have installed?
Yes — the platform is built to pull data from existing continuous opacity monitors and PM CEMS instrumentation rather than requiring new hardware, correlating those readings against baghouse and ESP operating parameters already available from the plant's control system. Where a plant does not yet have PM CEMS installed, opacity monitoring and collector performance data alone still provide meaningful early-warning coverage while a broader instrumentation upgrade is evaluated separately.
How does the system know whether rising opacity is a baghouse issue or an ESP issue?
Correlation logic compares the timing and pattern of the stack-level change against compartment-level baghouse data or field-level ESP data collected in parallel, matching the specific signature of a bag failure, a rapping malfunction, or a degraded electrostatic field against known patterns from that unit's own history. This narrows the investigation from an entire collector down to a specific compartment or field before anyone walks the unit, saving diagnostic time during a response.
What kind of records does this produce for excess emission reporting?
Every continuous reading, threshold breach, alert, and corrective action taken is written to a timestamped, auditable record designed to support excess emission and deviation reporting requirements under Title V and applicable New Source Performance Standards. This reduces the manual work of reconstructing what happened around an exceedance event after the fact, since the correlated collector data explaining the likely cause is already attached to the record.
How long does it take to get a continuous particulate monitoring program running?
Most first deployments move from initial data integration to live threshold monitoring within a few weeks, since the work centers on connecting existing opacity, PM CEMS, and collector instrumentation rather than installing new sensors. Establishing an accurate baseline correlation for each stack typically continues in parallel using recent historical data, refining thresholds as live readings accumulate.
Book a demo to scope a realistic timeline for your specific stacks and permit limits.
Catch Particulate Drift Before It Reaches the Limit
Turn Quarterly Stack Tests Into Continuous, Correlated Visibility
iFactory brings opacity, PM CEMS, baghouse, and ESP data into one continuous view, flagging drift toward your emission limit early enough to fix it before it becomes a reportable exceedance.