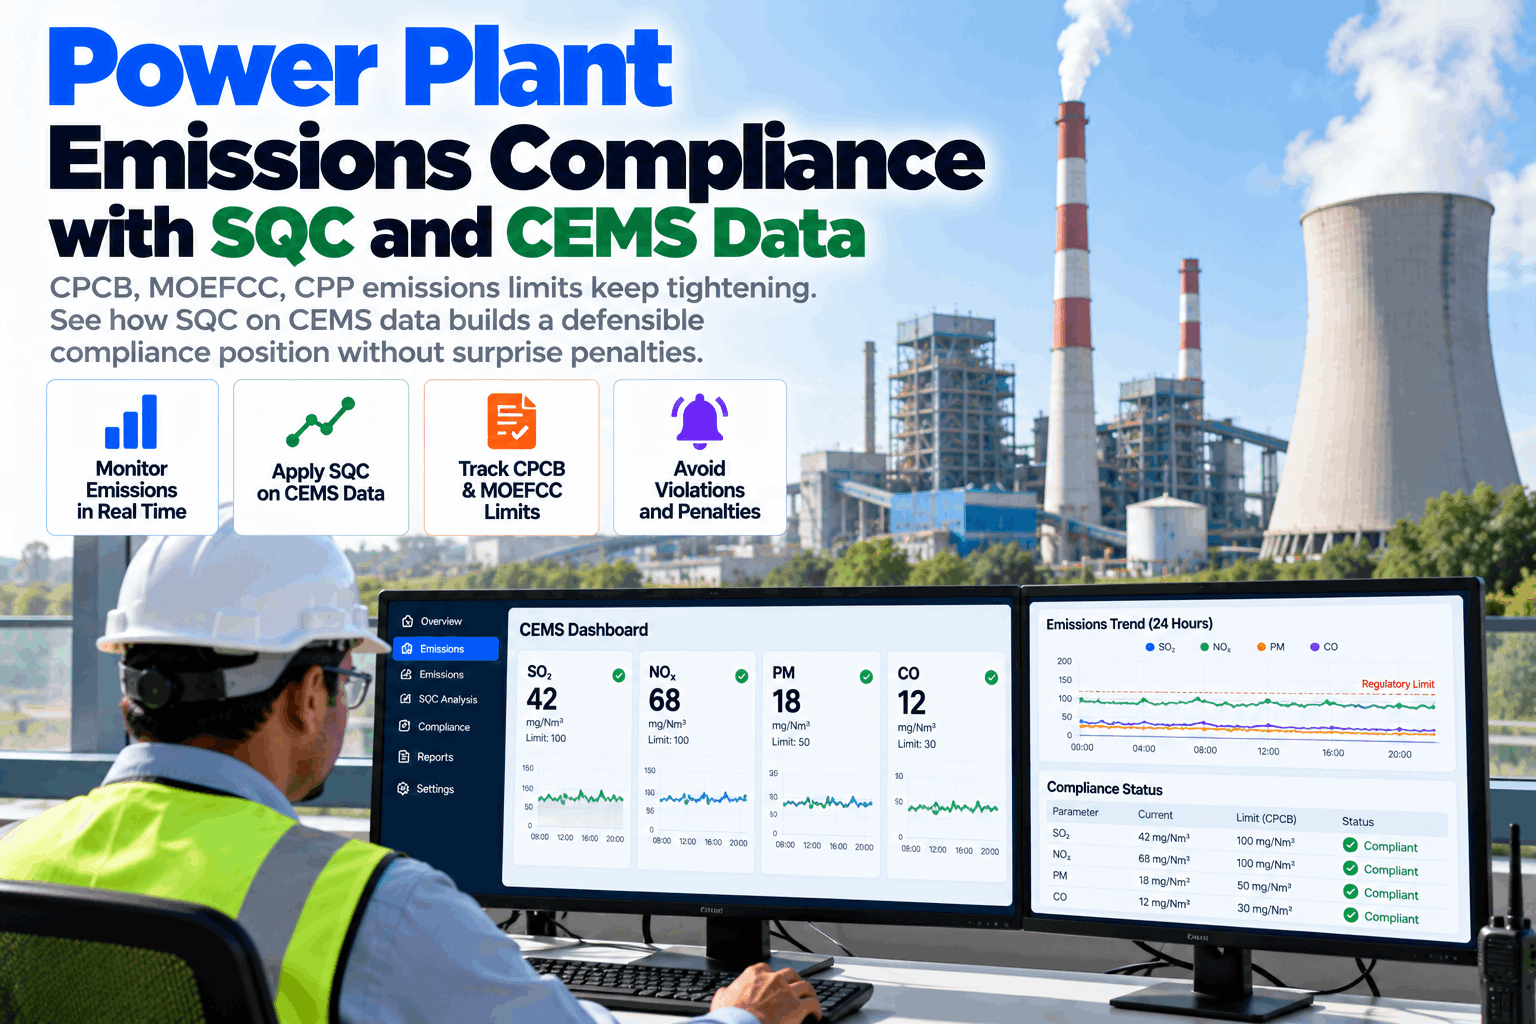
Emission limits for coal-based power plants in India have tightened in steps since the 2015 notification, and the compliance dates have moved more than once. What has not moved is the way the regulator sees your plant: stack analyzers send 15-minute values to the pollution control boards, so the board sees what you see, at the same moment. A monthly average under the limit is no longer the whole story. The questions that cost plants money are how close the worst readings came, whether the analyzers can be trusted, and whether a gap in the data can be explained. This guide shows how statistical quality control on CEMS data answers them for the quality and chemistry team. To see how your own stack data looks, book a compliance data review.
Power Plant Emissions Compliance: Use SQC on CEMS Data to Know Your Margin Before the Regulator Does
iFactory reads CEMS and plant data, draws control charts for every stack parameter, tracks analyzer drift and data availability, and records a likely cause beside every excursion. Reporting to the regulator stays with your own OCEMS channel, and nothing is written to the analyzers or the control system.
- Control charts on every CEMS parameter
- Analyzer drift and data availability tracked daily
- Excursion records with likely cause
Why a Mean Under the Limit Is Not a Compliance Position
A compliance position has two halves. The first is whether emissions stay inside the limit. The second is whether you can show the readings are sound, complete and explained. Plants that lose the second half are the ones that meet a penalty notice with a monthly average and no record behind it. Our environment and quality specialists can review a month of your CEMS records against both halves.
Tails hide behind averages
Daily and monthly means look safe while single 15-minute readings spike. The spikes are what the regulator's portal can see.
Analyzers drift
A reading can be wrong in either direction. Without zero and span trends, no one knows whether a low number is clean flue gas or a drifting cell.
Gaps in the record
Power cuts, link failures and calibration windows leave holes. Each one needs a time, a cause and a fix on file.
Excursions follow operations
Mill changes, low-load running, start-ups, a failed ESP field or a dip in scrubber slurry quality each leave a mark on the stack. The link is rarely written down.
Limits and dates keep changing
Limits depend on the unit's age, size and location, and the schedule has been amended. A sheet kept by one person goes out of date quietly.
Reports built by hand
Monthly figures pulled from exports and pasted into a sheet take days and can be challenged line by line.
The Limits Your Team Is Charting Against
The Environment (Protection) Amendment Rules notified on 7 December 2015 set emission limits for coal and lignite plants by the age and size of the unit. The table shows those original values. Later amendments changed some of them, for example a NOx limit of 450 mg/Nm3 for units installed from 2004 to 2016, and the SO2 dates have been extended and revised again since, with different treatment for the three location categories. Treat the table as the structure, and confirm the notification and consent conditions that apply to each unit before setting chart limits. To map your units, book a limits mapping session.
Build a Compliance Position for One Stack in Six Weeks
Choose one unit. We connect its CEMS and process signals, chart every stack parameter for the last three months, check analyzer drift and data availability, and show the team where the margin is thin.
Five Charts That Make the Position Defensible
Statistical quality control comes from the factory floor, where it is used to tell a process that has shifted from one that is only noisy. A stack is a process like any other, and the same few charts work on it. Each chart answers one question the team will be asked.
How the Margin Is Built, in Three Steps
The order matters. A chart is only as good as the readings behind it, so the data record comes first, and the cause analysis comes last.
Make the data record sound
Check clock accuracy, availability, calibration dates and zero and span results for every analyzer. Gaps get a cause and a fix. Where the PM analyzer is calibrated against manual stack sampling, chart the difference between the two so the next calibration is planned, not forced.
Chart each parameter and set internal limits
Put every stack parameter on a control chart and agree internal action limits below the permit limit, for example at 90% of it. A reading above the action limit is a prompt to look, so the permit limit stays a line that is never reached.
Tie each signal to an operating cause
Every chart signal is matched with what the plant was doing: load, mill combination, ESP field status, scrubber slurry quality or reagent flow. After a few months the plant has a record of which operating states cost margin, and the team can plan around them.
A Signal, a Cause and a Record
The record below is the kind of entry that turns an excursion from a surprise into a documented event. The rules beside it are the usual ones for deciding when a chart is signalling and not just moving.
What the AI Adds for the Quality and Chemistry Team
The charts need to be drawn every 15 minutes and every analyzer needs checking every day, which is where the time goes in a manual process. iFactory's models run on a GPU server inside the plant and read CEMS values together with load, mill, ESP and scrubber data, so nothing leaves the station.
- Charts for every parameter. Each stack parameter is charted live against its action limit and permit limit.
- Analyzer health. Drift, availability and gaps are tracked per analyzer, with a due date for the next check.
- Cause matching. Each signal is placed beside the operating state at the time, so the likely cause is on file.
- Questions in plain language. The team asks what changed and gets the data, not another export.
Frequently Asked Questions
What is SQC in emissions compliance?
Statistical quality control uses control charts and capability measures to separate real shifts in a process from ordinary variation. Applied to CEMS data, it shows how much margin each parameter has against its limit and flags a change early. It also charts the analyzers themselves, so the readings can be defended.
Does SQC replace our CEMS or the data we send to the regulator?
No. Your analyzers, calibration routines and data submission to the pollution control boards stay as they are. SQC sits beside them and reads the same data to tell the plant what the regulator's portal is likely to see.
Which limits apply to our plant?
They depend on the unit's installation date, its size and, for SO2 compliance dates, its location category, and they have been amended since 2015. Your consent conditions and the current notification decide. We map each unit to its limits at the start of the pilot and your team confirms them.
Does this prevent penalties?
It cannot promise that. The plant remains responsible for its emissions and its reporting. What SQC gives you is early warning of drift toward a limit, a clean record of analyzer health and data gaps, and a documented cause for each excursion, which are the things a notice usually asks for.
How long does deployment take, and what do we need to provide?
A typical unit is live in 6 to 12 weeks. You provide rack space, power, an Ethernet connection, read access to the CEMS data and relevant plant signals, your consent conditions, and a quality or chemistry contact for the pilot. iFactory supplies the pre-configured NVIDIA AI server, software, integration and training. To scope your station, contact our project team.
Know Your Margin Before the Notice Arrives
One turnkey system, with an NVIDIA AI server, CEMS analytics, integration and training, delivered and live inside 12 weeks. Start with the stack where the readings sit closest to the limit.
- 1Share of valid 15-minute readings for each stack parameter
- 2Mean and standard deviation of each parameter against its limit
- 3Highest 15-minute reading as a share of the limit
- 4Latest zero and span result for each analyzer
- 5Excursions with a recorded cause