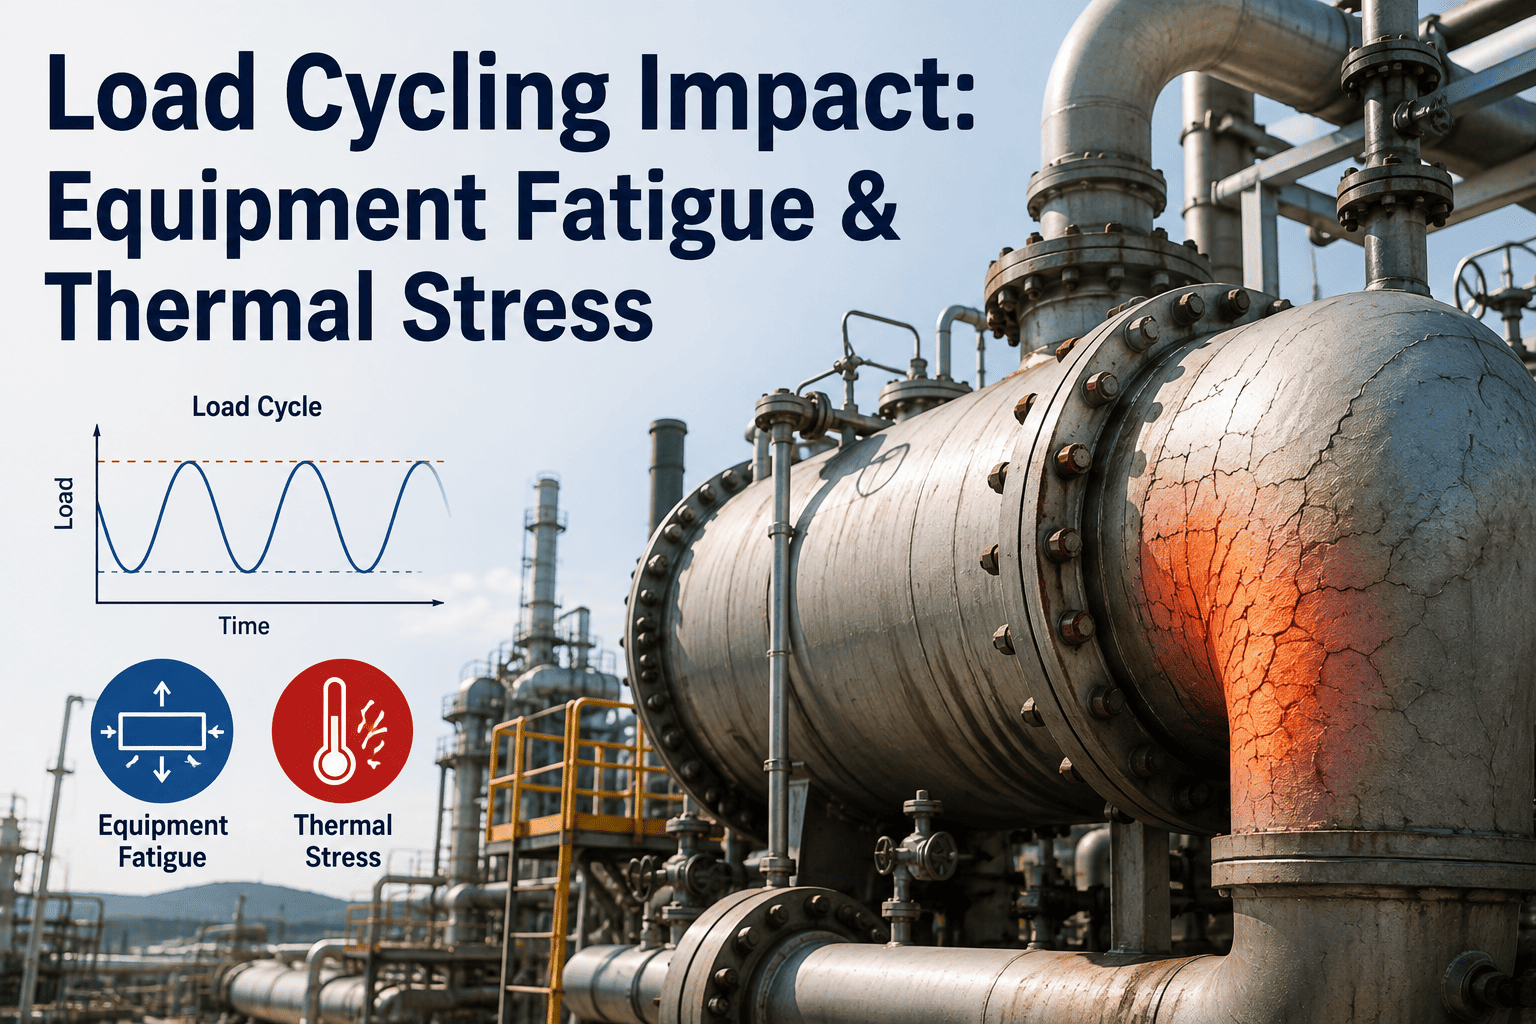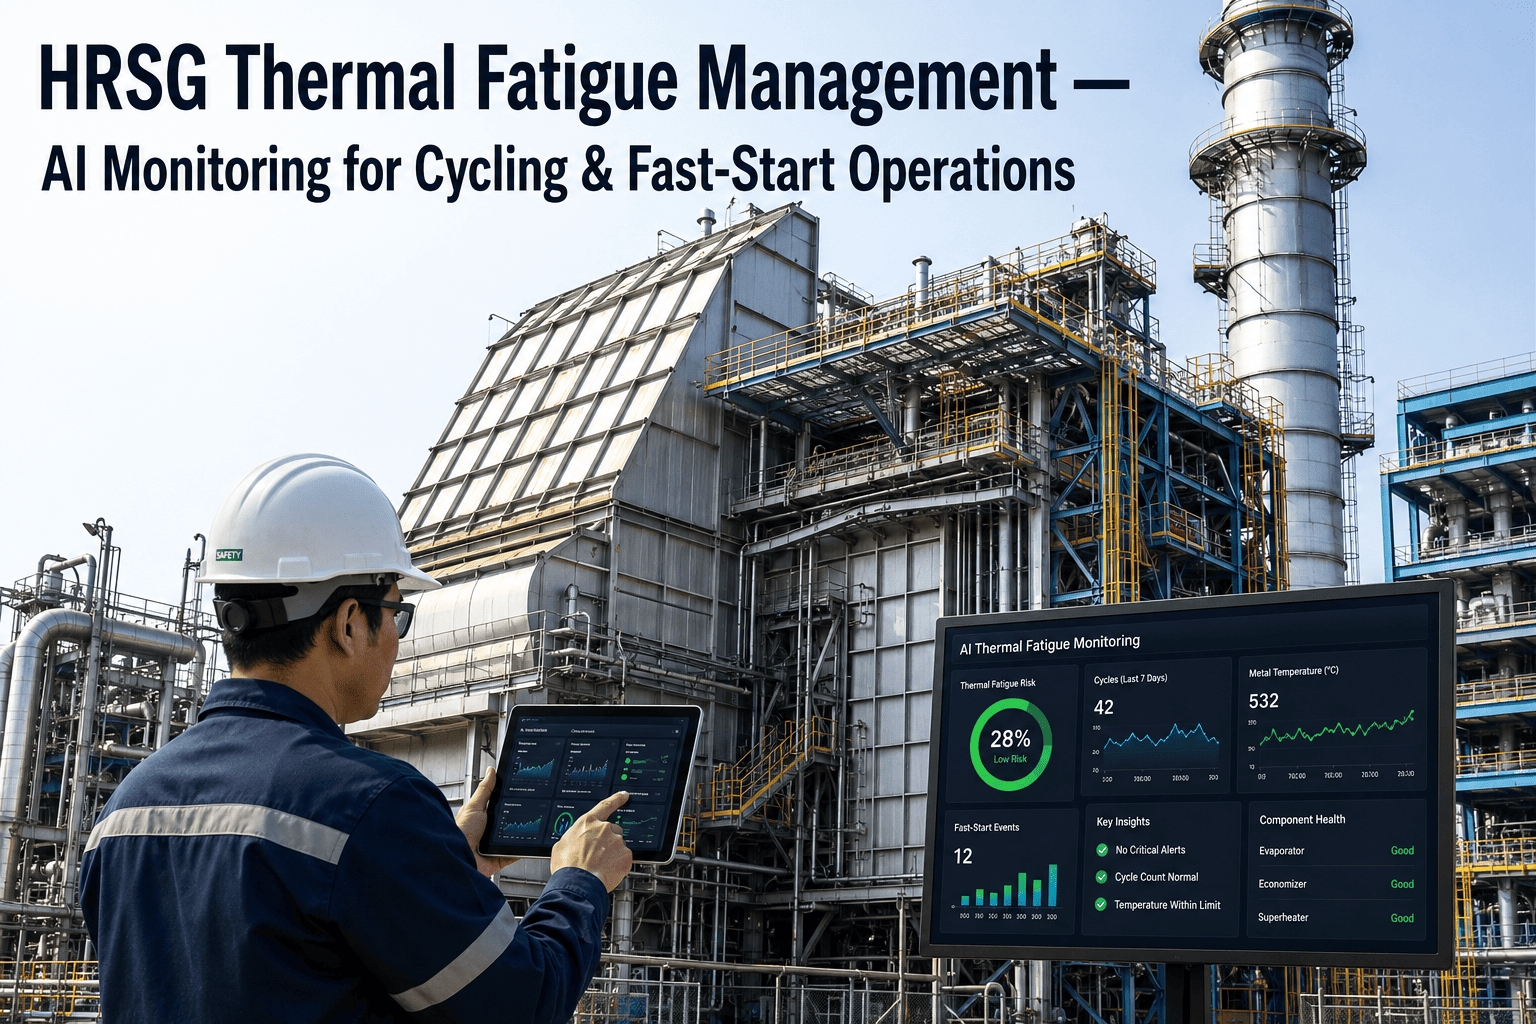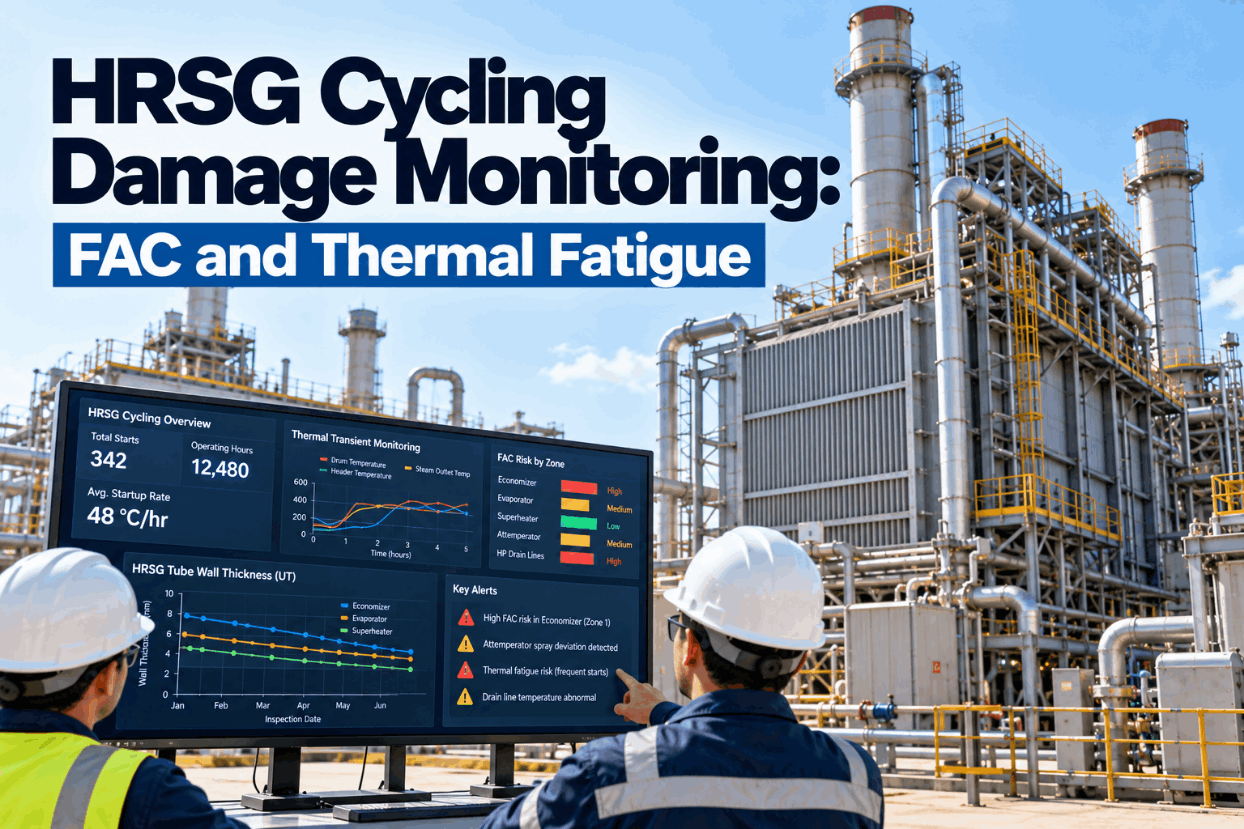
A heat recovery steam generator built for steady load now starts and stops every day at many combined cycle plants. Each start heats thick headers faster than thin tubes, sends spray water into hot steam and pushes condensate through drains that may not clear it. Over time, that adds thermal fatigue to the flow accelerated corrosion that already thins low-pressure circuits. HRSG cycling damage monitoring links start-up data to each zone, so two-shift plants inspect the right tubes first. Plan your zones with our HRSG team.
HRSG Cycling Damage Monitoring: FAC and Thermal Fatigue
Start-up transients and spray data scored for each HRSG zone, UT wall thickness trended against flow accelerated corrosion risk, and an inspection list ready for every outage.
- Damage scored zone by zone
- Wall loss trended by location
- Outage list ranked by risk
What Two-Shift Operation Does to an HRSG
Each start adds a little damage, and it adds up.
In two-shift operation, a combined cycle unit starts in the morning and shuts down at night. Each start is a thermal event. Thick-walled drums and headers heat more slowly than the tubes attached to them, so stress builds at tube-to-header welds. Cold feedwater can reach economizer panels that have soaked at higher temperature. Attemperator spray may hunt at low load and send water further than it should. Drains have to clear condensate quickly before steam flow starts. None of this shows on a single day. Damage from these events is cumulative, and the first sign is often a tube leak. Meanwhile, flow accelerated corrosion keeps thinning low-pressure circuits in the background, whether the unit cycles or not. Our HRSG specialists can review how your unit starts today.
Steady load
- Few starts a year
- Temperatures change slowly
- Drains and sprays rarely stressed
- FAC the main slow threat
Two-shift cycling
- Hundreds of starts a year
- Fast transients on headers and welds
- Sprays and drains worked every day
- Fatigue added on top of FAC
Flow Accelerated Corrosion in the HRSG
The protective oxide dissolves faster than it can form.
Flow accelerated corrosion, or FAC, happens when the protective magnetite layer on carbon steel dissolves into flowing water or a water and steam mixture. The wall thins from the inside, often with a scalloped or orange-peel look. Structural Integrity notes that carbon steel HRSG parts in the range of 100 to 250°C are susceptible. Single-phase FAC is linked to local turbulence at bends and fittings and to reducing water chemistry. Two-phase FAC appears where water and steam separate, such as LP economizer and evaporator elbows. EPRI has described FAC as the most common corrosion mechanism in HRSGs. Chromium-bearing steels, such as 1.25% chrome, are used in some areas to resist it. Map your FAC zones in a working session.
LP circuits
Economizers, preheaters, evaporators, risers.
Turbulence
Bends, fittings and inlet header tubes.
Water and steam
Elbows where the phases separate.
Chemistry and alloy
Oxidizing chemistry, pH, chrome steel.
Summary for orientation only. Follow EPRI, IAPWS and your chemistry and metallurgy advisers for limits and methods.
Attemperator Spray, Overspray and Quench
Water that does not evaporate hits hot metal.
Attemperators control steam temperature by spraying water into the steam. When the steam downstream gets close to saturation, some water does not evaporate. That water can reach superheater or reheater tubes, or strike the pipe wall, and quench hot metal. Repeated quenching causes cracks over time. Poor atomization from damaged nozzles, short straight pipe runs and spray hunting at low load all raise the risk. Leaking spray valves can also drip water into the pipe when the unit is starting or at low load. A useful check is to compare the outlet temperature with saturation temperature on every start. Ask our team how spray data is scored.
Wide swings in downstream temperature, or readings close to saturation, are common signs of overspray. Several thermocouples downstream give a clearer picture than one.
Drains, Condensate and Start-Up Damage
Condensate left in a header is a cold slug waiting for steam.
During shutdown and purge, steam condenses in superheater and reheater harps and lower headers. If drains are undersized, combined or closed, condensate can block tubes, cause tube bowing and send a slug through the piping when steam flow starts. Users have reported that lower headers drained only at the center can leave condensate at the panel ends. Drain lines that rub on the casing or liner can crack. Recording drain valve timing and drain pot levels on each start shows which zones clear well and which do not. Review your drains with our implementation team.
Blocked tubes
Condensate stops flow and tubes bow.
Uneven draining
Panel ends hold water at start.
Water hammer
Slugs move with first steam flow.
Combined lines
Higher pressure blocks lower pressure.
Drain line leaks
Stress cracks where lines meet the casing.
Feedwater shock
Cold water into soaked panels.
Know Which HRSG Zones to Inspect First
Start-up transients, spray behavior and drain timing scored for each zone, with UT wall loss trended against FAC risk and an inspection list for the next outage.
UT Wall Thickness Trending
One reading tells you the wall. Two readings tell you the rate.
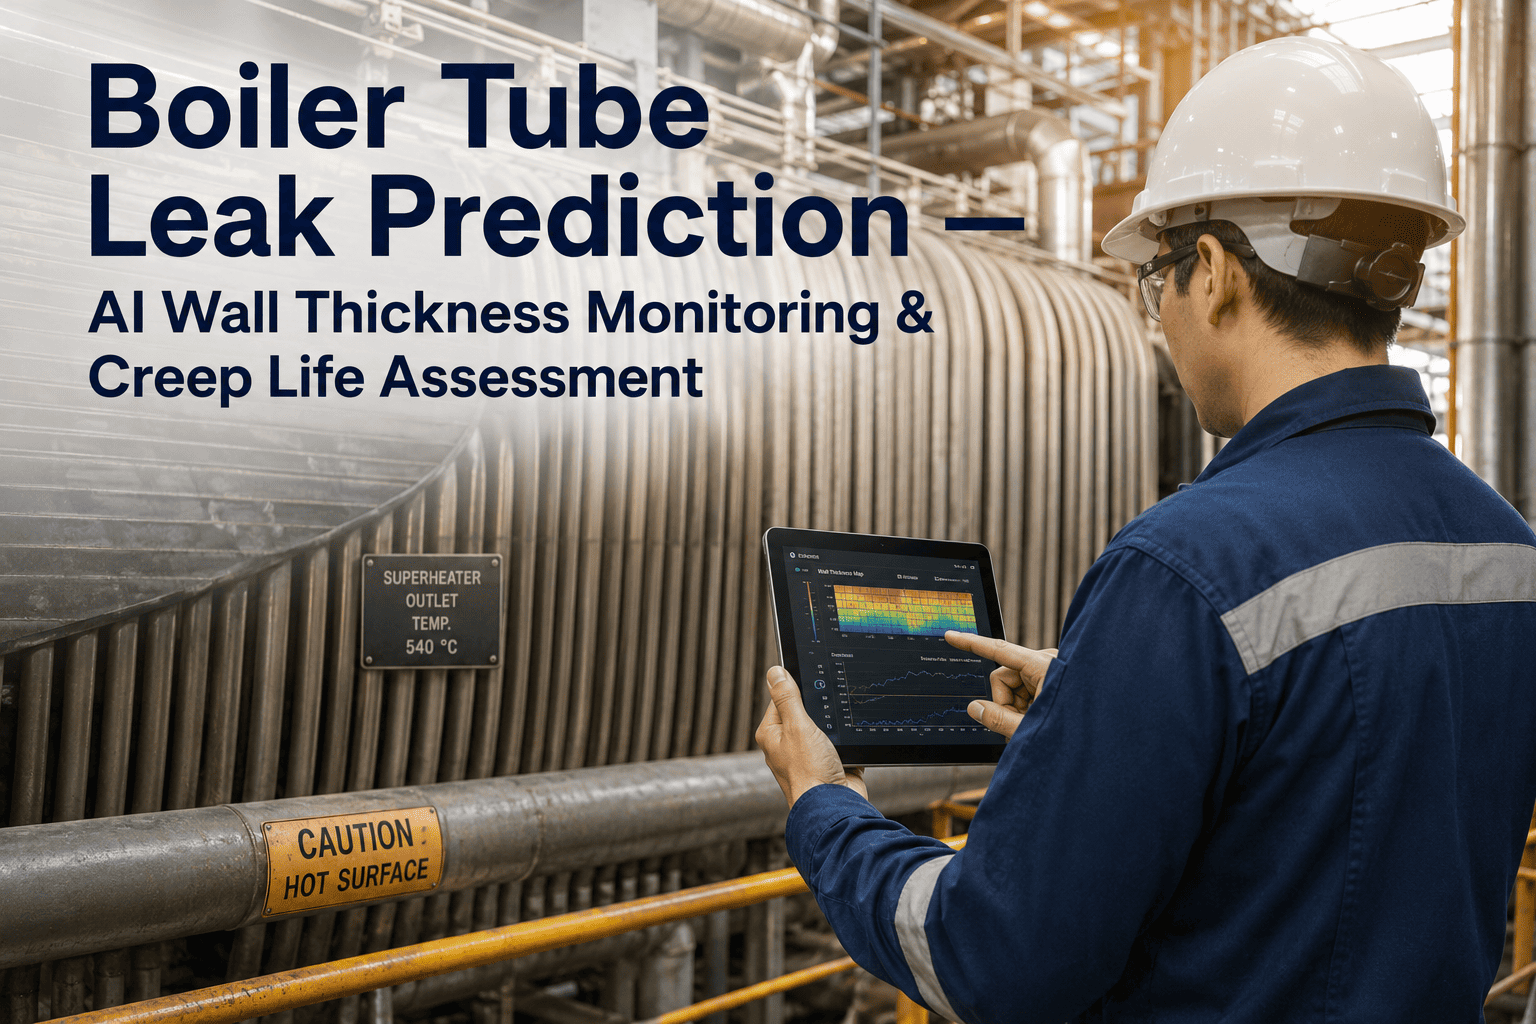
Ultrasonic thickness readings are often filed as outage reports and compared by eye. Trending them by fixed location turns them into a wall loss rate, and a rate can be projected forward to the next outage and to the minimum required thickness. The example below shows the arithmetic for one illustrative LP evaporator riser. Real minimum thickness comes from design code calculations, and readings must be taken at the same points each time for the trend to mean anything. Check your UT records with our reliability team.
Illustrative only. A linear rate is a simple first estimate. Rates can change with chemistry, load and cycling.
Scoring Each Zone for the Outage List
Each zone gets a score and a reason.
A zone score brings the signals for each part of the HRSG together: how many starts and of what type, how close spray came to saturation, how long drains took to clear and how fast the wall is thinning. The score ranks zones for the next outage. It also shows why each zone is on the list, so the inspection crew knows what to look for. The AI suggests the ranking. Your engineers decide the final scope. See the zone view in a short demo.
From Start-Up Data to Inspection List
The same steps run after every start and before every outage.
The workflow below runs in the background. Each start is logged and scored, the scores build up over the season, and the outage list is ready weeks before the outage, not days. Ask our team how it fits your outage planning.
Log
Start type, time and transients.
Check
Spray margin and drain timing.
Score
Damage added to each zone.
Trend
UT wall loss by location.
List
Ranked zones for the outage.
HRSG Cycling Damage Checklist
Eight checks before the first zone score.
Use this checklist to set up monitoring on one HRSG first. Tick items already in place. Get help with any gaps from our setup team.
HRSG Cycling Mistakes to Avoid
Most tube leaks were signalled before they happened.
These are the patterns that most often leave cycling HRSGs exposed to repeat leaks. A short HRSG review can find them.
What works
- UT at the same fixed points each outage
- Spray margin checked on every start
- Drains cleared before every start
- Outage scope driven by zone risk
What fails
- UT readings kept only in PDF reports
- Repairing a leak without finding its cause
- Combined drains at different pressures
- Same inspection scope every outage
How iFactory Runs HRSG Cycling Damage Monitoring
Cycling Damage Model, on your own network.
iFactory's Cycling Damage Model scores start-up transients and spray data for each HRSG zone, trends UT wall thickness against FAC risk and generates an inspection list for each outage. It runs on an on-prem AI server inside your plant.
Start transients
Every start logged and scored.
Spray data
Margin to saturation on each start.
Zone scores
Damage tracked part by part.
UT trending
Wall loss by fixed location.
Voice queries
Ask which zones rank first.
Outage lists
Ranked, with reasons.
Inspection scope, repair and run-or-replace decisions remain with your engineers. Figures on this page are worked examples.
Turnkey AI: Delivered, Connected and Live in 6–12 Weeks
You do not build this. It arrives ready.
iFactory ships as a pre-configured NVIDIA AI server with the software pre-loaded, racked and ready. Rack it, plug in power and Ethernet, and the AI is live on your network. Our team handles cabling, network setup, PLC, SCADA, DCS and CMMS integration, DCS historian and inspection record links, operator training and 24×7 remote monitoring. Data stays on your network. For a scope matched to your plant, request a turnkey quote.
Ship, network and data
Server installed. DCS historian, spray, drain and UT records connected. HRSG zones and FAC locations loaded.
Model training and pilot
Start scoring and zone weights agreed with your engineers. UT trends built from past outage data for one HRSG.
Go-live and training
Zone scores and outage lists live. Plant engineers trained. 24×7 monitoring begins.
Frequently Asked Questions
What is HRSG cycling damage monitoring?
Tracking start-up transients, spray behavior, drain performance and wall thinning for each HRSG zone, so inspections go where damage is most likely.
What is flow accelerated corrosion?
Thinning of carbon steel when its protective magnetite layer dissolves into flowing water or a water and steam mixture.
Where does FAC occur in an HRSG?
Mostly in low-pressure circuits: LP economizers, preheaters, evaporator tubes, headers and risers, and some IP and economizer inlet areas.
Why does two-shift operation cause thermal fatigue?
Each start heats thick and thin parts at different rates. The resulting stress at welds and headers adds up with every start.
What is attemperator overspray?
Spraying so much water that steam nears saturation and some water does not evaporate, which can quench and crack hot metal.
How is UT wall thickness trending used?
Readings at fixed points are compared across outages to find a loss rate, which is projected to the next outage and minimum thickness.
Does the AI decide what to repair?
No. It ranks zones and explains why. Your engineers decide scope, repairs and replacements.
What data do we need?
DCS historian tags for temperatures, sprays and drains, start records and past UT readings. Gaps are found during the pilot.
How do we start?
Start with one HRSG and its last two outage reports. A 6-week pilot connects data and builds zone scores. To plan it, contact our team.
Inspect the Right Tubes at the Next Outage
In thirty minutes we map your HRSG zones against starts, spray, drains and UT history and show where cycling damage is most likely. You keep the map either way.
- 1Start counts by type for the last year
- 2Attemperator outlet and spray trends
- 3UT reports from the last two outages
- 4Tube leak history with locations
- 5One leak that keeps coming back